Grundläggande statistik
| Institutionella ägare | 159 total, 159 long only, 0 short only, 0 long/short - change of 18,52% MRQ |
| Genomsnittlig portföljallokering | 0.7564 % - change of 3,66% MRQ |
| Institutionella aktier (lång) | 36 746 563 (ex 13D/G) - change of 9,36MM shares 34,19% MRQ |
| Institutionellt värde (lång) | $ 1 200 916 USD ($1000) |
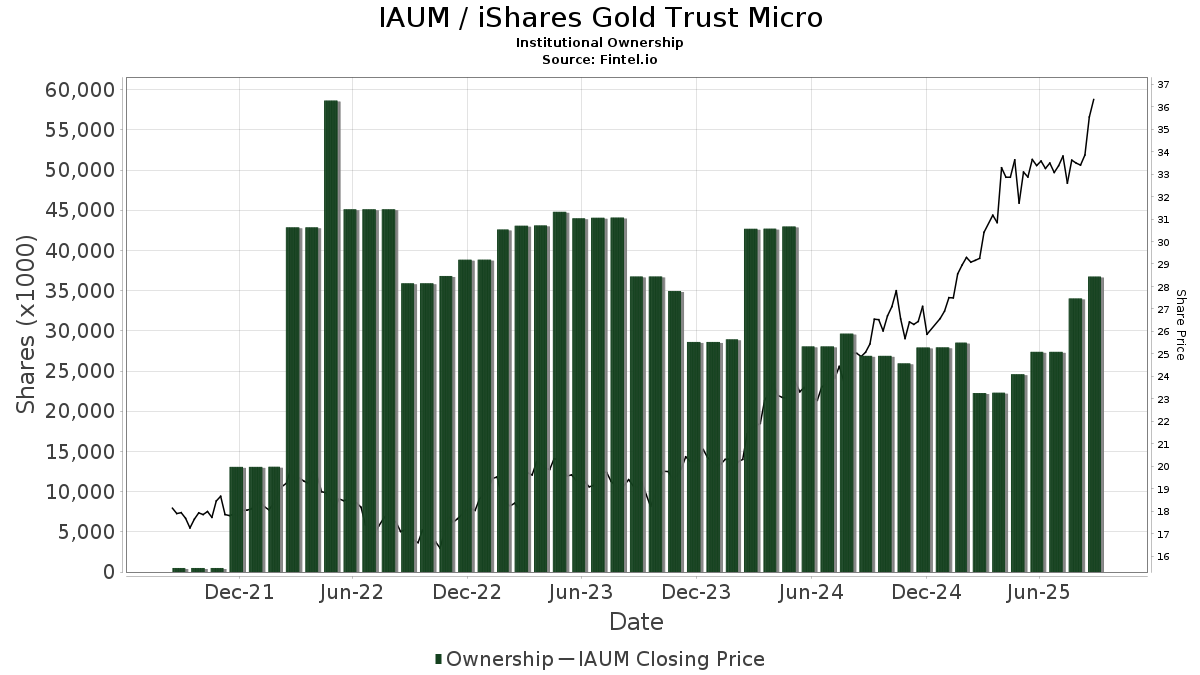
Institutionellt ägande och aktieägare
iShares Gold Trust Micro (US:IAUM) har 159 Institutionella ägare och aktieägare som har lämnat in 13D/G- eller 13F-formulär till Securities Exchange Commission (SEC). Dessa institut innehar totalt 36,746,563 aktier. Största aktieägare inkluderar Sumitomo Mitsui Trust Holdings, Inc., Adventist Health System Sunbelt Healthcare Corp, Alaska Permanent Fund Corp, School Employees Retirement Board Of Ohio, Bank Of America Corp /de/, AlTi Global, Inc., Ronald Blue Trust, Inc., Teacher Retirement System Of Texas, Vicus Capital, and Fifth Third Bancorp .
iShares Gold Trust Micro (ARCA:IAUM) Institutionell ägarstruktur visar institutioners och fonders nuvarande positioner i företaget, samt de senaste förändringarna i positionernas storlek. Större aktieägare kan vara enskilda investerare, fonder, hedgefonder eller institutioner. Bilaga 13D visar att investeraren äger (eller ägde) mer än 5% av företaget och avser (eller avsåg) att aktivt eftersträva en förändring av affärsstrategin. Schedule 13G indikerar en passiv investering på över 5%.
The share price as of September 12, 2025 is 36,34 / share. Previously, on September 16, 2024, the share price was 25,76 / share. This represents an increase of 41,07% over that period.
Fondsentimentets poäng
Fondsentimentet poängen(fka Ägarackumulation-poäng) visar vilka aktier som är mest köpta av fonder. Det är resultatet av en sofistikerad kvantitativ flerfaktormodell som identifierar företag med de högsta nivåerna av institutionell ackumulering. Poängsättningsmodellen använder en kombination av den totala ökningen av redovisade ägare, förändringarna i portföljallokeringarna för dessa ägare och andra mått. Siffran sträcker sig från 0 till 100, där högre siffror indikerar en högre nivå av ackumulering i förhållande till sina konkurrenter, och 50 är genomsnittet.
Uppdateringsfrekvens: Dagligen
Se Ownership Explorer, som innehåller en lista över de högst rankade företagen.
Institutionell sälj/köp-kvot
Förutom att rapportera vanliga eget kapital- och skuldemissioner måste institutioner med mer än 100MM tillgångar under förvaltning också avslöja sina innehav av sälj- och köpoptioner. Eftersom säljoptioner i allmänhet indikerar ett negativt sentiment och köpoptioner indikerar ett positivt sentiment, kan vi få en uppfattning om det övergripande institutionella sentimentet genom att plotta förhållandet mellan säljoptioner och köpoptioner. Diagrammet till höger visar det historiska förhållandet mellan sälj- och köpoptioner för detta instrument.
Genom att använda sälj/köp-kvoten som en indikator på aktieägarnas sentiment undviker man en av de största bristerna med att använda det totala institutionella ägandet, nämligen att en betydande del av de förvaltade tillgångarna investeras passivt för att följa index. Passivt förvaltade fonder köper vanligtvis inte optioner, så indikatorn för sälj/köp-kvoten ger en bättre bild av stämningen i aktivt förvaltade fonder.
13F- och NPORT-arkiveringar
Detaljer om 13F-arkiveringar är gratis. Detaljer om NP-arkiveringar kräver ett premiummedlemskap. Gröna rader indikerar nya positioner. Röda rader indikerar stängda positioner. Klicka på länk symbolen för att se hela transaktionshistoriken.
Uppgradera
för att låsa upp premiumdata och exportera till Excel ![]() .
.
| Fil Datum | Källa | Investerare | Typ | Genomsnittligt pris (beräknat) |
Aktier | Δ Aktier (%) |
Rapporterat värde (1000 USD) |
Δ Värde (%) |
Portföljallokering (%) |
|
|---|---|---|---|---|---|---|---|---|---|---|
| 2025-07-30 | 13F | Cullen/frost Bankers, Inc. | 2 839 | 0,00 | 94 | 5,68 | ||||
| 2025-07-09 | 13F | Reyes Financial Architecture, Inc. | 495 | 0,00 | 16 | 6,67 | ||||
| 2025-07-29 | 13F | Tradewinds Capital Management, LLC | 696 | 4,82 | 23 | 10,00 | ||||
| 2025-08-12 | 13F | Howe & Rusling Inc | 6 084 | 201 | ||||||
| 2025-07-18 | 13F | Vicus Capital | 1 114 952 | 0,12 | 36 782 | 5,97 | ||||
| 2025-08-01 | 13F | Oarsman Capital, Inc. | 48 240 | −0,43 | 1 591 | 5,36 | ||||
| 2025-07-11 | 13F | Westfuller Advisors, LLC | 22 359 | −13,39 | 738 | −8,33 | ||||
| 2025-08-06 | 13F | Atlantic Union Bankshares Corp | 50 | 2 | ||||||
| 2025-08-05 | 13F | Scarborough Advisors, LLC | 86 033 | −6,39 | 2 838 | −0,91 | ||||
| 2025-07-10 | 13F | Signal Advisors Wealth, LLC | 17 893 | −6,98 | 590 | −1,50 | ||||
| 2025-07-25 | 13F | Fifth Third Wealth Advisors LLC | 116 297 | 1 011,61 | 3 837 | 1 076,69 | ||||
| 2025-08-13 | 13F | Northwestern Mutual Wealth Management Co | 7 | 0 | ||||||
| 2025-07-11 | 13F | Farther Finance Advisors, LLC | 100 | 0,00 | 3 | 0,00 | ||||
| 2025-08-11 | 13F | Principal Securities, Inc. | 53 109 | 1 752 | ||||||
| 2025-08-12 | 13F | MAI Capital Management | 8 028 | 0,00 | 265 | 5,60 | ||||
| 2025-08-14 | 13F | UBS Group AG | 100 | 3 | ||||||
| 2025-07-10 | 13F | Wedmont Private Capital | 31 795 | 129,40 | 1 051 | 135,65 | ||||
| 2025-05-05 | 13F | Csenge Advisory Group | 0 | −100,00 | 0 | −100,00 | ||||
| 2025-07-18 | 13F | Truist Financial Corp | 139 740 | 4 589 | ||||||
| 2025-08-12 | 13F | Tableaux Llc | 0 | −100,00 | 0 | |||||
| 2025-08-13 | 13F | Flow Traders U.s. Llc | 87 111 | 3 | ||||||
| 2025-08-14 | 13F | Smartleaf Asset Management LLC | 3 361 | −64,23 | 110 | −62,15 | ||||
| 2025-04-17 | 13F | Sound Income Strategies, LLC | 0 | −100,00 | 0 | |||||
| 2025-07-17 | 13F | Fifth Third Securities, Inc. | 28 202 | 930 | ||||||
| 2025-07-15 | 13F | Armis Advisers, LLC | 18 731 | −0,20 | 618 | 5,47 | ||||
| 2025-05-15 | 13F/A | Orion Portfolio Solutions, LLC | 11 933 | 2,10 | 372 | 21,64 | ||||
| 2025-08-04 | 13F | Pensionmark Financial Group, Llc | 210 409 | −5,75 | 6 941 | −0,24 | ||||
| 2025-08-12 | 13F | AlphaCore Capital LLC | 618 282 | 0,91 | 20 397 | 6,81 | ||||
| 2025-08-13 | 13F | EverSource Wealth Advisors, LLC | 619 | 20 | ||||||
| 2025-08-15 | 13F | Howland Capital Management Llc | 230 535 | 145,83 | 7 605 | 160,18 | ||||
| 2025-07-31 | 13F | AlTi Global, Inc. | 1 400 000 | 46 193 | ||||||
| 2025-08-01 | 13F | Envestnet Asset Management Inc | 104 735 | 1 332,18 | 3 455 | 1 422,03 | ||||
| 2025-08-12 | 13F | Marshall & Sterling Wealth Advisors Inc. | 860 | 28 | ||||||
| 2025-07-15 | 13F | Fifth Third Bancorp | 705 180 | 22,73 | 23 264 | 29,90 | ||||
| 2025-08-13 | 13F | Cresset Asset Management, LLC | 26 327 | −9,72 | 869 | −4,41 | ||||
| 2025-08-14 | 13F | Jane Street Group, Llc | 417 287 | 13 766 | ||||||
| 2025-07-28 | 13F | Kiker Wealth Management, LLC | 1 500 | −34,78 | 49 | −30,99 | ||||
| 2025-07-31 | 13F | CAP Partners, LLC | 7 880 | 9,02 | 260 | 15,11 | ||||
| 2025-08-01 | 13F | Teacher Retirement System Of Texas | 1 300 000 | 0,00 | 42 887 | 5,84 | ||||
| 2025-08-13 | 13F | Jackson Creek Investment Advisors LLC | 14 718 | −7,02 | 0 | |||||
| 2025-08-28 | 13F | Stark Wealth Management LLC | 25 630 | 823 | ||||||
| 2025-07-25 | 13F | Atria Wealth Solutions, Inc. | 167 703 | −45,25 | 5 533 | −42,06 | ||||
| 2025-08-12 | 13F | Walled Lake Planning & Wealth Management, Llc | 14 036 | 463 | ||||||
| 2025-08-14 | 13F | CoreCap Advisors, LLC | 68 | 0,00 | 2 | 0,00 | ||||
| 2025-05-14 | 13F | Comerica Bank | 0 | −100,00 | 0 | |||||
| 2025-08-08 | 13F | Cetera Investment Advisers | 67 624 | 110,10 | 2 231 | 122,33 | ||||
| 2025-07-30 | 13F | Brookstone Capital Management | 13 197 | 11,14 | 435 | 17,57 | ||||
| 2025-08-06 | 13F | Prospera Financial Services Inc | 60 903 | −21,10 | 2 009 | −16,47 | ||||
| 2025-08-06 | 13F | AE Wealth Management LLC | 449 599 | 41,87 | 14 832 | 50,17 | ||||
| 2025-08-14 | 13F | Raymond James Financial Inc | 150 685 | 29,22 | 4 971 | 36,79 | ||||
| 2025-08-14 | 13F | TCG Advisory Services, LLC | 11 728 | −49,91 | 387 | −47,05 | ||||
| 2025-08-11 | 13F | Slagle Financial, LLC | 13 143 | −17,92 | 434 | −13,23 | ||||
| 2025-08-11 | 13F | Kingdom Financial Group LLC. | 0 | −100,00 | 0 | |||||
| 2025-08-12 | 13F | Choate Investment Advisors | 30 932 | 1 020 | ||||||
| 2025-08-14 | 13F | Mercer Global Advisors Inc /adv | 61 166 | 2 018 | ||||||
| 2025-07-08 | 13F | Nbc Securities, Inc. | 1 275 | 0,00 | 0 | |||||
| 2025-07-21 | 13F | Ameritas Advisory Services, LLC | 2 303 | 76 | ||||||
| 2025-08-06 | 13F | Aspect Partners, LLC | 4 985 | 164 | ||||||
| 2025-08-13 | 13F | Quadrature Capital Ltd | 466 896 | 15 403 | ||||||
| 2025-07-17 | 13F | Beacon Capital Management, LLC | 0 | −100,00 | 0 | |||||
| 2025-07-07 | 13F | Versant Capital Management, Inc | 256 302 | 10,38 | 8 455 | 16,83 | ||||
| 2025-08-11 | 13F | HighTower Advisors, LLC | 24 184 | 798 | ||||||
| 2025-08-13 | 13F | Avestar Capital, LLC | 303 920 | 10 026 | ||||||
| 2025-08-14 | 13F | Colony Group, LLC | 9 545 | 315 | ||||||
| 2025-08-01 | 13F | MorganRosel Wealth Management, LLC | 299 558 | 8,62 | 9 882 | 14,96 | ||||
| 2025-08-04 | 13F | Arkadios Wealth Advisors | 0 | −100,00 | 0 | |||||
| 2025-07-28 | 13F | Harbour Investments, Inc. | 200 | 7 | ||||||
| 2025-08-12 | 13F | LPL Financial LLC | 6 804 | −9,59 | 224 | −4,27 | ||||
| 2025-07-23 | 13F | Richardson Capital Management LLC | 0 | −100,00 | 0 | |||||
| 2025-07-17 | 13F | Spectrum Strategic Capital Management, LLC | 131 134 | 4 326 | ||||||
| 2025-08-04 | 13F | Mayflower Financial Advisors, LLC | 14 969 | 494 | ||||||
| 2025-08-12 | 13F | Archer Investment Corp | 6 156 | 4,07 | 203 | 10,33 | ||||
| 2025-08-14 | 13F | Fmr Llc | 617 | −89,64 | 20 | −89,19 | ||||
| 2025-08-07 | 13F | Howard Bailey Securities, Llc | 9 837 | −15,13 | 325 | −10,25 | ||||
| 2025-07-22 | 13F | Merit Financial Group, LLC | 9 860 | 325 | ||||||
| 2025-07-25 | 13F | We Are One Seven, LLC | 193 100 | 21,25 | 6 370 | 28,32 | ||||
| 2025-08-14 | 13F | Ancora Advisors, LLC | 132 866 | 28,77 | 4 383 | 36,29 | ||||
| 2025-07-24 | 13F | NavPoint Financial, Inc. | 15 218 | 0,00 | 502 | 5,91 | ||||
| 2025-07-11 | 13F | SILVER OAK SECURITIES, Inc | 6 790 | 3,78 | 224 | 11,44 | ||||
| 2025-07-15 | 13F | Family Investment Center, Inc. | 18 702 | −31,84 | 617 | −27,95 | ||||
| 2025-08-14 | 13F | Wealth Preservation Advisors, LLC | 996 | 0,00 | 33 | 3,23 | ||||
| 2025-07-24 | 13F | Williams & Novak, LLC | 8 975 | −11,07 | 296 | −5,43 | ||||
| 2025-08-28 | 13F | China Universal Asset Management Co., Ltd. | 412 500 | 51,38 | 13 608 | 60,23 | ||||
| 2025-05-12 | 13F | Sandy Spring Bank | 50 | 2 | ||||||
| 2025-08-11 | 13F | M Wealth Management, LLC | 76 528 | 0,00 | 2 525 | 5,83 | ||||
| 2025-08-18 | 13F | Tactive Advisors, LLC | 40 303 | 1 330 | ||||||
| 2025-07-30 | 13F | Castle Wealth Management Llc | 147 059 | −13,25 | 4 851 | −8,19 | ||||
| 2025-07-31 | 13F | Fielder Capital Group LLC | 359 918 | −15,27 | 11 874 | −10,32 | ||||
| 2025-08-01 | 13F | Cedar Point Capital Partners, LLC | 36 424 | 13,23 | 1 202 | 19,86 | ||||
| 2025-07-24 | 13F | Costello Asset Management, INC | 300 | 10 | ||||||
| 2025-07-24 | 13F | IFP Advisors, Inc | 23 971 | 77,35 | 791 | 87,65 | ||||
| 2025-08-14 | 13F | GWM Advisors LLC | 30 549 | −0,59 | 1 008 | 5,22 | ||||
| 2025-08-12 | 13F | Insigneo Advisory Services, Llc | 21 562 | −22,98 | 711 | −18,46 | ||||
| 2025-07-25 | 13F | Stonehage Fleming Financial Services Holdings Ltd | 90 315 | 10,14 | 2 979 | 16,59 | ||||
| 2025-08-06 | 13F | Vestmark Advisory Solutions, Inc. | 12 141 | −4,39 | 401 | 1,27 | ||||
| 2025-08-12 | 13F | Global Retirement Partners, LLC | 6 217 | 205 | ||||||
| 2025-08-12 | 13F | Proequities, Inc. | 0 | 0 | ||||||
| 2025-08-14 | 13F | Mml Investors Services, Llc | 138 862 | 1 458,50 | 5 | |||||
| 2025-08-01 | 13F | Rossby Financial, LCC | 1 161 | 1 558,57 | 38 | 1 800,00 | ||||
| 2025-08-06 | 13F | True Wealth Design, LLC | 1 462 | 0,00 | 48 | 6,67 | ||||
| 2025-08-06 | 13F | Commonwealth Equity Services, Llc | 16 654 | 133,31 | 1 | |||||
| 2025-08-13 | 13F | Capital Analysts, Inc. | 320 | 0,00 | 0 | |||||
| 2025-08-12 | 13F | Richard W. Paul & Associates, LLC | 66 | −19,51 | 2 | 0,00 | ||||
| 2025-07-18 | 13F | B.O.S.S. Retirement Advisors, LLC | 33 544 | −21,87 | 1 107 | −17,34 | ||||
| 2025-07-30 | 13F | Evermay Wealth Management Llc | 68 530 | −18,41 | 2 261 | −13,67 | ||||
| 2025-07-15 | 13F | SJS Investment Consulting Inc. | 1 000 | 0,00 | 33 | 3,23 | ||||
| 2025-09-04 | 13F/A | Advisor Group Holdings, Inc. | 4 305 | 32,91 | 142 | 42,00 | ||||
| 2025-08-11 | 13F | Pineridge Advisors LLC | 2 674 | −46,85 | 88 | −43,59 | ||||
| 2025-08-14 | 13F | Goldman Sachs Group Inc | 0 | −100,00 | 0 | |||||
| 2025-08-08 | 13F | Pnc Financial Services Group, Inc. | 813 | 0,00 | 27 | 4,00 | ||||
| 2025-08-12 | 13F | Running Point Capital Advisors, LLC | 71 993 | −4,09 | 2 375 | 1,54 | ||||
| 2025-07-10 | 13F | Oliver Lagore Vanvalin Investment Group | 0 | −100,00 | 0 | |||||
| 2025-07-25 | 13F | RHS Financial, LLC | 0 | −100,00 | 0 | |||||
| 2025-08-05 | 13F | Hunter Associates Investment Management Llc | 33 534 | 0,00 | 1 | 0,00 | ||||
| 2025-08-14 | 13F | Alaska Permanent Fund Corp | 2 914 000 | −17,40 | 95 608 | −17,53 | ||||
| 2025-05-15 | 13F | Tower Research Capital LLC (TRC) | 0 | −100,00 | 0 | |||||
| 2025-07-10 | 13F | Myriad Asset Management US LP | 120 142 | 3 963 | ||||||
| 2025-07-17 | 13F | School Employees Retirement Board Of Ohio | 2 274 084 | 0,00 | 75 022 | 5,84 | ||||
| 2025-08-13 | 13F | Renaissance Technologies Llc | 0 | −100,00 | 0 | |||||
| 2025-07-16 | 13F | Signaturefd, Llc | 150 | 0,00 | 5 | 0,00 | ||||
| 2025-08-01 | 13F | Oversea-Chinese Banking CORP Ltd | 63 891 | 0,00 | 2 108 | 5,83 | ||||
| 2025-08-27 | 13F/A | Brinker Capital Investments, LLC | 25 153 | 110,79 | 830 | 123,45 | ||||
| 2025-07-15 | 13F | Signet Financial Management, Llc | 97 971 | 233,62 | 3 232 | 253,22 | ||||
| 2025-08-13 | 13F | Transce3nd, LLC | 164 | −14,14 | 5 | 0,00 | ||||
| 2025-08-14 | 13F | Royal Bank Of Canada | 2 732 | 61,47 | 91 | 75,00 | ||||
| 2025-08-18 | 13F | Hollencrest Capital Management | 1 786 | 0,00 | 59 | 5,45 | ||||
| 2025-08-14 | 13F | Napa Wealth Management | 113 374 | −24,30 | 3 740 | −19,88 | ||||
| 2025-07-10 | 13F | Exchange Traded Concepts, Llc | 0 | −100,00 | 0 | |||||
| 2025-08-26 | NP | USAF - Atlas America Fund | 47 960 | 2,08 | 1 582 | 8,06 | ||||
| 2025-08-14 | 13F | Bank Of America Corp /de/ | 2 215 599 | 14,22 | 73 093 | 20,89 | ||||
| 2025-08-08 | NP | QALTX - Quantified Alternative Investment Fund Investor Class Shares | 0 | −100,00 | 0 | −100,00 | ||||
| 2025-08-14 | 13F | Wiley Bros.-aintree Capital, Llc | 6 958 | 230 | ||||||
| 2025-08-25 | 13F/A | Neuberger Berman Group LLC | 6 500 | −69,77 | 214 | −68,06 | ||||
| 2025-07-24 | 13F | Ulland Investment Advisors, LLC | 0 | −100,00 | 0 | |||||
| 2025-07-11 | 13F | Deane Retirement Strategies, Inc. | 2 072 | −24,76 | 68 | −20,00 | ||||
| 2025-08-13 | 13F | Cerity Partners LLC | 18 283 | 4,28 | 603 | 10,44 | ||||
| 2025-08-14 | 13F | Wells Fargo & Company/mn | 60 | 0,00 | 2 | 0,00 | ||||
| 2025-07-10 | 13F | Wealth Enhancement Advisory Services, Llc | 8 666 | 288 | ||||||
| 2025-07-15 | 13F | Traction Financial Partners, LLC | 7 105 | 234 | ||||||
| 2025-07-14 | 13F | Rooted Wealth Advisors, Inc. | 23 471 | 4,56 | 786 | 15,61 | ||||
| 2025-07-31 | 13F | Turning Point Benefit Group, Inc. | 70 531 | −8,47 | 2 327 | 1,84 | ||||
| 2025-08-12 | 13F | SRS Capital Advisors, Inc. | 4 887 | 0,00 | 161 | 5,92 | ||||
| 2025-07-24 | 13F | Ronald Blue Trust, Inc. | 1 385 449 | 2 907,79 | 45 706 | 3 085,02 | ||||
| 2025-07-23 | 13F | Raub Brock Capital Management LP | 185 660 | 6 125 | ||||||
| 2025-08-04 | 13F | Atria Investments Llc | 9 082 | 300 | ||||||
| 2025-08-14 | 13F | Citadel Advisors Llc | 58 663 | −42,65 | 1 935 | −39,30 | ||||
| 2025-07-30 | 13F | Ardent Capital Management, Inc. | 28 500 | 0,00 | 940 | 5,86 | ||||
| 2025-07-25 | 13F | Carl Stuart Investment Advisor, Inc | 8 049 | 266 | ||||||
| 2025-08-14 | 13F | Sunbelt Securities, Inc. | 0 | −100,00 | 0 | |||||
| 2025-08-14 | 13F | Two Sigma Securities, Llc | 6 804 | 224 | ||||||
| 2025-08-12 | 13F | XTX Topco Ltd | 0 | −100,00 | 0 | |||||
| 2025-08-13 | 13F | Congress Wealth Management LLC / DE / | 75 971 | −0,50 | 2 506 | 5,34 | ||||
| 2025-08-11 | 13F | Plum Street Advisors, LLC | 9 796 | −13,96 | 323 | −8,76 | ||||
| 2025-08-01 | 13F | Brookwood Investment Group LLC | 43 142 | −0,67 | 1 423 | 5,17 | ||||
| 2025-08-12 | 13F | PSI Advisors, LLC | 0 | −100,00 | 0 | |||||
| 2025-05-01 | 13F | Quest 10 Wealth Builders, Inc. | 4 554 | 0,69 | 142 | 19,49 | ||||
| 2025-08-14 | 13F | Federation des caisses Desjardins du Quebec | 0 | −100,00 | 0 | |||||
| 2025-08-05 | 13F | Advisors Preferred, LLC | 0 | −100,00 | 0 | |||||
| 2025-08-05 | 13F | Bank Of Montreal /can/ | 1 860 | 0,00 | 61 | 7,02 | ||||
| 2025-07-28 | 13F | RFG Advisory, LLC | 476 293 | 72,41 | 15 713 | 82,49 | ||||
| 2025-07-14 | 13F | U.S. Capital Wealth Advisors, LLC | 7 360 | 243 | ||||||
| 2025-08-15 | 13F | Kestra Advisory Services, LLC | 22 872 | 36,77 | 755 | 44,72 | ||||
| 2025-08-11 | 13F | United Advisor Group, LLC | 7 170 | 237 | ||||||
| 2025-08-14 | 13F | Vident Advisory, LLC | 667 754 | 22 029 | ||||||
| 2025-08-14 | 13F | Greenline Partners, LLC | 109 311 | −1,77 | 3 606 | 3,98 | ||||
| 2025-08-04 | 13F | Rede Wealth, LLC | 37 625 | 2,99 | 1 241 | 9,05 | ||||
| 2025-08-04 | 13F | Creekmur Asset Management LLC | 739 | 142,30 | 24 | 166,67 | ||||
| 2025-07-14 | 13F | Painted Porch Advisors LLC | 10 500 | 346 | ||||||
| 2025-07-31 | 13F | Cambridge Investment Research Advisors, Inc. | 30 053 | 99,49 | 1 | |||||
| 2025-07-31 | 13F | Sumitomo Mitsui Trust Holdings, Inc. | 9 300 000 | 39,85 | 306 807 | 48,02 | ||||
| 2025-08-12 | 13F | Maripau Wealth Management Llc | 15 148 | −8,14 | 500 | −2,92 | ||||
| 2025-07-17 | 13F | Sfm, Llc | 218 143 | 73,24 | 7 197 | 83,38 | ||||
| 2025-07-31 | 13F | United Community Bank | 360 013 | 883,24 | 11 877 | 940,84 | ||||
| 2025-08-14 | 13F | CoreFirst Bank & Trust | 3 000 | 99 | ||||||
| 2025-08-12 | 13F | Jpmorgan Chase & Co | 690 733 | 12,18 | 22 787 | 18,73 | ||||
| 2025-07-07 | 13F | Thurston, Springer, Miller, Herd & Titak, Inc. | 700 | 250,00 | 23 | 283,33 | ||||
| 2025-08-14 | 13F | Susquehanna International Group, Llp | 9 981 | 329 | ||||||
| 2025-07-25 | 13F | Cwm, Llc | 1 450 | −24,44 | 0 | |||||
| 2025-05-02 | 13F | Wealthfront Advisers Llc | 0 | −100,00 | 0 | −100,00 | ||||
| 2025-04-28 | NP | MPAY - Akros Monthly Payout ETF | 5 812 | 1,64 | 166 | 9,27 | ||||
| 2025-08-06 | 13F | SOUTH STATE Corp | 4 205 | 6,32 | 139 | 12,20 | ||||
| 2025-08-05 | 13F | Huntington National Bank | 19 | |||||||
| 2025-08-12 | 13F | Adventist Health System Sunbelt Healthcare Corp | 3 463 784 | 49,94 | 114 270 | 58,69 |