Grundläggande statistik
| Institutionella ägare | 213 total, 213 long only, 0 short only, 0 long/short - change of 18,89% MRQ |
| Genomsnittlig portföljallokering | 0.1240 % - change of 4,72% MRQ |
| Institutionella aktier (lång) | 22 793 742 (ex 13D/G) - change of 2,32MM shares 11,31% MRQ |
| Institutionellt värde (lång) | $ 1 037 023 USD ($1000) |
Institutionellt ägande och aktieägare
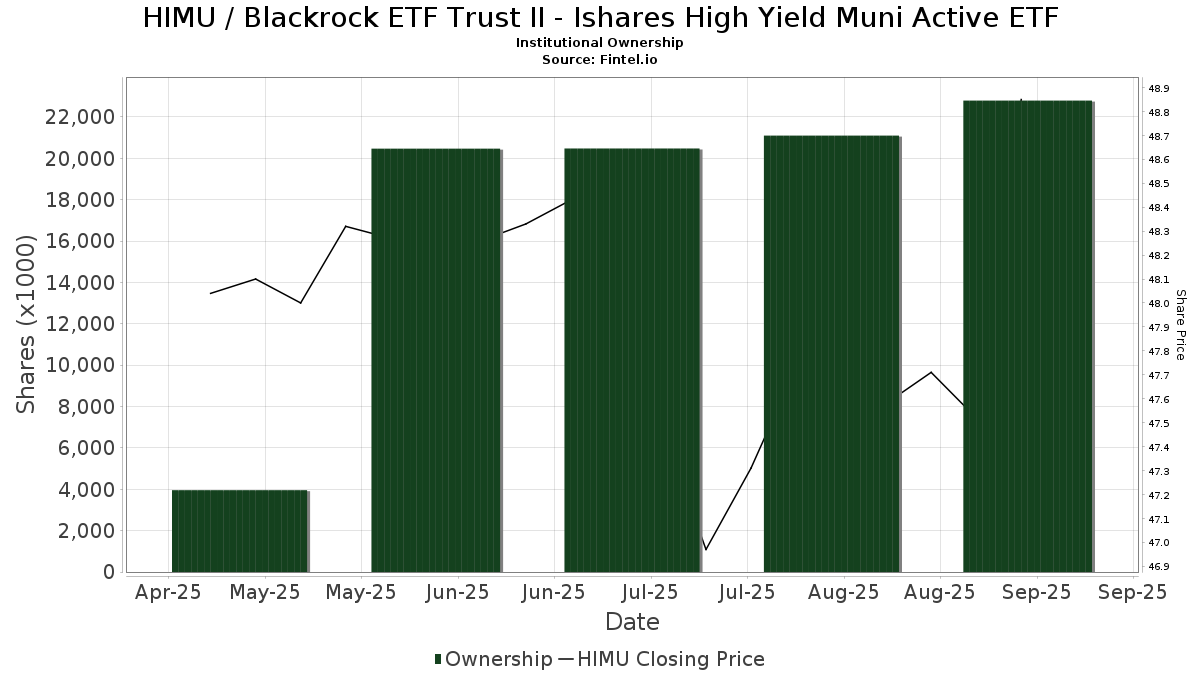
Blackrock ETF Trust II - Ishares High Yield Muni Active ETF (US:HIMU) har 213 Institutionella ägare och aktieägare som har lämnat in 13D/G- eller 13F-formulär till Securities Exchange Commission (SEC). Dessa institut innehar totalt 22,793,742 aktier. Största aktieägare inkluderar Envestnet Asset Management Inc, BlackRock, Inc., LPL Financial LLC, Bank Of America Corp /de/, Jpmorgan Chase & Co, Jones Financial Companies Lllp, Morgan Stanley, Wells Fargo & Company/mn, Commonwealth Equity Services, Llc, and Tolleson Wealth Management, Inc. .
Blackrock ETF Trust II - Ishares High Yield Muni Active ETF (BATS:HIMU) Institutionell ägarstruktur visar institutioners och fonders nuvarande positioner i företaget, samt de senaste förändringarna i positionernas storlek. Större aktieägare kan vara enskilda investerare, fonder, hedgefonder eller institutioner. Bilaga 13D visar att investeraren äger (eller ägde) mer än 5% av företaget och avser (eller avsåg) att aktivt eftersträva en förändring av affärsstrategin. Schedule 13G indikerar en passiv investering på över 5%.
The share price as of September 17, 2025 is 49,25 / share. Previously, on February 10, 2025, the share price was 50,38 / share. This represents a decline of 2,24% over that period.
Fondsentimentets poäng
Fondsentimentet poängen(fka Ägarackumulation-poäng) visar vilka aktier som är mest köpta av fonder. Det är resultatet av en sofistikerad kvantitativ flerfaktormodell som identifierar företag med de högsta nivåerna av institutionell ackumulering. Poängsättningsmodellen använder en kombination av den totala ökningen av redovisade ägare, förändringarna i portföljallokeringarna för dessa ägare och andra mått. Siffran sträcker sig från 0 till 100, där högre siffror indikerar en högre nivå av ackumulering i förhållande till sina konkurrenter, och 50 är genomsnittet.
Uppdateringsfrekvens: Dagligen
Se Ownership Explorer, som innehåller en lista över de högst rankade företagen.
Institutionell sälj/köp-kvot
Förutom att rapportera vanliga eget kapital- och skuldemissioner måste institutioner med mer än 100MM tillgångar under förvaltning också avslöja sina innehav av sälj- och köpoptioner. Eftersom säljoptioner i allmänhet indikerar ett negativt sentiment och köpoptioner indikerar ett positivt sentiment, kan vi få en uppfattning om det övergripande institutionella sentimentet genom att plotta förhållandet mellan säljoptioner och köpoptioner. Diagrammet till höger visar det historiska förhållandet mellan sälj- och köpoptioner för detta instrument.
Genom att använda sälj/köp-kvoten som en indikator på aktieägarnas sentiment undviker man en av de största bristerna med att använda det totala institutionella ägandet, nämligen att en betydande del av de förvaltade tillgångarna investeras passivt för att följa index. Passivt förvaltade fonder köper vanligtvis inte optioner, så indikatorn för sälj/köp-kvoten ger en bättre bild av stämningen i aktivt förvaltade fonder.
13D/G-Arkiveringar
Vi presenterar 13D/G-arkiveringar separat från 13F-arkiveringar på grund av att de behandlas olika av SEC. 13D/G-arkiveringar kan lämnas in av grupper av investerare (med en ledare), medan 13F-arkiveringar inte kan det. Detta leder till situationer där en investerare kan lämna in en 13D/G-ansökan med ett värde för de totala aktierna (vilket motsvarar alla aktier som ägs av investerargruppen), men sedan lämna in en 13F-ansökan med ett annat värde för de totala aktierna (vilket motsvarar enbart deras eget ägande). Detta innebär att aktieägandet i 13D/G-arkiveringar och 13F-arkiveringar ofta inte är direkt jämförbara, så vi presenterar dem separat.
Notera: Från och med den 16 maj 2021 visar vi inte längre ägare som inte har lämnat in en 13D/G under det senaste året. Tidigare visade vi hela historiken för 13D/G-arkiveringar. I allmänhet måste enheter som är skyldiga att lämna in 13D/G-arkiveringar lämna in minst en gång per år innan de lämnar in en stängningsarkivering. Fonder avslutar dock ibland positioner utan att lämna in en avslutande arkivering (dvs. de avvecklar), så att visa hela historiken resulterade ibland i förvirring om det nuvarande ägandet. För att förhindra förvirring visar vi nu endast "nuvarande" ägare - det vill säga ägare som har lämnat in en ansökan under det senaste året.
Upgrade to unlock premium data.
| Fil Datum | Formulär | Investerare | Föregående aktier |
Senaste aktier |
Δ Aktier (Procent) |
Ägande (Procent) |
Δ Ägande (Procent) |
|
|---|---|---|---|---|---|---|---|---|
| 2025-04-15 | BlackRock Portfolio Management LLC | 2,481,794 | 6.70 |
13F- och NPORT-arkiveringar
Detaljer om 13F-arkiveringar är gratis. Detaljer om NP-arkiveringar kräver ett premiummedlemskap. Gröna rader indikerar nya positioner. Röda rader indikerar stängda positioner. Klicka på länk symbolen för att se hela transaktionshistoriken.
Uppgradera
för att låsa upp premiumdata och exportera till Excel ![]() .
.
| Fil Datum | Källa | Investerare | Typ | Genomsnittligt pris (beräknat) |
Aktier | Δ Aktier (%) |
Rapporterat värde (1000 USD) |
Δ Värde (%) |
Portföljallokering (%) |
|
|---|---|---|---|---|---|---|---|---|---|---|
| 2025-07-24 | 13F | Robertson Stephens Wealth Management, LLC | 14 385 | 18,33 | 700 | 16,11 | ||||
| 2025-07-15 | 13F | Mather Group, Llc. | 0 | −100,00 | 0 | |||||
| 2025-08-11 | 13F | Aptus Capital Advisors, LLC | 79 355 | 865,98 | 3 859 | 850,49 | ||||
| 2025-08-14 | 13F | EP Wealth Advisors, Inc. | 4 347 | 211 | ||||||
| 2025-07-25 | 13F | Retirement Planning Group, Llc / Ny | 5 828 | −1,39 | 283 | −3,08 | ||||
| 2025-08-07 | 13F | Shared Vision Wealth Group LLC | 4 901 | −25,60 | 233 | −28,83 | ||||
| 2025-08-19 | 13F | Advisory Services Network, LLC | 4 831 | −28,31 | 229 | −31,23 | ||||
| 2025-08-15 | 13F | Equitable Holdings, Inc. | 52 772 | −6,69 | 2 566 | −8,39 | ||||
| 2025-08-14 | 13F | Mariner, LLC | 20 743 | 58,96 | 1 009 | 56,04 | ||||
| 2025-07-24 | 13F | Eastern Bank | 1 459 | 71 | ||||||
| 2025-06-18 | NP | RWMIX - Redwood Managed Municipal Income Fund Class I | 23 | 1 | ||||||
| 2025-08-14 | 13F | Mercer Global Advisors Inc /adv | 29 218 | 0,89 | 1 421 | −0,98 | ||||
| 2025-08-05 | 13F | GPS Wealth Strategies Group, LLC | 4 109 | 21,00 | 200 | 18,45 | ||||
| 2025-07-31 | 13F | Sentinel Trust Co Lba | 0 | −100,00 | 0 | |||||
| 2025-08-14 | 13F | Keebeck Wealth Management, LLC | 18 992 | 180,12 | 924 | 175,52 | ||||
| 2025-08-14 | 13F | Gen-Wealth Partners Inc | 4 065 | 20,80 | 198 | 18,67 | ||||
| 2025-08-13 | 13F | Transce3nd, LLC | 25 | 0,00 | 1 | 0,00 | ||||
| 2025-07-15 | 13F | Droms Strauss Advisors Inc /mo/ /adv | 125 499 | 6 103 | ||||||
| 2025-07-30 | 13F | Caliber Wealth Management, LLC / KS | 4 254 | 207 | ||||||
| 2025-07-10 | 13F | Wealth Enhancement Advisory Services, Llc | 35 753 | −18,58 | 1 731 | −20,41 | ||||
| 2025-08-15 | 13F | Semmax Financial Advisors Inc. | 3 560 | 1,22 | 169 | 0,00 | ||||
| 2025-08-05 | 13F | NewSquare Capital LLC | 201 | 10 | ||||||
| 2025-08-12 | 13F | Financial Advocates Investment Management | 5 744 | −0,17 | 279 | −1,76 | ||||
| 2025-07-22 | 13F | Firethorn Wealth Partners, Llc | 4 194 | −14,23 | 204 | −16,12 | ||||
| 2025-08-12 | 13F | LPL Financial LLC | 1 925 282 | 11,34 | 93 626 | 9,31 | ||||
| 2025-08-01 | 13F | Rossby Financial, LCC | 167 | 1,21 | 8 | 14,29 | ||||
| 2025-08-14 | 13F | Jane Street Group, Llc | 0 | −100,00 | 0 | |||||
| 2025-08-14 | 13F | Old Mission Capital Llc | 0 | −100,00 | 0 | |||||
| 2025-08-11 | 13F | Eq Llc | 5 472 | 266 | ||||||
| 2025-07-07 | 13F | Versant Capital Management, Inc | 18 741 | 911 | ||||||
| 2025-07-23 | 13F | True Vision MN LLC | 9 669 | 7,02 | 470 | 5,15 | ||||
| 2025-08-13 | 13F | GeoWealth Management, LLC | 1 614 | 78 | ||||||
| 2025-08-04 | 13F | ArborFi Advisors, LLC | 4 619 | 225 | ||||||
| 2025-08-07 | 13F | Summit X, LLC | 8 586 | 91,87 | 418 | 88,69 | ||||
| 2025-08-28 | NP | BlackRock Funds V - BlackRock Strategic Income Opportunities Portfolio Investor A Shares | 396 000 | 0,00 | 19 257 | −1,82 | ||||
| 2025-08-12 | 13F | Coldstream Capital Management Inc | 0 | −100,00 | 0 | |||||
| 2025-07-25 | 13F | Cwm, Llc | 88 175 | 9,67 | 4 | 33,33 | ||||
| 2025-08-14 | 13F | CoreCap Advisors, LLC | 482 | −4,37 | 23 | −4,17 | ||||
| 2025-07-24 | 13F | Us Bancorp \de\ | 4 165 | 203 | ||||||
| 2025-07-17 | 13F | Janney Montgomery Scott LLC | 83 127 | 1 725,76 | 4 | |||||
| 2025-08-28 | 13F/A | Tolleson Wealth Management, Inc. | 464 974 | 12,75 | 22 612 | 10,70 | ||||
| 2025-08-15 | 13F | High Falls Advisors, Inc | 24 915 | 46,35 | 1 212 | 43,65 | ||||
| 2025-08-08 | 13F | Intrua Financial, LLC | 5 325 | 0,24 | 259 | −1,90 | ||||
| 2025-07-23 | 13F | Detalus Advisors, LLC | 42 578 | −1,01 | 2 071 | −2,82 | ||||
| 2025-07-08 | 13F | Parisi Gray Wealth Management | 11 227 | 0,00 | 546 | −1,98 | ||||
| 2025-08-07 | 13F | CENTRAL TRUST Co | 34 | 0,00 | 2 | 0,00 | ||||
| 2025-08-14 | 13F | Royal Bank Of Canada | 159 676 | −4,46 | 7 765 | −6,20 | ||||
| 2025-07-17 | 13F | Raleigh Capital Management Inc. | 54 | 1,89 | 3 | 0,00 | ||||
| 2025-07-15 | 13F | FLP Wealth Management, LLC | 6 261 | 310 | ||||||
| 2025-07-25 | 13F | Atria Wealth Solutions, Inc. | 20 081 | −49,62 | 977 | −50,56 | ||||
| 2025-08-14 | 13F | TCG Advisory Services, LLC | 89 895 | 0,00 | 4 372 | −1,82 | ||||
| 2025-07-11 | 13F | My Legacy Advisors, LLC | 9 473 | −9,15 | 456 | −11,63 | ||||
| 2025-08-01 | 13F | Gwn Securities Inc. | 0 | −100,00 | 0 | |||||
| 2025-07-31 | 13F | Cambridge Investment Research Advisors, Inc. | 33 006 | 19,10 | 2 | 0,00 | ||||
| 2025-08-06 | 13F | Golden State Wealth Management, LLC | 483 | 49,54 | 23 | 53,33 | ||||
| 2025-04-10 | 13F | Contravisory Investment Management, Inc. | 0 | 0 | ||||||
| 2025-07-17 | 13F | Leverty Financial Group, LLC | 10 674 | 519 | ||||||
| 2025-08-08 | 13F | Kingsview Wealth Management, LLC | 26 345 | −19,08 | 1 281 | −20,53 | ||||
| 2025-07-18 | 13F | Foundry Financial Group, Inc. | 7 921 | 11,45 | 385 | 9,38 | ||||
| 2025-08-12 | 13F | BlackRock, Inc. | 2 427 365 | −2,19 | 118 043 | −3,97 | ||||
| 2025-08-06 | 13F | Vestmark Advisory Solutions, Inc. | 104 484 | 63,88 | 5 081 | 60,94 | ||||
| 2025-08-11 | 13F | HighTower Advisors, LLC | 12 452 | −63,86 | 606 | −64,54 | ||||
| 2025-07-28 | 13F | Private Wealth Asset Management, LLC | 7 | 0 | ||||||
| 2025-07-28 | 13F | Fairman Group, LLC | 57 727 | 1,08 | 2 807 | |||||
| 2025-08-04 | 13F | IFG Advisory, LLC | 10 412 | 13,68 | 506 | 11,70 | ||||
| 2025-07-09 | 13F | GSG Advisors LLC | 9 099 | 0,00 | 442 | 4,74 | ||||
| 2025-08-01 | 13F | May Hill Capital, LLC | 7 300 | 355 | ||||||
| 2025-08-14 | 13F | Colony Group, LLC | 5 651 | 275 | ||||||
| 2025-08-08 | 13F | Compass Financial Services Inc | 7 396 | 0,34 | 360 | −1,64 | ||||
| 2025-08-14 | 13F/A | Rockefeller Capital Management L.P. | 186 639 | 3,07 | 9 076 | 1,20 | ||||
| 2025-08-13 | 13F | Continuum Advisory, LLC | 0 | −100,00 | 0 | |||||
| 2025-07-15 | 13F | Carr Financial Group Corp | 23 017 | −38,86 | 1 119 | −39,97 | ||||
| 2025-08-06 | 13F | Savant Capital, LLC | 8 299 | 404 | ||||||
| 2025-08-12 | 13F | Change Path, LLC | 19 017 | 925 | ||||||
| 2025-07-09 | 13F | Lineweaver Wealth Advisors, LLC | 10 205 | 11,76 | 496 | 9,73 | ||||
| 2025-08-14 | 13F | IHT Wealth Management, LLC | 20 493 | −21,73 | 997 | −23,15 | ||||
| 2025-07-24 | 13F | McKinley Carter Wealth Services, Inc. | 13 547 | 9,14 | 659 | 7,17 | ||||
| 2025-08-14 | 13F | UBS Group AG | 361 330 | −31,54 | 17 571 | −32,78 | ||||
| 2025-07-16 | 13F | Essex Financial Services, Inc. | 19 710 | 0,00 | 958 | −1,84 | ||||
| 2025-07-14 | 13F | AdvisorNet Financial, Inc | 211 | 10 | ||||||
| 2025-07-25 | 13F | Apollon Wealth Management, LLC | 52 067 | 2 532 | ||||||
| 2025-07-10 | 13F | Atticus Wealth Management, Llc | 12 | 0,00 | 1 | |||||
| 2025-08-08 | 13F | Wealth Alliance | 14 489 | −5,99 | 705 | −7,73 | ||||
| 2025-08-14 | 13F | Icon Wealth Advisors, LLC | 122 796 | −7,15 | 5 972 | −8,84 | ||||
| 2025-08-14 | 13F | Ameriprise Financial Inc | 212 085 | −56,79 | 10 314 | −57,58 | ||||
| 2025-08-07 | 13F | Vise Technologies, Inc. | 6 908 | 336 | ||||||
| 2025-08-14 | 13F | Integrated Wealth Concepts LLC | 290 296 | 43,05 | 14 117 | 40,45 | ||||
| 2025-09-04 | 13F/A | Advisor Group Holdings, Inc. | 100 809 | −44,22 | 4 903 | −45,22 | ||||
| 2025-08-06 | 13F | AE Wealth Management LLC | 24 964 | 38,87 | 1 214 | 36,29 | ||||
| 2025-08-13 | 13F | Twin Peaks Wealth Advisors, LLC | 16 | 1 | ||||||
| 2025-08-13 | 13F | Townsquare Capital Llc | 0 | −100,00 | 0 | |||||
| 2025-08-05 | 13F | C2P Capital Advisory Group, LLC d.b.a. Prosperity Capital Advisors | 0 | −100,00 | 0 | |||||
| 2025-08-14 | 13F | Bank Of America Corp /de/ | 1 912 072 | 12,35 | 92 984 | 10,31 | ||||
| 2025-08-11 | 13F | Hopwood Financial Services, Inc. | 0 | −100,00 | 0 | |||||
| 2025-08-13 | 13F | Jones Financial Companies Lllp | 1 547 678 | 48,31 | 74 981 | 45,42 | ||||
| 2025-08-06 | 13F | Commonwealth Equity Services, Llc | 511 887 | 1,08 | 25 | −4,00 | ||||
| 2025-08-15 | 13F | Morgan Stanley | 983 310 | 38,15 | 47 818 | 35,64 | ||||
| 2025-07-14 | 13F | Buttonwood Financial Group, LLC | 51 337 | 2 481 | ||||||
| 2025-07-11 | 13F | Sprinkle Financial Consultants LLC | 6 259 | 51,48 | 304 | 49,02 | ||||
| 2025-08-13 | 13F | M&t Bank Corp | 5 564 | 0,00 | 271 | −1,82 | ||||
| 2025-07-17 | 13F | Catalytic Wealth RIA, LLC | 52 135 | −2,66 | 2 535 | −4,41 | ||||
| 2025-08-11 | 13F | Theory Financial Llc | 0 | −100,00 | 0 | |||||
| 2025-07-28 | 13F | Harbour Investments, Inc. | 51 | 96,15 | 2 | 100,00 | ||||
| 2025-08-05 | 13F | Tsfg, Llc | 2 078 | 5,43 | 0 | |||||
| 2025-08-14 | 13F | Atomi Financial Group, Inc. | 4 275 | 208 | ||||||
| 2025-08-07 | 13F | Cahill Financial Advisors Inc | 12 405 | 86,18 | 603 | 82,73 | ||||
| 2025-08-12 | 13F | O'shaughnessy Asset Management, Llc | 13 | 1 200,00 | 1 | |||||
| 2025-07-31 | 13F | TSA Wealth Managment LLC | 7 755 | 0,65 | 377 | −1,05 | ||||
| 2025-08-12 | 13F | Global Retirement Partners, LLC | 4 350 | 212 | ||||||
| 2025-08-08 | 13F | Creative Planning | 5 483 | 2,05 | 267 | 0,00 | ||||
| 2025-08-14 | 13F | Fmr Llc | 853 | −32,78 | 41 | −33,87 | ||||
| 2025-08-13 | 13F | Cerity Partners LLC | 109 979 | 5 348 | ||||||
| 2025-07-30 | 13F | Cullen/frost Bankers, Inc. | 0 | −100,00 | 0 | |||||
| 2025-07-21 | 13F | Ascent Group, LLC | 78 158 | −0,74 | 3 801 | −2,56 | ||||
| 2025-08-11 | 13F | Cornerstone Planning Group LLC | 138 | −25,41 | 7 | −25,00 | ||||
| 2025-08-13 | 13F | EverSource Wealth Advisors, LLC | 24 | −78,76 | 1 | −80,00 | ||||
| 2025-08-13 | 13F | Mount Yale Investment Advisors, LLC | 1 322 | 64 | ||||||
| 2025-08-14 | 13F | Comerica Bank | 10 554 | 491,92 | 513 | 482,95 | ||||
| 2025-05-07 | 13F | Spectrum Wealth Counsel, LLC | 3 056 | 151 | ||||||
| 2025-08-13 | 13F | Flow Traders U.s. Llc | 15 141 | 1 | ||||||
| 2025-07-21 | 13F | Cliftonlarsonallen Wealth Advisors, Llc | 17 145 | 0,00 | 834 | −1,88 | ||||
| 2025-08-13 | 13F | Natixis Advisors, L.p. | 220 632 | −54,09 | 11 | −56,52 | ||||
| 2025-08-04 | 13F | Assetmark, Inc | 11 244 | 40,30 | 547 | 37,88 | ||||
| 2025-07-11 | 13F | Farther Finance Advisors, LLC | 6 470 | 315 | ||||||
| 2025-08-14 | 13F | Smartleaf Asset Management LLC | 8 154 | 1 135,45 | 395 | 1 131,25 | ||||
| 2025-08-11 | 13F | CFS Investment Advisory Services, LLC | 57 578 | 1,86 | 3 | 0,00 | ||||
| 2025-07-17 | 13F | Vermillion Wealth Management, Inc. | 1 227 | 60 | ||||||
| 2025-07-31 | 13F | AlTi Global, Inc. | 8 481 | −45,82 | 412 | −46,84 | ||||
| 2025-07-31 | 13F | Fedenia Advisers LLC | 9 886 | −2,42 | 481 | −4,19 | ||||
| 2025-08-01 | 13F | Envestnet Asset Management Inc | 3 045 343 | 8,70 | 148 095 | 6,72 | ||||
| 2025-08-06 | 13F | First Horizon Advisors, Inc. | 43 208 | −5,55 | 2 101 | −7,24 | ||||
| 2025-07-18 | 13F | Provident Wealth Management, LLC | 19 941 | 970 | ||||||
| 2025-07-25 | 13F | ONE Advisory Partners, LLC | 12 137 | 570 | ||||||
| 2025-08-07 | 13F | PFG Advisors | 8 667 | 2,87 | 421 | 0,96 | ||||
| 2025-08-06 | 13F | Stone House Investment Management, LLC | 15 096 | 2,28 | 734 | 0,41 | ||||
| 2025-08-14 | 13F | GWM Advisors LLC | 72 015 | 22,69 | 3 502 | 20,47 | ||||
| 2025-08-12 | 13F | Jpmorgan Chase & Co | 1 906 785 | 37,87 | 92 727 | 35,36 | ||||
| 2025-07-22 | 13F | Wealthcare Advisory Partners LLC | 9 380 | 456 | ||||||
| 2025-08-14 | 13F | Wells Fargo & Company/mn | 801 158 | −16,35 | 38 960 | −17,87 | ||||
| 2025-07-17 | 13F | Kelly Financial Services LLC | 23 457 | −19,19 | 1 141 | −20,67 | ||||
| 2025-07-23 | 13F | Tyche Wealth Partners LLC | 13 369 | 650 | ||||||
| 2025-08-08 | 13F | KM Capital Management Ltd. | 66 454 | −8,51 | 3 232 | −10,18 | ||||
| 2025-08-13 | 13F | Capital Analysts, Inc. | 438 | 0,00 | 0 | |||||
| 2025-07-21 | 13F | Triad Wealth Partners, LLC | 8 000 | 389 | ||||||
| 2025-07-22 | 13F | Aspire Private Capital, LLC | 4 235 | 0,62 | 206 | −1,44 | ||||
| 2025-08-12 | 13F | YANKCOM Partnership | 2 648 | 2,56 | 129 | 0,79 | ||||
| 2025-08-08 | 13F | Good Life Advisors, LLC | 5 039 | −18,90 | 245 | −20,20 | ||||
| 2025-07-15 | 13F | Northside Capital Management, LLC | 6 266 | 305 | ||||||
| 2025-08-13 | 13F | Rsm Us Wealth Management Llc | 30 872 | −3,78 | 1 501 | −5,54 | ||||
| 2025-07-30 | 13F | LGT Financial Advisors LLC | 1 320 | 0,46 | 64 | −1,54 | ||||
| 2025-07-18 | 13F | SOA Wealth Advisors, LLC. | 15 981 | 777 | ||||||
| 2025-08-08 | 13F | Pnc Financial Services Group, Inc. | 13 | 1 | ||||||
| 2025-08-06 | 13F | Ethos Financial Group, LLC | 4 937 | 240 | ||||||
| 2025-08-08 | 13F | Larson Financial Group LLC | 0 | −100,00 | 0 | |||||
| 2025-07-16 | 13F | Perigon Wealth Management, LLC | 35 201 | 12,24 | 1 712 | 10,17 | ||||
| 2025-08-15 | 13F | Kestra Advisory Services, LLC | 38 187 | −8,77 | 1 857 | −10,42 | ||||
| 2025-08-07 | 13F | Allworth Financial LP | 49 | −81,51 | 2 | −83,33 | ||||
| 2025-08-14 | 13F | Susquehanna International Group, Llp | 12 110 | 589 | ||||||
| 2025-08-14 | 13F | Garden State Investment Advisory Services LLC | 16 900 | −15,93 | 822 | −17,47 | ||||
| 2025-08-05 | 13F | Claro Advisors LLC | 6 282 | 51,67 | 306 | 48,78 | ||||
| 2025-08-13 | 13F | Northwestern Mutual Wealth Management Co | 303 952 | 12,34 | 14 781 | 10,30 | ||||
| 2025-08-11 | 13F | CBIZ Investment Advisory Services, LLC | 0 | −100,00 | 0 | −100,00 | ||||
| 2025-05-02 | 13F | Capital A Wealth Management, LLC | 1 014 | 50 | ||||||
| 2025-07-31 | 13F | Oppenheimer & Co Inc | 21 613 | −41,10 | 1 051 | −42,16 | ||||
| 2025-08-11 | 13F | Sofi Wealth, Llc | 167 322 | 8 137 | ||||||
| 2025-07-28 | 13F | Rosenberg Matthew Hamilton | 1 998 | 450,41 | 97 | 470,59 | ||||
| 2025-07-30 | 13F | Strategic Blueprint, LLC | 24 259 | 3,81 | 1 180 | 1,90 | ||||
| 2025-08-06 | 13F | Wedbush Securities Inc | 4 994 | 23,16 | 0 | |||||
| 2025-08-14 | 13F | Stifel Financial Corp | 75 431 | 8,85 | 3 668 | 6,88 | ||||
| 2025-07-07 | 13F | Retirement Wealth Solutions LLC | 7 927 | 0,06 | 385 | −1,79 | ||||
| 2025-07-08 | 13F | Ehrlich Financial Group | 10 048 | 489 | ||||||
| 2025-07-10 | 13F | Oliver Lagore Vanvalin Investment Group | 135 | 7 | ||||||
| 2025-07-28 | 13F | Axxcess Wealth Management, Llc | 0 | −100,00 | 0 | |||||
| 2025-07-18 | 13F | Truist Financial Corp | 101 005 | 9,16 | 4 912 | 7,16 | ||||
| 2025-08-01 | 13F | Transcend Wealth Collective, Llc | 0 | −100,00 | 0 | |||||
| 2025-08-05 | 13F | Sigma Planning Corp | 6 680 | 0,72 | 325 | −1,22 | ||||
| 2025-08-14 | 13F | Raymond James Financial Inc | 382 091 | 147,68 | 18 581 | 143,21 | ||||
| 2025-07-11 | 13F | LongView Wealth Management | 0 | −100,00 | 0 | |||||
| 2025-08-08 | 13F | Foundations Investment Advisors, LLC | 26 663 | 61,11 | 1 297 | 58,24 | ||||
| 2025-07-29 | 13F | Stratos Wealth Partners, LTD. | 19 251 | 936 | ||||||
| 2025-07-25 | 13F | Sequoia Financial Advisors, LLC | 33 629 | 1 635 | ||||||
| 2025-08-07 | 13F | Verus Capital Partners, Llc | 4 296 | −14,10 | 209 | −15,79 | ||||
| 2025-08-07 | 13F | Americana Partners, LLC | 0 | −100,00 | 0 | |||||
| 2025-08-12 | 13F | Integrated Advisors Network LLC | 32 127 | 2,33 | 1 562 | 0,45 | ||||
| 2025-08-19 | 13F | Cape Investment Advisory, Inc. | 249 | 24,50 | 12 | 33,33 | ||||
| 2025-07-15 | 13F | Regatta Capital Group, Llc | 0 | −100,00 | 0 | |||||
| 2025-07-10 | 13F | Sovran Advisors, LLC | 5 722 | 275 | ||||||
| 2025-08-05 | 13F | Atlas Private Wealth Advisors | 76 595 | −18,21 | 3 725 | −19,71 | ||||
| 2025-08-07 | 13F | Apeiron RIA LLC | 6 096 | 296 | ||||||
| 2025-08-08 | 13F | Emerald Investment Partners, Llc | 11 841 | 1,79 | 576 | −0,17 | ||||
| 2025-08-12 | 13F | Steward Partners Investment Advisory, Llc | 7 473 | 95,99 | 363 | 93,09 | ||||
| 2025-08-14 | 13F | Hancock Whitney Corp | 176 981 | 1,29 | 8 607 | −0,55 | ||||
| 2025-08-07 | 13F | Resources Investment Advisors, LLC. | 7 978 | −0,21 | 388 | −2,27 | ||||
| 2025-07-14 | 13F | Cherrydale Wealth Management, Llc | 30 184 | 1 468 | ||||||
| 2025-07-24 | 13F | IFP Advisors, Inc | 22 290 | 6,68 | 1 084 | 4,74 | ||||
| 2025-07-29 | 13F | Private Trust Co Na | 1 105 | 0,64 | 54 | −1,85 | ||||
| 2025-08-08 | 13F | Avantax Advisory Services, Inc. | 84 525 | −4,33 | 4 110 | −6,08 | ||||
| 2025-07-24 | 13F | JB Capital LLC | 5 517 | 268 | ||||||
| 2025-07-24 | 13F | Jfs Wealth Advisors, Llc | 1 898 | −11,18 | 92 | −12,38 | ||||
| 2025-08-14 | 13F | Benjamin Edwards Inc | 5 233 | 1,47 | 254 | −0,39 | ||||
| 2025-08-04 | 13F | Arkadios Wealth Advisors | 7 213 | 351 | ||||||
| 2025-08-04 | 13F | Atria Investments Llc | 16 625 | 39,58 | 808 | 37,18 | ||||
| 2025-08-11 | 13F | Principal Securities, Inc. | 17 929 | 872 | ||||||
| 2025-07-14 | 13F | Toth Financial Advisory Corp | 3 209 | 0,91 | 156 | −0,64 | ||||
| 2025-07-18 | 13F | QTR Family Wealth, LLC | 4 853 | −10,00 | 236 | −11,99 | ||||
| 2025-07-18 | 13F | SigFig Wealth Management, LLC | 8 104 | 4,29 | 392 | 2,35 | ||||
| 2025-08-14 | 13F | Mml Investors Services, Llc | 433 471 | 11,55 | 21 | 10,53 | ||||
| 2025-07-22 | 13F | Simplicity Wealth,LLC | 9 038 | 439 | ||||||
| 2025-07-25 | 13F | Concord Wealth Partners | 0 | −100,00 | 0 | |||||
| 2025-07-29 | 13F | Financial Synergies Wealth Advisors, Inc. | 147 842 | 8,98 | 7 190 | 7,00 | ||||
| 2025-08-08 | 13F | Cetera Investment Advisers | 286 815 | 5,91 | 13 948 | 3,98 | ||||
| 2025-08-11 | 13F | Synergy Investment Management, LLC | 0 | −100,00 | 0 | |||||
| 2025-07-29 | 13F | Empirical Asset Management, LLC | 9 557 | 0,00 | 465 | −1,90 | ||||
| 2025-08-11 | 13F | Perennial Investment Advisors, LLC | 31 177 | 37,42 | 1 516 | 35,00 | ||||
| 2025-08-14 | 13F | Lebenthal Global Advisors, LLC | 15 117 | −8,70 | 735 | −10,37 | ||||
| 2025-08-01 | 13F | Ashton Thomas Private Wealth, LLC | 18 140 | 29,47 | 882 | 27,27 | ||||
| 2025-08-27 | 13F/A | Brinker Capital Investments, LLC | 71 750 | 3 489 | ||||||
| 2025-08-08 | 13F | Thoroughbred Financial Services, Llc | 10 333 | 0,00 | 1 | |||||
| 2025-07-17 | 13F | One Wealth Advisors, LLC | 55 620 | −20,81 | 2 705 | −22,25 | ||||
| 2025-08-04 | 13F | Mayflower Financial Advisors, LLC | 10 164 | 8,99 | 494 | 7,16 | ||||
| 2025-07-15 | 13F | Signet Financial Management, Llc | 9 323 | 1,22 | 453 | −0,66 | ||||
| 2025-07-25 | 13F | Envestnet Portfolio Solutions, Inc. | 192 119 | −3,82 | 9 343 | −5,57 | ||||
| 2025-08-01 | 13F | Liberty Wealth Management Llc | 8 708 | 22,42 | 423 | 20,17 | ||||
| 2025-08-12 | 13F | Proequities, Inc. | 0 | 0 | ||||||
| 2025-08-13 | 13F | Shepherd Financial Partners LLC | 44 209 | 62,38 | 2 150 | 59,42 | ||||
| 2025-08-05 | 13F | Bank of New York Mellon Corp | 25 160 | 7,89 | 1 224 | 5,89 | ||||
| 2025-07-07 | 13F | Thurston, Springer, Miller, Herd & Titak, Inc. | 1 696 | 0,00 | 82 | −2,38 | ||||
| 2025-08-05 | 13F | BCGM Wealth Management, LLC | 11 401 | 31,73 | 554 | 29,44 | ||||
| 2025-07-22 | 13F | Team Financial Group, LLC | 509 | 25 | ||||||
| 2025-08-14 | 13F | Wiley Bros.-aintree Capital, Llc | 36 971 | 167,15 | 1 797 | 163,10 | ||||
| 2025-08-13 | 13F | West Wealth Group, LLC | 26 562 | 22,46 | 1 268 | 18,19 | ||||
| 2025-08-11 | 13F | Private Advisor Group, LLC | 44 967 | 43,77 | 2 187 | 41,12 | ||||
| 2025-08-14 | 13F | Citadel Advisors Llc | 14 871 | 723 | ||||||
| 2025-08-06 | 13F | One Wealth Capital Management, Llc | 16 559 | 0,72 | 805 | −1,11 | ||||
| 2025-08-13 | 13F | Keystone Financial Group | 27 344 | 4,45 | 1 330 | 2,55 |