Grundläggande statistik
| Institutionella ägare | 132 total, 132 long only, 0 short only, 0 long/short - change of 3,12% MRQ |
| Genomsnittlig portföljallokering | 0.2270 % - change of −3,28% MRQ |
| Institutionella aktier (lång) | 8 716 184 (ex 13D/G) - change of 0,27MM shares 3,24% MRQ |
| Institutionellt värde (lång) | $ 497 114 USD ($1000) |
Institutionellt ägande och aktieägare
Fidelity Covington Trust - Fidelity Value Factor ETF (US:FVAL) har 132 Institutionella ägare och aktieägare som har lämnat in 13D/G- eller 13F-formulär till Securities Exchange Commission (SEC). Dessa institut innehar totalt 8,716,184 aktier. Största aktieägare inkluderar Fmr Llc, Envestnet Asset Management Inc, Commonwealth Equity Services, Llc, High Probability Advisors, LLC, Royal Bank Of Canada, Custos Family Office, LLC, LPL Financial LLC, Advisor Group Holdings, Inc., Jpmorgan Chase & Co, and Kestra Advisory Services, LLC .
Fidelity Covington Trust - Fidelity Value Factor ETF (ARCA:FVAL) Institutionell ägarstruktur visar institutioners och fonders nuvarande positioner i företaget, samt de senaste förändringarna i positionernas storlek. Större aktieägare kan vara enskilda investerare, fonder, hedgefonder eller institutioner. Bilaga 13D visar att investeraren äger (eller ägde) mer än 5% av företaget och avser (eller avsåg) att aktivt eftersträva en förändring av affärsstrategin. Schedule 13G indikerar en passiv investering på över 5%.
The share price as of September 5, 2025 is 67,54 / share. Previously, on September 9, 2024, the share price was 57,72 / share. This represents an increase of 17,01% over that period.

Fondsentimentets poäng
Fondsentimentet poängen(fka Ägarackumulation-poäng) visar vilka aktier som är mest köpta av fonder. Det är resultatet av en sofistikerad kvantitativ flerfaktormodell som identifierar företag med de högsta nivåerna av institutionell ackumulering. Poängsättningsmodellen använder en kombination av den totala ökningen av redovisade ägare, förändringarna i portföljallokeringarna för dessa ägare och andra mått. Siffran sträcker sig från 0 till 100, där högre siffror indikerar en högre nivå av ackumulering i förhållande till sina konkurrenter, och 50 är genomsnittet.
Uppdateringsfrekvens: Dagligen
Se Ownership Explorer, som innehåller en lista över de högst rankade företagen.
Institutionell sälj/köp-kvot
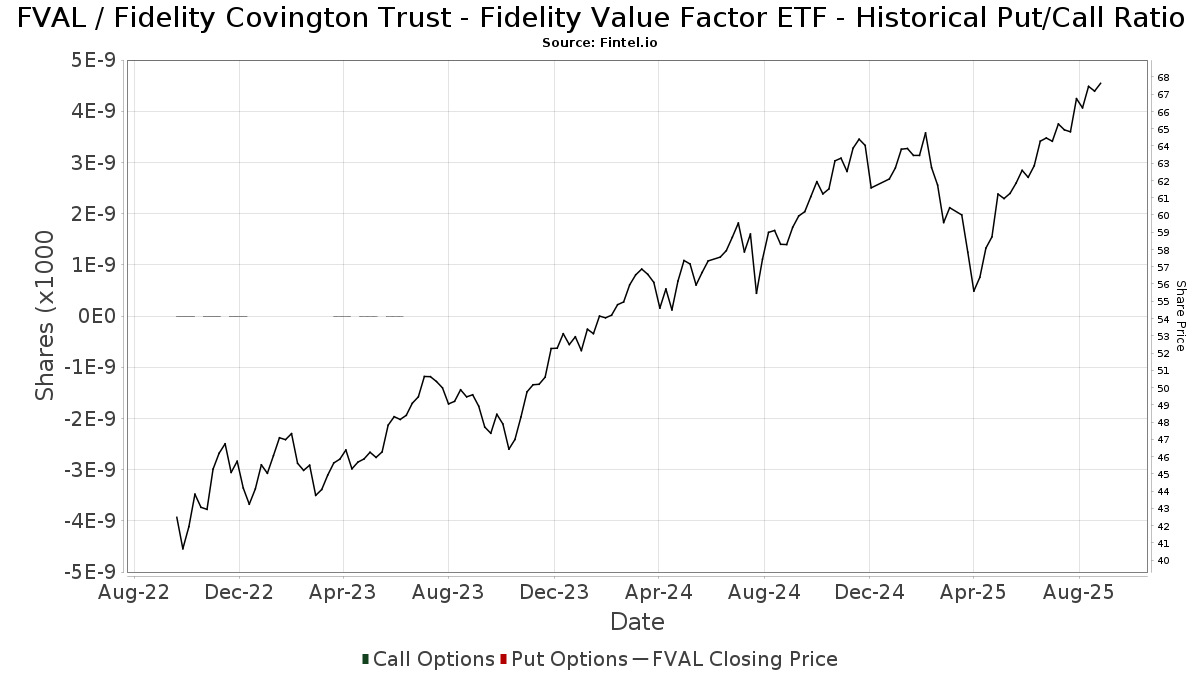
Förutom att rapportera vanliga eget kapital- och skuldemissioner måste institutioner med mer än 100MM tillgångar under förvaltning också avslöja sina innehav av sälj- och köpoptioner. Eftersom säljoptioner i allmänhet indikerar ett negativt sentiment och köpoptioner indikerar ett positivt sentiment, kan vi få en uppfattning om det övergripande institutionella sentimentet genom att plotta förhållandet mellan säljoptioner och köpoptioner. Diagrammet till höger visar det historiska förhållandet mellan sälj- och köpoptioner för detta instrument.
Genom att använda sälj/köp-kvoten som en indikator på aktieägarnas sentiment undviker man en av de största bristerna med att använda det totala institutionella ägandet, nämligen att en betydande del av de förvaltade tillgångarna investeras passivt för att följa index. Passivt förvaltade fonder köper vanligtvis inte optioner, så indikatorn för sälj/köp-kvoten ger en bättre bild av stämningen i aktivt förvaltade fonder.
13F- och NPORT-arkiveringar
Detaljer om 13F-arkiveringar är gratis. Detaljer om NP-arkiveringar kräver ett premiummedlemskap. Gröna rader indikerar nya positioner. Röda rader indikerar stängda positioner. Klicka på länk symbolen för att se hela transaktionshistoriken.
Uppgradera
för att låsa upp premiumdata och exportera till Excel ![]() .
.
| Fil Datum | Källa | Investerare | Typ | Genomsnittligt pris (beräknat) |
Aktier | Δ Aktier (%) |
Rapporterat värde (1000 USD) |
Δ Värde (%) |
Portföljallokering (%) |
|
|---|---|---|---|---|---|---|---|---|---|---|
| 2025-08-15 | 13F | Kestra Advisory Services, LLC | 178 389 | 19,57 | 11 394 | 28,16 | ||||
| 2025-07-29 | NP | EBI - Longview Advantage ETF | 0 | −100,00 | 0 | −100,00 | ||||
| 2025-08-14 | 13F | Federation des caisses Desjardins du Quebec | 80 | 0,00 | 5 | 25,00 | ||||
| 2025-09-04 | 13F/A | Advisor Group Holdings, Inc. | 246 102 | −0,87 | 15 722 | 6,24 | ||||
| 2025-07-21 | 13F | Ameriflex Group, Inc. | 0 | −100,00 | 0 | |||||
| 2025-08-15 | 13F | Morgan Stanley | 121 470 | −3,90 | 7 758 | 3,00 | ||||
| 2025-05-12 | 13F | Americana Partners, LLC | 0 | −100,00 | 0 | |||||
| 2025-08-26 | 13F/A | Thrivent Financial For Lutherans | 26 970 | −95,28 | 2 | −97,22 | ||||
| 2025-04-21 | 13F | PSI Advisors, LLC | 0 | −100,00 | 0 | |||||
| 2025-08-14 | 13F | Certified Advisory Corp | 5 461 | 0,39 | 349 | 7,41 | ||||
| 2025-08-13 | 13F | Twin Peaks Wealth Advisors, LLC | 982 | 65 | ||||||
| 2025-07-11 | 13F | Bouvel Investment Partners, LLC | 45 304 | −9,63 | 2 894 | −4,74 | ||||
| 2025-07-25 | 13F | Atria Wealth Solutions, Inc. | 27 598 | −8,55 | 1 766 | −1,78 | ||||
| 2025-07-08 | 13F | Zrc Wealth Management, Llc | 18 | 0,00 | 1 | 0,00 | ||||
| 2025-08-08 | 13F | Thoroughbred Financial Services, Llc | 4 933 | −62,14 | 0 | |||||
| 2025-04-11 | 13F | Unique Wealth, Llc | 0 | −100,00 | 0 | |||||
| 2025-07-24 | 13F | Blair William & Co/il | 200 | 0,00 | 13 | 9,09 | ||||
| 2025-08-14 | 13F | Mml Investors Services, Llc | 12 236 | 50,23 | 1 | |||||
| 2025-07-08 | 13F | Prism Advisors, Inc. | 81 530 | 0,00 | 5 207 | 7,18 | ||||
| 2025-08-18 | 13F/A | Kestra Investment Management, LLC | 3 497 | 223 | ||||||
| 2025-08-04 | 13F | Kovack Advisors, Inc. | 5 592 | 1,10 | 357 | 8,51 | ||||
| 2025-08-14 | 13F | Stifel Financial Corp | 3 486 | −1,33 | 223 | 5,71 | ||||
| 2025-08-14 | 13F | Clarity Asset Management, Inc. | 2 129 | −6,95 | 136 | −0,74 | ||||
| 2025-07-28 | 13F | Axxcess Wealth Management, Llc | 0 | −100,00 | 0 | |||||
| 2025-07-17 | 13F | Montis Financial, LLC | 13 560 | −3,74 | 866 | 3,22 | ||||
| 2025-04-21 | 13F | PUREfi Wealth, LLC | 0 | −100,00 | 0 | |||||
| 2025-08-06 | 13F | Hoxton Planning & Management, LLC | 8 830 | 0,00 | 564 | 7,03 | ||||
| 2025-08-13 | 13F | Flow Traders U.s. Llc | 0 | −100,00 | 0 | |||||
| 2025-08-14 | 13F | Sunbelt Securities, Inc. | 8 590 | −31,87 | 529 | −29,69 | ||||
| 2025-08-07 | 13F | Kestra Private Wealth Services, Llc | 104 980 | 3,02 | 6 705 | 10,42 | ||||
| 2025-07-15 | 13F | Avaii Wealth Management, Llc | 4 527 | −0,98 | 289 | 6,25 | ||||
| 2025-07-21 | 13F | Ameritas Advisory Services, LLC | 3 496 | −62,93 | 223 | −61,28 | ||||
| 2025-07-30 | 13F | Cullen/frost Bankers, Inc. | 7 669 | 17,86 | 490 | 26,36 | ||||
| 2025-08-27 | 13F/A | Brinker Capital Investments, LLC | 31 823 | 22,00 | 2 033 | 30,76 | ||||
| 2025-08-01 | 13F | Envestnet Asset Management Inc | 1 398 051 | 7,23 | 89 293 | 14,93 | ||||
| 2025-08-04 | 13F | Spire Wealth Management | 42 | 0,00 | 3 | 0,00 | ||||
| 2025-08-12 | 13F | Atlas Capital Advisors Llc | 264 | 0,00 | 17 | 6,67 | ||||
| 2025-08-14 | 13F | Susquehanna International Group, Llp | 49 535 | 115,02 | 3 164 | 130,54 | ||||
| 2025-08-14 | 13F | Fmr Llc | 1 712 580 | 78,90 | 109 382 | 91,75 | ||||
| 2025-08-08 | 13F | CFO4Life Group, LLC | 4 118 | −3,51 | 263 | 3,54 | ||||
| 2025-08-14 | 13F | Quantinno Capital Management LP | 5 324 | 340 | ||||||
| 2025-07-30 | 13F | Strategic Blueprint, LLC | 14 467 | 924 | ||||||
| 2025-08-19 | 13F | National Asset Management, Inc. | 17 973 | 1 148 | ||||||
| 2025-08-12 | 13F | MAI Capital Management | 150 335 | 0,13 | 9 602 | 7,31 | ||||
| 2025-08-13 | 13F | Vermillion & White Wealth Management Group, LLC | 78 | 0,00 | 5 | 0,00 | ||||
| 2025-08-14 | 13F | Bank Of America Corp /de/ | 140 932 | 7,93 | 9 001 | 15,68 | ||||
| 2025-08-06 | 13F | AE Wealth Management LLC | 22 959 | −76,01 | 1 466 | −74,29 | ||||
| 2025-04-14 | 13F | Patriot Financial Group Insurance Agency, LLC | 0 | −100,00 | 0 | −100,00 | ||||
| 2025-08-12 | 13F | J.w. Cole Advisors, Inc. | 13 969 | 2,96 | 892 | 10,40 | ||||
| 2025-08-11 | 13F | Private Advisor Group, LLC | 8 104 | 10,95 | 518 | 18,85 | ||||
| 2025-07-18 | 13F | Childress Capital Advisors, Llc | 0 | −100,00 | 0 | −100,00 | ||||
| 2025-07-23 | 13F | Sax Wealth Advisors, Llc | 64 778 | 9,42 | 4 137 | 17,30 | ||||
| 2025-08-05 | 13F | Sigma Planning Corp | 23 822 | −0,51 | 1 522 | 6,66 | ||||
| 2025-08-12 | 13F | Global Retirement Partners, LLC | 5 645 | 0,18 | 361 | 4,05 | ||||
| 2025-08-07 | 13F | BOK Financial Private Wealth, Inc. | 72 | 5 | ||||||
| 2025-07-11 | 13F | Farther Finance Advisors, LLC | 4 152 | 4 672,41 | 265 | 5 200,00 | ||||
| 2025-08-18 | 13F | Geneos Wealth Management Inc. | 223 | 0,00 | 14 | 7,69 | ||||
| 2025-05-15 | 13F/A | Orion Portfolio Solutions, LLC | 26 085 | −5,62 | 1 554 | −8,59 | ||||
| 2025-08-14 | 13F/A | Rockefeller Capital Management L.P. | 26 785 | 6,47 | 1 711 | 14,08 | ||||
| 2025-08-14 | 13F | Goodwin Investment Advisory | 78 879 | 21,00 | 5 038 | 29,71 | ||||
| 2025-07-14 | 13F | AdvisorNet Financial, Inc | 1 242 | 0,32 | 79 | 8,22 | ||||
| 2025-04-30 | 13F | Quotient Wealth Partners, LLC | 0 | −100,00 | 0 | |||||
| 2025-07-15 | 13F | Colonial River Wealth Management, LLC | 0 | −100,00 | 0 | |||||
| 2025-08-04 | 13F | Assetmark, Inc | 3 652 | 2,56 | 233 | 9,91 | ||||
| 2025-08-14 | 13F | Integrated Wealth Concepts LLC | 3 242 | −30,37 | 207 | −25,27 | ||||
| 2025-08-13 | 13F | Transce3nd, LLC | 29 | 0,00 | 2 | 0,00 | ||||
| 2025-08-14 | 13F | Glen Eagle Advisors, LLC | 2 850 | 0,00 | 182 | 7,69 | ||||
| 2025-07-22 | 13F | Foguth Wealth Management, LLC. | 4 211 | −12,76 | 269 | −6,62 | ||||
| 2025-07-17 | 13F | Prepared Retirement Institute LLC | 5 927 | 0,36 | 379 | 7,69 | ||||
| 2025-07-29 | 13F | Spectrum Investment Advisors, Inc. | 15 089 | 5,96 | 964 | 13,56 | ||||
| 2025-07-10 | 13F | Wealth Enhancement Advisory Services, Llc | 10 375 | −6,91 | 672 | 1,05 | ||||
| 2025-07-16 | 13F | Signaturefd, Llc | 0 | −100,00 | 0 | |||||
| 2025-08-12 | 13F | Jpmorgan Chase & Co | 208 079 | 7,44 | 13 290 | 15,16 | ||||
| 2025-08-08 | 13F | Foundations Investment Advisors, LLC | 15 056 | 13,88 | 962 | 22,11 | ||||
| 2025-08-14 | 13F | GWM Advisors LLC | 7 775 | 6,89 | 497 | 14,55 | ||||
| 2025-07-30 | 13F | Principle Wealth Partners Llc | 6 167 | 0,00 | 394 | 7,08 | ||||
| 2025-08-01 | 13F | Gwn Securities Inc. | 9 057 | −12,34 | 579 | −6,02 | ||||
| 2025-08-14 | 13F | Qube Research & Technologies Ltd | 0 | −100,00 | 0 | |||||
| 2025-07-24 | 13F | Cyndeo Wealth Partners, LLC | 5 320 | 0,08 | 340 | 7,28 | ||||
| 2025-05-13 | 13F | Steward Partners Investment Advisory, Llc | 0 | −100,00 | 0 | |||||
| 2025-07-28 | 13F | Mowery & Schoenfeld Wealth Management, LLC | 0 | −100,00 | 0 | |||||
| 2025-08-14 | 13F | Jane Street Group, Llc | 9 283 | 593 | ||||||
| 2025-05-20 | 13F/A | Colony Group, LLC | 0 | −100,00 | 0 | |||||
| 2025-08-06 | 13F | Forbes Financial Planning, Inc. | 84 443 | −24,77 | 5 393 | −19,36 | ||||
| 2025-08-14 | 13F | Royal Bank Of Canada | 357 889 | 116,85 | 22 859 | 132,43 | ||||
| 2025-07-21 | 13F | Ascent Group, LLC | 5 183 | 2,37 | 331 | 9,97 | ||||
| 2025-07-31 | 13F | Cambridge Investment Research Advisors, Inc. | 43 647 | 26,14 | 3 | 0,00 | ||||
| 2025-08-14 | 13F | Atomi Financial Group, Inc. | 0 | −100,00 | 0 | |||||
| 2025-08-14 | 13F | Raymond James Financial Inc | 32 636 | 18,43 | 2 084 | 26,92 | ||||
| 2025-08-06 | 13F | Vantage Financial Partners, LLC | 146 131 | 0,04 | 9 333 | 7,23 | ||||
| 2025-07-15 | 13F | LVZ Advisors, Inc. | 28 311 | 1 808 | ||||||
| 2025-08-07 | 13F | New England Private Wealth Advisors LLC | 3 315 | 215 | ||||||
| 2025-08-14 | 13F | Mariner, LLC | 3 647 | −6,34 | 233 | 0,00 | ||||
| 2025-08-19 | 13F | Advisory Services Network, LLC | 4 284 | −2,86 | 277 | 5,34 | ||||
| 2025-08-08 | 13F | Cetera Investment Advisers | 177 883 | 7,89 | 11 361 | 15,63 | ||||
| 2025-08-01 | 13F | Cedar Point Capital Partners, LLC | 56 078 | 5,93 | 3 582 | 13,54 | ||||
| 2025-07-29 | 13F | Primoris Wealth Advisors, Llc | 45 482 | 40,09 | 2 905 | 50,16 | ||||
| 2025-08-04 | 13F | Bay Colony Advisory Group, Inc d/b/a Bay Colony Advisors | 4 162 | 2,54 | 266 | 10,42 | ||||
| 2025-08-13 | 13F | Northwestern Mutual Wealth Management Co | 4 062 | −45,02 | 259 | −41,14 | ||||
| 2025-08-01 | 13F | Schmidt P J Investment Management Inc | 13 335 | 185,00 | 852 | 206,12 | ||||
| 2025-07-28 | 13F | Sagespring Wealth Partners, Llc | 4 020 | −62,38 | 257 | −59,75 | ||||
| 2025-08-14 | 13F | Foronjy Financial Llc | 3 428 | 219 | ||||||
| 2025-08-14 | 13F | Comerica Bank | 2 182 | 0,00 | 139 | 6,92 | ||||
| 2025-07-21 | 13F | Custos Family Office, LLC | 321 535 | 0,72 | 20 536 | 7,95 | ||||
| 2025-08-12 | 13F | O'shaughnessy Asset Management, Llc | 57 | −82,78 | 4 | −84,21 | ||||
| 2025-08-08 | 13F | Altfest L J & Co Inc | 39 660 | −4,02 | 2 533 | 2,88 | ||||
| 2025-08-11 | 13F | Traub Capital Management LLC | 18 915 | 1 208 | ||||||
| 2025-08-13 | 13F | Jones Financial Companies Lllp | 26 135 | 53,31 | 1 662 | 64,72 | ||||
| 2025-08-14 | 13F | Harwood Advisory Group, LLC | 16 818 | −4,33 | 1 074 | −0,65 | ||||
| 2025-08-14 | 13F | Glenmede Investment Management, LP | 253 | 16 | ||||||
| 2025-05-02 | 13F | Capital A Wealth Management, LLC | 12 | 0,00 | 1 | |||||
| 2025-07-07 | 13F | Kings Path Partners LLC | 3 | 0 | ||||||
| 2025-07-30 | 13F | Avidian Wealth Solutions, LLC | 0 | −100,00 | 0 | |||||
| 2025-07-10 | 13F | Oliver Lagore Vanvalin Investment Group | 14 | 366,67 | 1 | |||||
| 2025-08-12 | 13F | SRS Capital Advisors, Inc. | 44 | 3 | ||||||
| 2025-08-05 | 13F | Dynasty Wealth Management, Llc | 4 895 | 0,55 | 313 | 7,59 | ||||
| 2025-08-14 | 13F | Goldman Sachs Group Inc | 30 572 | 10,01 | 1 953 | 17,87 | ||||
| 2025-08-07 | 13F | Allworth Financial LP | 9 558 | 0,15 | 610 | 11,11 | ||||
| 2025-08-08 | 13F | Crossmark Global Holdings, Inc. | 8 098 | −11,21 | 517 | −4,79 | ||||
| 2025-08-08 | 13F | Capital Investment Counsel, Inc | 2 230 | 0,00 | 142 | 7,58 | ||||
| 2025-08-12 | 13F | Proequities, Inc. | 0 | 0 | ||||||
| 2025-07-22 | 13F | Inlight Wealth Management, LLC | 0 | −100,00 | 0 | |||||
| 2025-08-12 | 13F | Wood Tarver Financial Group, LLC | 4 084 | 0,00 | 0 | −100,00 | ||||
| 2025-05-15 | 13F | Marshall & Sterling Wealth Advisors Inc. | 0 | −100,00 | 0 | |||||
| 2025-08-04 | 13F | Arkadios Wealth Advisors | 3 746 | 3,05 | 239 | 10,65 | ||||
| 2025-07-25 | 13F | Cwm, Llc | 0 | −100,00 | 0 | |||||
| 2025-08-06 | 13F | Golden State Wealth Management, LLC | 28 | 0,00 | 2 | 0,00 | ||||
| 2025-08-07 | 13F | Samalin Investment Counsel, LLC | 9 090 | −18,34 | 581 | −12,52 | ||||
| 2025-08-08 | 13F | Condor Capital Management | 109 495 | 1,98 | 6 993 | 9,32 | ||||
| 2025-07-23 | 13F | Valmark Advisers, Inc. | 24 748 | 0,73 | 1 581 | 7,92 | ||||
| 2025-07-25 | 13F | Sequoia Financial Advisors, LLC | 6 062 | 2,33 | 387 | 9,63 | ||||
| 2025-07-31 | 13F | CNB Bank | 686 | 0,00 | 44 | 7,50 | ||||
| 2025-08-14 | 13F | Two Sigma Investments, Lp | 101 800 | −50,44 | 6 502 | −46,88 | ||||
| 2025-08-14 | 13F | Hrt Financial Lp | 4 210 | 0 | ||||||
| 2025-08-07 | 13F | PFG Advisors | 0 | −100,00 | 0 | |||||
| 2025-08-14 | 13F | UBS Group AG | 1 179 | 75 | ||||||
| 2025-08-14 | 13F | LaSalle St. Investment Advisors, LLC | 4 791 | −20,24 | 0 | |||||
| 2025-08-12 | 13F | Founders Financial Alliance, LLC | 759 | 15,17 | 48 | 23,08 | ||||
| 2025-07-10 | 13F | Signal Advisors Wealth, LLC | 4 211 | −10,46 | 269 | −4,29 | ||||
| 2025-07-09 | 13F | Dynamic Advisor Solutions LLC | 178 222 | 2,48 | 11 383 | 9,85 | ||||
| 2025-04-28 | 13F | Clarity Capital Partners LLC | 0 | −100,00 | 0 | |||||
| 2025-08-08 | 13F | Creative Planning | 110 004 | −2,70 | 7 026 | 4,27 | ||||
| 2025-08-13 | 13F | Russell Investments Group, Ltd. | 37 | 2 | ||||||
| 2025-08-14 | 13F | Citadel Advisors Llc | 32 237 | −25,23 | 2 059 | −19,89 | ||||
| 2025-08-06 | 13F | Commonwealth Equity Services, Llc | 830 198 | −2,73 | 53 | 6,00 | ||||
| 2025-08-12 | 13F | LPL Financial LLC | 294 469 | 15,90 | 18 808 | 24,22 | ||||
| 2025-08-14 | 13F | CoreCap Advisors, LLC | 5 352 | −1,20 | 342 | 5,90 | ||||
| 2025-05-19 | 13F | Heck Capital Advisors, LLC | 0 | 0 | ||||||
| 2025-07-09 | 13F | High Probability Advisors, LLC | 414 937 | 9,83 | 26 502 | 17,72 | ||||
| 2025-08-13 | 13F | Cerity Partners LLC | 7 853 | 0,10 | 502 | 7,28 | ||||
| 2025-07-07 | 13F | Thurston, Springer, Miller, Herd & Titak, Inc. | 245 | 0,00 | 16 | 7,14 | ||||
| 2025-08-14 | 13F | Wells Fargo & Company/mn | 23 | −93,92 | 1 | −95,45 | ||||
| 2025-08-11 | 13F | Citigroup Inc | 2 054 | 0,00 | 131 | 7,38 | ||||
| 2025-07-24 | 13F | IFP Advisors, Inc | 3 317 | 5,60 | 212 | 12,83 | ||||
| 2025-07-31 | 13F | Glass Jacobson Investment Advisors llc | 3 968 | 0,84 | 253 | 4,55 | ||||
| 2025-08-11 | 13F | Principal Securities, Inc. | 613 | −77,72 | 39 | −76,92 | ||||
| 2025-07-25 | 13F | Envestnet Portfolio Solutions, Inc. | 29 371 | 12,72 | 1 876 | 20,81 | ||||
| 2025-04-17 | 13F | Fairvoy Private Wealth, LLC | 0 | −100,00 | 0 | |||||
| 2025-08-14 | 13F | Kovitz Investment Group Partners, LLC | 3 500 | 224 | ||||||
| 2025-08-11 | 13F | NewEdge Wealth, LLC | 0 | −100,00 | 0 |