Grundläggande statistik
| Institutionella ägare | 211 total, 211 long only, 0 short only, 0 long/short - change of 5,47% MRQ |
| Genomsnittlig portföljallokering | 0.1714 % - change of −17,58% MRQ |
| Institutionella aktier (lång) | 10 731 203 (ex 13D/G) - change of −3,51MM shares −24,65% MRQ |
| Institutionellt värde (lång) | $ 519 329 USD ($1000) |
Institutionellt ägande och aktieägare
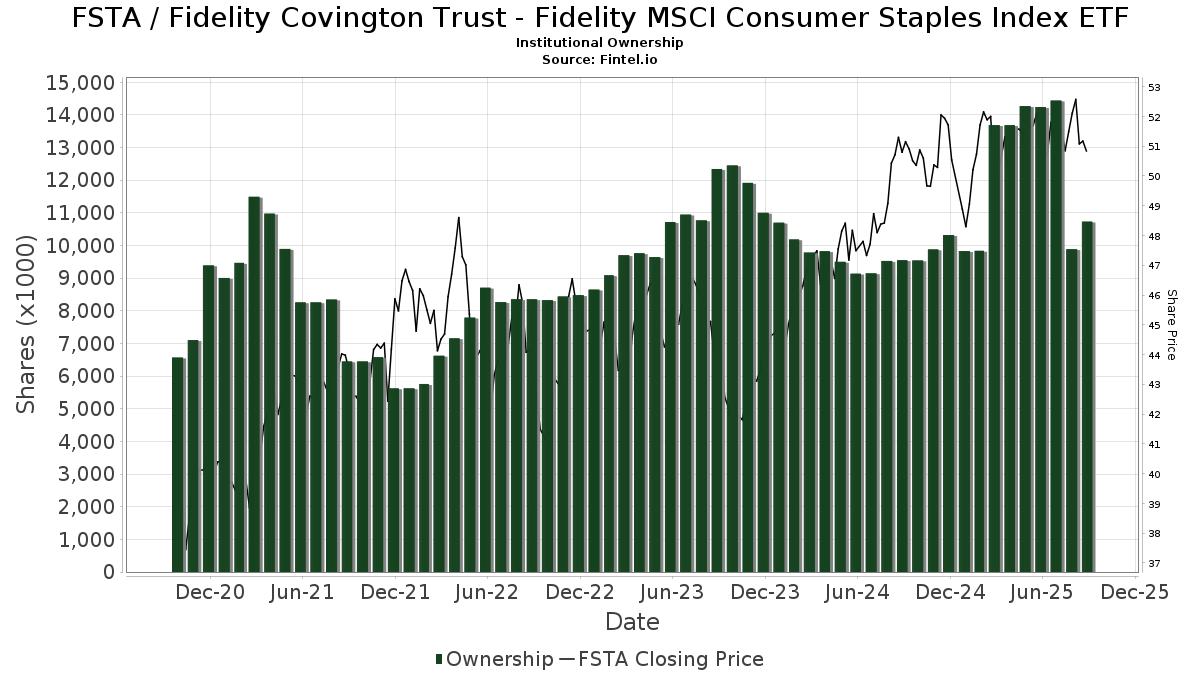
Fidelity Covington Trust - Fidelity MSCI Consumer Staples Index ETF (US:FSTA) har 211 Institutionella ägare och aktieägare som har lämnat in 13D/G- eller 13F-formulär till Securities Exchange Commission (SEC). Dessa institut innehar totalt 10,731,203 aktier. Största aktieägare inkluderar Charles Schwab Investment Management Inc, Lido Advisors, LLC, Advisor Group Holdings, Inc., Agf Management Ltd, Commonwealth Equity Services, Llc, LPL Financial LLC, Envestnet Asset Management Inc, Certified Advisory Corp, Compass Financial Group, INC/SD, and Northern Lights Fund Trust - PFG Fidelity Institutional AM® Equity Sector Strategy Fund Class R Shares .
Fidelity Covington Trust - Fidelity MSCI Consumer Staples Index ETF (ARCA:FSTA) Institutionell ägarstruktur visar institutioners och fonders nuvarande positioner i företaget, samt de senaste förändringarna i positionernas storlek. Större aktieägare kan vara enskilda investerare, fonder, hedgefonder eller institutioner. Bilaga 13D visar att investeraren äger (eller ägde) mer än 5% av företaget och avser (eller avsåg) att aktivt eftersträva en förändring av affärsstrategin. Schedule 13G indikerar en passiv investering på över 5%.
The share price as of September 12, 2025 is 51,19 / share. Previously, on September 13, 2024, the share price was 51,53 / share. This represents a decline of 0,66% over that period.
Fondsentimentets poäng
Fondsentimentet poängen(fka Ägarackumulation-poäng) visar vilka aktier som är mest köpta av fonder. Det är resultatet av en sofistikerad kvantitativ flerfaktormodell som identifierar företag med de högsta nivåerna av institutionell ackumulering. Poängsättningsmodellen använder en kombination av den totala ökningen av redovisade ägare, förändringarna i portföljallokeringarna för dessa ägare och andra mått. Siffran sträcker sig från 0 till 100, där högre siffror indikerar en högre nivå av ackumulering i förhållande till sina konkurrenter, och 50 är genomsnittet.
Uppdateringsfrekvens: Dagligen
Se Ownership Explorer, som innehåller en lista över de högst rankade företagen.
Institutionell sälj/köp-kvot
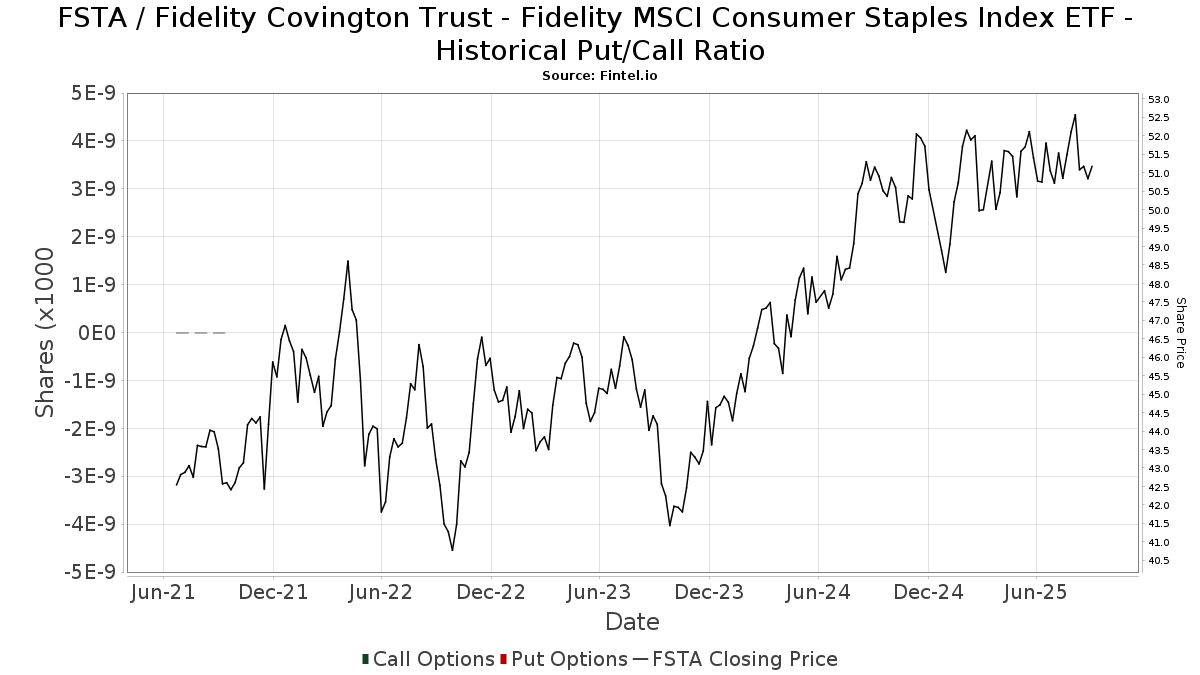
Förutom att rapportera vanliga eget kapital- och skuldemissioner måste institutioner med mer än 100MM tillgångar under förvaltning också avslöja sina innehav av sälj- och köpoptioner. Eftersom säljoptioner i allmänhet indikerar ett negativt sentiment och köpoptioner indikerar ett positivt sentiment, kan vi få en uppfattning om det övergripande institutionella sentimentet genom att plotta förhållandet mellan säljoptioner och köpoptioner. Diagrammet till höger visar det historiska förhållandet mellan sälj- och köpoptioner för detta instrument.
Genom att använda sälj/köp-kvoten som en indikator på aktieägarnas sentiment undviker man en av de största bristerna med att använda det totala institutionella ägandet, nämligen att en betydande del av de förvaltade tillgångarna investeras passivt för att följa index. Passivt förvaltade fonder köper vanligtvis inte optioner, så indikatorn för sälj/köp-kvoten ger en bättre bild av stämningen i aktivt förvaltade fonder.
13F- och NPORT-arkiveringar
Detaljer om 13F-arkiveringar är gratis. Detaljer om NP-arkiveringar kräver ett premiummedlemskap. Gröna rader indikerar nya positioner. Röda rader indikerar stängda positioner. Klicka på länk symbolen för att se hela transaktionshistoriken.
Uppgradera
för att låsa upp premiumdata och exportera till Excel ![]() .
.
| Fil Datum | Källa | Investerare | Typ | Genomsnittligt pris (beräknat) |
Aktier | Δ Aktier (%) |
Rapporterat värde (1000 USD) |
Δ Värde (%) |
Portföljallokering (%) |
|
|---|---|---|---|---|---|---|---|---|---|---|
| 2025-08-12 | 13F | Steward Partners Investment Advisory, Llc | 17 413 | 21,38 | 891 | 21,42 | ||||
| 2025-07-22 | 13F | Partners Wealth Management, Llc | 15 995 | 0,00 | 821 | 0,49 | ||||
| 2025-08-08 | 13F | Foundations Investment Advisors, LLC | 98 888 | 9,43 | 5 058 | 9,48 | ||||
| 2025-05-27 | NP | EVVLX - The E-Valuator Very Conservative (0%-15%) RMS Fund Service Class Shares | 222 | −40,80 | 11 | −38,89 | ||||
| 2025-05-13 | 13F | Adams Wealth Management | 103 058 | 5 269 | ||||||
| 2025-08-12 | 13F | Jpmorgan Chase & Co | 68 841 | −3,54 | 3 521 | −3,51 | ||||
| 2025-08-29 | 13F | Centaurus Financial, Inc. | 3 085 | 9,01 | 0 | |||||
| 2025-05-13 | 13F | CacheTech Inc. | 103 058 | 5 269 | ||||||
| 2025-07-21 | 13F | Ameritas Advisory Services, LLC | 10 507 | −16,43 | 537 | −14,63 | ||||
| 2025-08-14 | 13F | Full Sail Capital, LLC | 90 921 | −0,94 | 4 651 | −0,92 | ||||
| 2025-07-14 | 13F | Sweeney & Michel, Llc | 18 000 | 0,44 | 918 | 6,87 | ||||
| 2025-07-30 | 13F | Financial Perspectives, Inc | 119 747 | 4,66 | 6 125 | 3,99 | ||||
| 2025-07-29 | 13F | Systelligence, LLC | 0 | −100,00 | 0 | |||||
| 2025-07-17 | 13F | Janney Montgomery Scott LLC | 5 045 | 4,32 | 0 | |||||
| 2025-08-04 | 13F | Creative Financial Designs Inc /adv | 5 583 | 13,80 | 286 | 14,00 | ||||
| 2025-07-17 | 13F | Beacon Capital Management, LLC | 118 | 0,85 | 6 | 20,00 | ||||
| 2025-08-14 | 13F | UBS Group AG | 53 378 | 0,44 | 2 730 | 0,48 | ||||
| 2025-08-01 | 13F | Envestnet Asset Management Inc | 225 612 | 27,35 | 11 540 | 27,40 | ||||
| 2025-08-14 | 13F | Integrated Wealth Concepts LLC | 0 | −100,00 | 0 | |||||
| 2025-08-14 | 13F | Snowden Capital Advisors LLC | 26 946 | −3,25 | 1 378 | −3,23 | ||||
| 2025-08-12 | 13F | Bokf, Na | 1 535 | 0,00 | 79 | 0,00 | ||||
| 2025-08-19 | 13F | Cape Investment Advisory, Inc. | 1 096 | 11,04 | 56 | 12,00 | ||||
| 2025-08-14 | 13F | Stifel Financial Corp | 48 151 | −4,35 | 2 463 | −4,31 | ||||
| 2025-08-12 | 13F | Charles Schwab Investment Management Inc | 2 260 071 | 0,19 | 115 603 | 0,23 | ||||
| 2025-08-14 | 13F | Fmr Llc | 56 039 | −20,80 | 2 866 | −20,76 | ||||
| 2025-04-29 | 13F | Element Wealth, LLC | 0 | −100,00 | 0 | |||||
| 2025-07-25 | 13F | Cwm, Llc | 1 672 | 1 462,62 | 0 | |||||
| 2025-08-04 | 13F | Spire Wealth Management | 1 144 | 13,04 | 59 | 13,73 | ||||
| 2025-08-07 | 13F | Kestra Private Wealth Services, Llc | 22 086 | −1,94 | 1 130 | −1,91 | ||||
| 2025-08-12 | 13F | Atlas Capital Advisors Llc | 95 118 | −26,64 | 4 865 | −26,61 | ||||
| 2025-08-14 | 13F | Quantinno Capital Management LP | 4 389 | 225 | ||||||
| 2025-08-14 | 13F/A | Rockefeller Capital Management L.P. | 28 840 | −4,98 | 1 475 | −4,90 | ||||
| 2025-08-14 | 13F | Susquehanna International Group, Llp | 51 653 | 137,29 | 2 642 | 137,59 | ||||
| 2025-07-16 | 13F | Fischer Financial Services, Inc. | 145 094 | 0,01 | 7 421 | 0,03 | ||||
| 2025-08-04 | 13F | FRG Family Wealth Advisors LLC | 32 285 | 51,15 | 1 651 | 51,19 | ||||
| 2025-07-17 | 13F | Wolff Wiese Magana Llc | 31 | 0,00 | 2 | 0,00 | ||||
| 2025-08-12 | 13F | Global Retirement Partners, LLC | 3 699 | 1,59 | 189 | 5,59 | ||||
| 2025-08-05 | 13F | Sigma Planning Corp | 34 705 | 2,08 | 1 775 | 2,13 | ||||
| 2025-08-18 | 13F | Geneos Wealth Management Inc. | 21 | −59,62 | 1 | −50,00 | ||||
| 2025-08-12 | 13F | Proequities, Inc. | 0 | 0 | ||||||
| 2025-07-16 | 13F | Brown, Lisle/cummings, Inc. | 23 | 0,00 | 1 | 0,00 | ||||
| 2025-08-15 | 13F | Kestra Advisory Services, LLC | 117 859 | 4,75 | 6 029 | 4,80 | ||||
| 2025-07-31 | 13F | CVA Family Office, LLC | 10 | 0,00 | 1 | |||||
| 2025-08-05 | 13F | Dunhill Financial, LLC | 974 | 50 | ||||||
| 2025-08-07 | 13F | Allworth Financial LP | 2 756 | −2,23 | 141 | −2,10 | ||||
| 2025-07-23 | 13F | Pillar Financial Advisors, LLC | 57 | 0,00 | 3 | 0,00 | ||||
| 2025-07-16 | 13F/A | CX Institutional | 4 122 | 108,08 | 0 | |||||
| 2025-04-23 | 13F | Mascagni Wealth Management, Inc. | 0 | −100,00 | 0 | |||||
| 2025-08-06 | 13F | Soltis Investment Advisors LLC | 8 376 | 3,37 | 428 | 3,38 | ||||
| 2025-08-14 | 13F | Sunbelt Securities, Inc. | 10 248 | 1,49 | 507 | −1,94 | ||||
| 2025-07-24 | 13F | Robertson Stephens Wealth Management, LLC | 4 533 | 0,00 | 232 | 0,00 | ||||
| 2025-07-16 | 13F | Southern Capital Advisors, Llc | 8 189 | 0,58 | 419 | 0,48 | ||||
| 2025-08-06 | 13F | Columbia River Financial Group, LLC | 0 | −100,00 | 0 | |||||
| 2025-08-14 | 13F | GWM Advisors LLC | 91 281 | −2,94 | 4 669 | −2,91 | ||||
| 2025-08-14 | 13F/A | Skopos Labs, Inc. | 551 | 28 | ||||||
| 2025-05-27 | NP | EVGLX - The E-Valuator Growth (70%-85%) RMS Fund Service Class Shares | 39 699 | −25,96 | 2 030 | −23,43 | ||||
| 2025-08-04 | 13F | Pensionmark Financial Group, Llc | 11 114 | 3,17 | 568 | 3,27 | ||||
| 2025-08-08 | 13F | Pnc Financial Services Group, Inc. | 10 553 | 3,58 | 540 | 3,65 | ||||
| 2025-07-22 | 13F | Yoder Wealth Management, Inc. | 34 067 | 3,34 | 1 743 | 3,38 | ||||
| 2025-07-30 | 13F | Brookstone Capital Management | 8 871 | −9,86 | 454 | −9,94 | ||||
| 2025-07-22 | 13F | Belpointe Asset Management LLC | 3 913 | 200 | ||||||
| 2025-07-31 | 13F | Moser Wealth Advisors, LLC | 93 | 5 | ||||||
| 2025-08-13 | 13F | Fisher Asset Management, LLC | 8 375 | −15,85 | 428 | −15,75 | ||||
| 2025-08-12 | 13F | Pathstone Holdings, LLC | 0 | −100,00 | 0 | |||||
| 2025-08-08 | 13F | Larson Financial Group LLC | 182 426 | 3,39 | 9 331 | 3,44 | ||||
| 2025-08-13 | 13F | KDK Private Wealth Management, LLC | 22 505 | −4,57 | 1 151 | −4,48 | ||||
| 2025-07-30 | 13F | Gables Capital Management Inc. | 308 | 0,00 | 16 | 0,00 | ||||
| 2025-08-15 | 13F | Tower Research Capital LLC (TRC) | 10 707 | 31 391,18 | 548 | 54 600,00 | ||||
| 2025-07-14 | 13F | Park Avenue Securities Llc | 8 781 | 31,61 | 0 | |||||
| 2025-08-06 | 13F | Agf Management Ltd | 424 991 | 1,50 | 21 738 | 1,54 | ||||
| 2025-08-14 | 13F | Sentinus, LLC | 6 406 | 328 | ||||||
| 2025-08-05 | 13F | GPS Wealth Strategies Group, LLC | 1 337 | 68 | ||||||
| 2025-04-23 | 13F | GHP Investment Advisors, Inc. | 0 | −100,00 | 0 | |||||
| 2025-07-18 | 13F | Bartlett & Co. Wealth Management Llc | 19 | 0,00 | 1 | |||||
| 2025-07-16 | 13F | Signature Resources Capital Management, LLC | 470 | 24 | ||||||
| 2025-07-29 | 13F | AssuredPartners Investment Advisors, LLC | 0 | −100,00 | 0 | |||||
| 2025-07-29 | 13F | FLC Capital Advisors | 5 003 | 0,00 | 256 | 0,00 | ||||
| 2025-07-30 | 13F | Whittier Trust Co | 1 885 | 0,00 | 96 | 0,00 | ||||
| 2025-05-09 | 13F | GeoWealth Management, LLC | 0 | −100,00 | 0 | |||||
| 2025-08-21 | 13F | Pathway Financial Advisers, LLC | 4 849 | 4,68 | 248 | 5,08 | ||||
| 2025-08-08 | 13F | Meridian Wealth Management, LLC | 12 508 | 0,55 | 640 | 0,63 | ||||
| 2025-08-13 | 13F | Jones Financial Companies Lllp | 13 919 | 50,90 | 709 | 52,80 | ||||
| 2025-08-11 | 13F | Brown Brothers Harriman & Co | 3 445 | 176 | ||||||
| 2025-04-24 | 13F | Wingate Wealth Advisors, Inc. | 0 | −100,00 | 0 | |||||
| 2025-08-08 | 13F | Cetera Investment Advisers | 72 589 | 21,67 | 3 713 | 21,70 | ||||
| 2025-08-11 | 13F | Heritage Wealth Advisors | 240 | 0,00 | 12 | 0,00 | ||||
| 2025-08-04 | 13F | UNIVEST FINANCIAL Corp | 0 | −100,00 | 0 | |||||
| 2025-08-12 | 13F | O'shaughnessy Asset Management, Llc | 7 117 | 2,79 | 364 | 2,82 | ||||
| 2025-08-14 | 13F | Bank Of America Corp /de/ | 56 699 | 17,62 | 2 900 | 17,69 | ||||
| 2025-08-13 | 13F | Colonial Trust Advisors | 0 | −100,00 | 0 | |||||
| 2025-07-31 | 13F | Cambridge Investment Research Advisors, Inc. | 98 934 | −0,25 | 5 | 0,00 | ||||
| 2025-08-08 | 13F | Kingsview Wealth Management, LLC | 5 977 | 2,57 | 306 | 2,69 | ||||
| 2025-05-14 | 13F | Apexium Financial, Lp | 0 | −100,00 | 0 | |||||
| 2025-07-24 | 13F | IFP Advisors, Inc | 3 412 | −0,87 | 175 | −0,57 | ||||
| 2025-07-30 | 13F | Retirement Planning Group | 5 372 | −5,09 | 275 | −5,19 | ||||
| 2025-03-21 | 13F | Prostatis Group LLC | 0 | −100,00 | 0 | |||||
| 2025-07-08 | 13F | Nbc Securities, Inc. | 7 606 | −5,76 | 0 | |||||
| 2025-07-30 | 13F | Bogart Wealth, LLC | 624 | 32 | ||||||
| 2025-08-12 | 13F | AlphaCore Capital LLC | 2 860 | 146 | ||||||
| 2025-08-14 | 13F | Hrt Financial Lp | 9 484 | 0 | ||||||
| 2025-07-30 | 13F | Demars Financial Group, LLC | 16 193 | −99,63 | 828 | 862,79 | ||||
| 2025-07-28 | 13F | Harbour Investments, Inc. | 2 418 | −0,82 | 124 | −0,81 | ||||
| 2025-07-21 | 13F | Fortis Capital Advisors, LLC | 3 913 | 200 | ||||||
| 2025-07-30 | 13F | Pacific Sun Financial Corp | 10 688 | −2,73 | 547 | −2,67 | ||||
| 2025-08-13 | 13F | EverSource Wealth Advisors, LLC | 50 | 0,00 | 3 | 0,00 | ||||
| 2025-08-14 | 13F | Citadel Advisors Llc | 64 961 | 3 323 | ||||||
| 2025-08-06 | 13F | Csenge Advisory Group | 6 456 | 0,00 | 338 | 1,81 | ||||
| 2025-08-07 | 13F | Parkside Financial Bank & Trust | 4 | 0,00 | 0 | |||||
| 2025-08-14 | 13F | Kovitz Investment Group Partners, LLC | 174 604 | 196,90 | 8 931 | 197,11 | ||||
| 2025-05-05 | 13F | Morningstar Investment Services LLC | 19 714 | −70,03 | 1 | −66,67 | ||||
| 2025-07-24 | 13F | Blair William & Co/il | 198 | 0,00 | 10 | 0,00 | ||||
| 2025-08-13 | 13F | Continuum Advisory, LLC | 0 | −100,00 | 0 | |||||
| 2025-05-27 | NP | EVMLX - The E-Valuator Moderate (50%-70%) RMS Fund Service Class Shares | 23 845 | −28,24 | 1 219 | −25,76 | ||||
| 2025-08-11 | 13F | HHM Wealth Advisors, LLC | 0 | −100,00 | 0 | |||||
| 2025-08-11 | 13F | Independent Advisor Alliance | 7 906 | 0,93 | 404 | 1,00 | ||||
| 2025-08-14 | 13F | Raymond James Financial Inc | 8 795 | 22,84 | 450 | 22,68 | ||||
| 2025-07-25 | 13F | Concord Wealth Partners | 102 | 0,99 | 5 | 0,00 | ||||
| 2025-08-19 | 13F | Newbridge Financial Services Group, Inc. | 343 | 0,00 | 18 | 0,00 | ||||
| 2025-08-14 | 13F | Jane Street Group, Llc | 14 006 | 716 | ||||||
| 2025-07-22 | 13F | Compass Financial Group, INC/SD | 218 431 | 10,04 | 11 173 | 10,08 | ||||
| 2025-07-25 | 13F | Envestnet Portfolio Solutions, Inc. | 11 659 | 51,40 | 596 | 51,65 | ||||
| 2025-08-14 | 13F | Federation des caisses Desjardins du Quebec | 1 410 | 0,00 | 72 | 0,00 | ||||
| 2025-07-16 | 13F | Dakota Wealth Management | 0 | −100,00 | 0 | |||||
| 2025-08-14 | 13F | Wells Fargo & Company/mn | 30 185 | 2,87 | 1 544 | 2,87 | ||||
| 2025-08-14 | 13F | Talon Private Wealth, LLC | 4 715 | −4,26 | 241 | −3,98 | ||||
| 2025-07-29 | 13F | TFC Financial Management | 905 | 0,00 | 46 | 0,00 | ||||
| 2025-07-14 | 13F | Buska Wealth Management, LLC | 23 300 | −12,13 | 1 192 | −12,10 | ||||
| 2025-07-14 | 13F | Pacifica Partners Inc. | 1 461 | 117,73 | 74 | 117,65 | ||||
| 2025-05-27 | NP | EVAGX - The E-Valuator Aggressive Growth (85%-99%) RMS Fund Service Class Shares | 40 585 | −17,86 | 2 075 | −15,03 | ||||
| 2025-07-31 | 13F | Briaud Financial Planning, Inc | 256 | 0 | ||||||
| 2025-06-30 | NP | Northern Lights Fund Trust - PFG Fidelity Institutional AM® Equity Sector Strategy Fund Class R Shares | 197 367 | −59,72 | 10 178 | −55,66 | ||||
| 2025-07-25 | 13F | Atria Wealth Solutions, Inc. | 52 791 | 1,80 | 2 710 | 2,23 | ||||
| 2025-07-28 | 13F | Rosenberg Matthew Hamilton | 2 986 | 0,00 | 153 | 0,00 | ||||
| 2025-07-18 | 13F | Truist Financial Corp | 17 684 | −4,77 | 905 | −4,74 | ||||
| 2025-07-21 | 13F | Curran Financial Partners, LLC | 12 957 | −1,17 | 663 | −1,19 | ||||
| 2025-07-29 | 13F | Private Trust Co Na | 1 007 | 113,80 | 52 | 112,50 | ||||
| 2025-08-13 | 13F | Summit Financial, LLC | 5 309 | −18,44 | 272 | −18,37 | ||||
| 2025-07-17 | 13F | Avondale Wealth Management | 1 | −100,00 | 0 | −100,00 | ||||
| 2025-05-27 | NP | EVCLX - The E-Valuator Conservative (15%-30%) RMS Fund Service Class Shares | 6 058 | 10,73 | 310 | 14,44 | ||||
| 2025-09-04 | 13F/A | Advisor Group Holdings, Inc. | 430 477 | 65,97 | 22 035 | 65,99 | ||||
| 2025-07-16 | 13F | Maridea Wealth Management LLC | 0 | −100,00 | 0 | |||||
| 2025-08-05 | 13F | Lifeworks Advisors, LLC | 72 232 | 91,90 | 3 695 | 92,00 | ||||
| 2025-08-15 | 13F | Morgan Stanley | 158 272 | 3,79 | 8 096 | 3,84 | ||||
| 2025-08-12 | 13F | Soundwatch Capital LLC | 3 951 | 2 341 | ||||||
| 2025-07-15 | 13F | Define Financial, Llc | 4 365 | 0,58 | 223 | 1,83 | ||||
| 2025-08-05 | 13F | Bank of New York Mellon Corp | 13 926 | 29,92 | 712 | 29,93 | ||||
| 2025-08-11 | 13F | Aptus Capital Advisors, LLC | 73 | 0,00 | 4 | 0,00 | ||||
| 2025-07-11 | 13F | Farther Finance Advisors, LLC | 426 | −57,86 | 22 | −58,82 | ||||
| 2025-08-11 | 13F | Wbi Investments, Inc. | 61 394 | −6,01 | 3 140 | −5,96 | ||||
| 2025-07-07 | 13F | Nova Wealth Management, Inc. | 17 537 | 11,71 | 897 | 11,85 | ||||
| 2025-08-08 | 13F | Thrive Capital Management, LLC | 0 | −100,00 | 0 | |||||
| 2025-08-14 | 13F | Smartleaf Asset Management LLC | 141 | −70,87 | 7 | −70,83 | ||||
| 2025-07-15 | 13F | Lynch & Associates/in | 27 978 | 0,49 | 1 431 | 0,56 | ||||
| 2025-08-14 | 13F | Mml Investors Services, Llc | 23 352 | 161,09 | 1 | |||||
| 2025-07-31 | 13F | Brinker Capital Investments, LLC | 0 | −100,00 | 0 | −100,00 | ||||
| 2025-07-23 | 13F | Heck Capital Advisors, LLC | 27 973 | 1,26 | 1 431 | 1,27 | ||||
| 2025-07-17 | 13F | Fifth Third Securities, Inc. | 4 561 | −4,76 | 233 | −4,51 | ||||
| 2025-08-13 | 13F | Green Harvest Asset Management LLC | 11 963 | −14,67 | 612 | −14,66 | ||||
| 2025-08-07 | 13F | 1620 Investment Advisors, Inc. | 118 | 0,00 | 6 | 0,00 | ||||
| 2025-07-31 | 13F | Sage Mountain Advisors LLC | 825 | 0,00 | 42 | 0,00 | ||||
| 2025-08-08 | 13F | Avantax Advisory Services, Inc. | 8 405 | 6,47 | 430 | 6,45 | ||||
| 2025-05-01 | 13F | Grant/GrossMendelsohn, LLC | 58 233 | 2 961 | ||||||
| 2025-08-07 | 13F | Resources Investment Advisors, LLC. | 3 997 | 204 | ||||||
| 2025-08-05 | 13F | EPG Wealth Management LLC | 685 | 0,44 | 35 | 2,94 | ||||
| 2025-08-12 | 13F | Howe & Rusling Inc | 119 | 6 | ||||||
| 2025-08-01 | 13F | SYM FINANCIAL Corp | 395 | 20 | ||||||
| 2025-04-23 | 13F | PMV Capital Advisers, LLC | 0 | −100,00 | 0 | |||||
| 2025-08-13 | 13F | Quadrant Capital Group Llc | 0 | −100,00 | 0 | |||||
| 2025-08-12 | 13F | MAI Capital Management | 2 270 | 2,76 | 116 | 3,57 | ||||
| 2025-08-13 | 13F | Capital Analysts, Inc. | 469 | 0,64 | 0 | |||||
| 2025-08-11 | 13F | HighTower Advisors, LLC | 10 573 | −23,63 | 541 | −23,62 | ||||
| 2025-08-11 | 13F | Sykon Capital Llc | 47 557 | 2 433 | ||||||
| 2025-07-15 | 13F | GSB Wealth Management, LLC | 8 342 | 10,61 | 427 | 10,65 | ||||
| 2025-05-14 | 13F | CIBC Private Wealth Group, LLC | 0 | −100,00 | 0 | −100,00 | ||||
| 2025-08-12 | 13F | J.w. Cole Advisors, Inc. | 78 244 | 76,41 | 4 002 | 76,53 | ||||
| 2025-08-08 | 13F | Creative Planning | 6 890 | 0,23 | 352 | 0,28 | ||||
| 2025-07-30 | 13F | Avidian Wealth Solutions, LLC | 8 564 | 0,00 | 438 | 0,23 | ||||
| 2025-08-12 | 13F | Coldstream Capital Management Inc | 0 | −100,00 | 0 | |||||
| 2025-08-04 | 13F | Assetmark, Inc | 111 090 | 926,43 | 5 682 | 927,49 | ||||
| 2025-08-14 | 13F | Certified Advisory Corp | 219 584 | 1,14 | 11 232 | 1,18 | ||||
| 2025-07-11 | 13F | LongView Wealth Management | 6 127 | 8,96 | 313 | 9,06 | ||||
| 2025-08-13 | 13F | Marshall Wace, Llp | 9 342 | 478 | ||||||
| 2025-08-04 | 13F | Arkadios Wealth Advisors | 47 423 | 15,87 | 2 426 | 15,92 | ||||
| 2025-07-30 | 13F | Crewe Advisors LLC | 0 | −100,00 | 0 | |||||
| 2025-08-15 | 13F | CI Private Wealth, LLC | 8 058 | 0,00 | 412 | 0,00 | ||||
| 2025-07-11 | 13F | Walker Financial Services, Inc. | 40 724 | 4,82 | 2 083 | 4,88 | ||||
| 2025-07-07 | 13F | Roxbury Financial LLC | 56 213 | −1,03 | 2 875 | −3,65 | ||||
| 2025-07-30 | 13F | Roman Butler Fullerton & Co | 8 820 | 0,00 | 453 | 0,89 | ||||
| 2025-07-16 | 13F | American National Bank | 14 877 | −8,52 | 761 | −8,54 | ||||
| 2025-08-13 | 13F | Colonial Trust Co / SC | 954 | 0,00 | 49 | 0,00 | ||||
| 2025-08-12 | 13F | LPL Financial LLC | 387 090 | 16,43 | 19 800 | 16,47 | ||||
| 2025-07-03 | 13F | TrueWealth Advisors, LLC | 9 026 | 0,00 | 462 | 0,00 | ||||
| 2025-07-10 | 13F | Oliver Lagore Vanvalin Investment Group | 169 | −65,86 | 9 | −66,67 | ||||
| 2025-07-08 | 13F | Parallel Advisors, LLC | 115 | 6 | ||||||
| 2025-08-14 | 13F | Comerica Bank | 14 924 | 0,04 | 763 | 0,13 | ||||
| 2025-07-08 | 13F | Atlas Brown,Inc. | 27 133 | −0,03 | 1 388 | 0,00 | ||||
| 2025-08-14 | 13F | Warren Averett Asset Management, LLC | 58 036 | 2 969 | ||||||
| 2025-08-06 | 13F | Commonwealth Equity Services, Llc | 422 155 | −3,05 | 22 | −4,55 | ||||
| 2025-08-04 | 13F | MeadowBrook Investment Advisors LLC | 0 | −100,00 | 0 | |||||
| 2025-05-27 | NP | EVTTX - The E-Valuator Conservative/Moderate (30%-50%) RMS Fund Service Class Shares | 3 801 | −14,74 | 194 | −11,82 | ||||
| 2025-07-21 | 13F | HighMark Wealth Management LLC | 100 | 0,00 | 5 | 0,00 | ||||
| 2025-07-16 | 13F | Signaturefd, Llc | 40 | 2 | ||||||
| 2025-07-30 | 13F | Cullen/frost Bankers, Inc. | 687 | 61,27 | 35 | 66,67 | ||||
| 2025-04-28 | 13F | Strategic Financial Concepts, LLC | 0 | −100,00 | 0 | −100,00 | ||||
| 2025-07-17 | 13F | Smith, Salley & Associates | 23 706 | 0,76 | 1 213 | 0,83 | ||||
| 2025-08-06 | 13F | Stonebridge Financial Planning Group, LLC | 9 108 | 0,00 | 466 | 0,00 | ||||
| 2025-08-14 | 13F | Mariner, LLC | 10 588 | −3,80 | 542 | −3,74 | ||||
| 2025-08-13 | 13F | Lido Advisors, LLC | 1 399 498 | 5,06 | 71 584 | 5,10 | ||||
| 2025-08-12 | 13F | SRS Capital Advisors, Inc. | 43 508 | 18,82 | 2 248 | 20,03 | ||||
| 2025-08-12 | 13F | Franklin Resources Inc | 0 | −100,00 | 0 | |||||
| 2025-08-19 | 13F | Asset Dedication, LLC | 1 055 | 0,00 | 54 | 0,00 | ||||
| 2025-05-15 | 13F | D. E. Shaw & Co., Inc. | 0 | −100,00 | 0 | −100,00 | ||||
| 2025-08-06 | 13F | AE Wealth Management LLC | 133 958 | 9,24 | 6 852 | 9,27 | ||||
| 2025-08-11 | 13F | Private Advisor Group, LLC | 0 | −100,00 | 0 | |||||
| 2025-08-05 | 13F | Huntington National Bank | 0 | |||||||
| 2025-08-14 | 13F | Goldman Sachs Group Inc | 122 003 | 0,00 | 6 240 | 0,03 | ||||
| 2025-04-28 | 13F | UMA Financial Services, Inc. | 0 | −100,00 | 0 | |||||
| 2025-07-17 | 13F | Sound Income Strategies, LLC | 59 | 0,00 | 3 | 0,00 | ||||
| 2025-07-28 | 13F | RFG Advisory, LLC | 8 600 | −25,77 | 440 | −25,84 | ||||
| 2025-07-02 | 13F | Marotta Asset Management | 102 599 | 13,50 | 5 248 | 13,72 | ||||
| 2025-07-28 | 13F | Acorn Financial Advisory Services Inc /adv | 5 726 | 35,72 | 293 | 35,81 | ||||
| 2025-08-04 | 13F | Atria Investments Llc | 4 690 | 240 | ||||||
| 2025-08-14 | 13F | Two Sigma Investments, Lp | 7 400 | 379 | ||||||
| 2025-08-12 | 13F | OneAscent Financial Services LLC | 14 879 | 1 | ||||||
| 2025-08-06 | 13F | Valued Wealth Advisors LLC | 93 | 0,00 | 5 | 0,00 | ||||
| 2025-08-13 | 13F | Russell Investments Group, Ltd. | 72 | 380,00 | 4 | |||||
| 2025-08-14 | 13F | Royal Bank Of Canada | 13 205 | 12,86 | 675 | 12,88 | ||||
| 2025-07-30 | 13F | VCI Wealth Management LLC | 15 475 | 7,15 | 792 | 7,18 | ||||
| 2025-08-19 | 13F | Advisory Services Network, LLC | 0 | −100,00 | 0 | |||||
| 2025-05-16 | 13F | McIlrath & Eck, LLC | 0 | −100,00 | 0 | |||||
| 2025-08-01 | 13F | Liberty Wealth Management Llc | 3 937 | 201 | ||||||
| 2025-08-04 | 13F | Prairie Wealth Advisors, Inc. | 9 952 | 7,00 | 509 | 7,16 | ||||
| 2025-07-21 | 13F | Exchange Capital Management, Inc. | 20 562 | −1,98 | 1 052 | −1,96 | ||||
| 2025-08-01 | 13F | Rossby Financial, LCC | 396 | 0,00 | 20 | 0,00 | ||||
| 2025-08-12 | 13F | Coston, McIsaac & Partners | 1 030 | 0,59 | 0 | |||||
| 2025-08-14 | 13F | Ameriprise Financial Inc | 42 846 | 73,49 | 2 191 | 73,53 | ||||
| 2025-07-30 | 13F | Mid-American Wealth Advisory Group, Inc. | 73 | 4 | ||||||
| 2025-07-16 | 13F | Beaumont Financial Advisors, LLC | 37 885 | 1,33 | 1 938 | 1,36 | ||||
| 2025-07-21 | 13F | Ameriflex Group, Inc. | 214 | 0,00 | 11 | 0,00 | ||||
| 2025-07-16 | 13F | Castleview Partners, Llc | 5 811 | −32,72 | 297 | −32,65 | ||||
| 2025-07-22 | 13F | Mascoma Wealth Management LLC | 424 | 0,00 | 22 | 0,00 | ||||
| 2025-08-11 | 13F | Principal Securities, Inc. | 36 125 | −14,93 | 1 848 | −12,01 | ||||
| 2025-07-23 | 13F | Godsey & Gibb Associates | 400 | 0,00 | 20 | 0,00 | ||||
| 2025-08-04 | 13F | Keybank National Association/oh | 6 826 | 0,00 | 349 | 0,00 | ||||
| 2025-08-11 | 13F | Citigroup Inc | 11 497 | 6,77 | 588 | 6,91 | ||||
| 2025-08-13 | 13F | Northwestern Mutual Wealth Management Co | 22 762 | 805,77 | 1 164 | 809,38 |