Grundläggande statistik
| Institutionella ägare | 163 total, 163 long only, 0 short only, 0 long/short - change of 0,00% MRQ |
| Genomsnittlig portföljallokering | 0.3067 % - change of −9,70% MRQ |
| Institutionella aktier (lång) | 13 789 352 (ex 13D/G) - change of 1,00MM shares 7,83% MRQ |
| Institutionellt värde (lång) | $ 306 143 USD ($1000) |
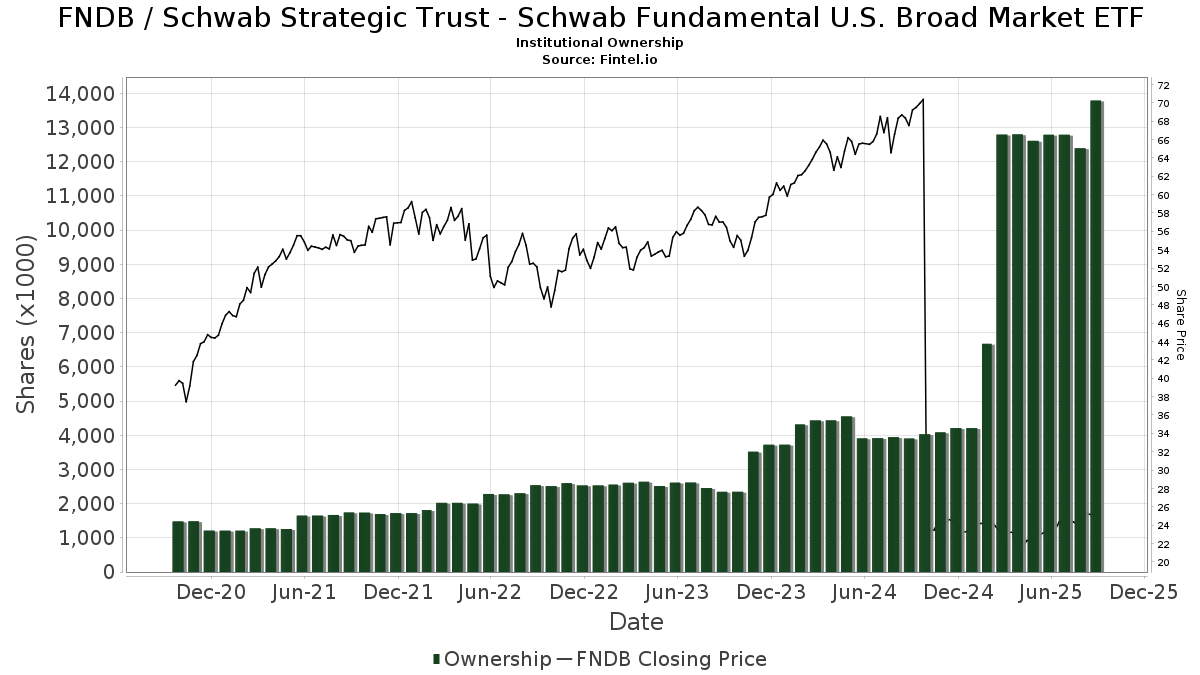
Institutionellt ägande och aktieägare
Schwab Strategic Trust - Schwab Fundamental U.S. Broad Market ETF (US:FNDB) har 163 Institutionella ägare och aktieägare som har lämnat in 13D/G- eller 13F-formulär till Securities Exchange Commission (SEC). Dessa institut innehar totalt 13,789,352 aktier. Största aktieägare inkluderar Financial Consulate, Inc, Callan Capital, LLC, AlphaCore Capital LLC, Opes Wealth Management LLC, HighTower Advisors, LLC, Cambridge Investment Research Advisors, Inc., Sound Stewardship, LLC, Bank Of America Corp /de/, Morgan Stanley, and Brightwater Advisory LLC .
Schwab Strategic Trust - Schwab Fundamental U.S. Broad Market ETF (ARCA:FNDB) Institutionell ägarstruktur visar institutioners och fonders nuvarande positioner i företaget, samt de senaste förändringarna i positionernas storlek. Större aktieägare kan vara enskilda investerare, fonder, hedgefonder eller institutioner. Bilaga 13D visar att investeraren äger (eller ägde) mer än 5% av företaget och avser (eller avsåg) att aktivt eftersträva en förändring av affärsstrategin. Schedule 13G indikerar en passiv investering på över 5%.
The share price as of September 10, 2025 is 25,29 / share. Previously, on September 11, 2024, the share price was 22,51 / share. This represents an increase of 12,35% over that period.
Fondsentimentets poäng
Fondsentimentet poängen(fka Ägarackumulation-poäng) visar vilka aktier som är mest köpta av fonder. Det är resultatet av en sofistikerad kvantitativ flerfaktormodell som identifierar företag med de högsta nivåerna av institutionell ackumulering. Poängsättningsmodellen använder en kombination av den totala ökningen av redovisade ägare, förändringarna i portföljallokeringarna för dessa ägare och andra mått. Siffran sträcker sig från 0 till 100, där högre siffror indikerar en högre nivå av ackumulering i förhållande till sina konkurrenter, och 50 är genomsnittet.
Uppdateringsfrekvens: Dagligen
Se Ownership Explorer, som innehåller en lista över de högst rankade företagen.
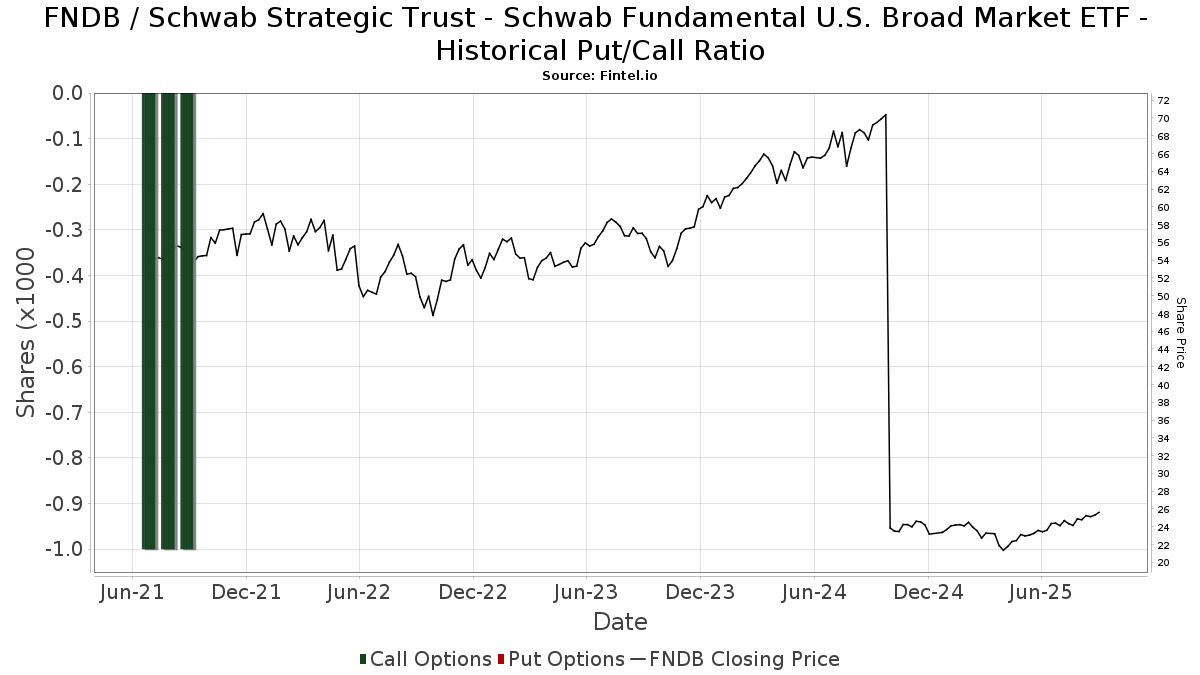
Institutionell sälj/köp-kvot
Förutom att rapportera vanliga eget kapital- och skuldemissioner måste institutioner med mer än 100MM tillgångar under förvaltning också avslöja sina innehav av sälj- och köpoptioner. Eftersom säljoptioner i allmänhet indikerar ett negativt sentiment och köpoptioner indikerar ett positivt sentiment, kan vi få en uppfattning om det övergripande institutionella sentimentet genom att plotta förhållandet mellan säljoptioner och köpoptioner. Diagrammet till höger visar det historiska förhållandet mellan sälj- och köpoptioner för detta instrument.
Genom att använda sälj/köp-kvoten som en indikator på aktieägarnas sentiment undviker man en av de största bristerna med att använda det totala institutionella ägandet, nämligen att en betydande del av de förvaltade tillgångarna investeras passivt för att följa index. Passivt förvaltade fonder köper vanligtvis inte optioner, så indikatorn för sälj/köp-kvoten ger en bättre bild av stämningen i aktivt förvaltade fonder.
13F- och NPORT-arkiveringar
Detaljer om 13F-arkiveringar är gratis. Detaljer om NP-arkiveringar kräver ett premiummedlemskap. Gröna rader indikerar nya positioner. Röda rader indikerar stängda positioner. Klicka på länk symbolen för att se hela transaktionshistoriken.
Uppgradera
för att låsa upp premiumdata och exportera till Excel ![]() .
.
| Fil Datum | Källa | Investerare | Typ | Genomsnittligt pris (beräknat) |
Aktier | Δ Aktier (%) |
Rapporterat värde (1000 USD) |
Δ Värde (%) |
Portföljallokering (%) |
|
|---|---|---|---|---|---|---|---|---|---|---|
| 2025-07-23 | 13F | Prime Capital Investment Advisors, LLC | 0 | −100,00 | 0 | |||||
| 2025-07-30 | 13F | Paul Damon & Associates, Inc. | 34 070 | 71,83 | 817 | 78,95 | ||||
| 2025-08-15 | 13F | Equitable Holdings, Inc. | 9 788 | 6,80 | 235 | 11,43 | ||||
| 2025-07-11 | 13F | Vanguard Capital Wealth Advisors This fund is a listed as child fund of Vanguard Group Inc and if that institution has disclosed ownership in this security, then these positions will not be double counted when calculating total shares and total value | 19 358 | −6,55 | 464 | −2,52 | ||||
| 2025-08-11 | 13F | Brown Brothers Harriman & Co | 51 171 | 0,00 | 1 227 | 4,25 | ||||
| 2025-08-13 | 13F | Quadrant Capital Group Llc | 43 944 | 0,00 | 1 054 | 4,15 | ||||
| 2025-08-05 | 13F | BCGM Wealth Management, LLC | 11 188 | −67,23 | 268 | −65,86 | ||||
| 2025-08-08 | 13F | Keyvantage Wealth, Llc | 14 484 | 0,00 | 347 | 4,20 | ||||
| 2025-07-18 | 13F | TruNorth Capital Management, LLC | 8 433 | 0,00 | 202 | 4,12 | ||||
| 2025-07-22 | 13F | Red Tortoise LLC | 46 357 | 0,18 | 1 112 | 4,42 | ||||
| 2025-07-23 | 13F | Values Added Financial LLC | 49 678 | 0,00 | 1 191 | 4,20 | ||||
| 2025-07-14 | 13F | AdvisorNet Financial, Inc | 13 005 | −56,61 | 312 | −54,86 | ||||
| 2025-05-27 | NP | EVVLX - The E-Valuator Very Conservative (0%-15%) RMS Fund Service Class Shares | 2 407 | 126,22 | 55 | 129,17 | ||||
| 2025-04-29 | 13F | Lee Danner & Bass Inc | 0 | −100,00 | 0 | |||||
| 2025-07-31 | 13F | Cambridge Investment Research Advisors, Inc. | 686 144 | 12,15 | 16 | 14,29 | ||||
| 2025-08-08 | 13F | Pinney & Scofield, Inc. | 360 | 0,00 | 9 | 0,00 | ||||
| 2025-07-29 | 13F | Foster & Motley Inc | 12 172 | 0,39 | 0 | |||||
| 2025-08-15 | 13F | Captrust Financial Advisors | 60 788 | −20,59 | 1 458 | −17,26 | ||||
| 2025-07-29 | 13F | Systelligence, LLC | 0 | −100,00 | 0 | |||||
| 2025-07-23 | 13F | Valmark Advisers, Inc. | 8 845 | −2,53 | 212 | 1,92 | ||||
| 2025-08-05 | 13F | Carolinas Wealth Consulting Llc | 0 | −100,00 | 0 | −100,00 | ||||
| 2025-07-24 | 13F | IFP Advisors, Inc | 0 | −100,00 | 0 | |||||
| 2025-08-12 | 13F | Aspiring Ventures, LLC | 121 366 | 0,00 | 2 910 | 6,91 | ||||
| 2025-08-14 | 13F | Avant Capital LLC | 22 310 | 6,11 | 535 | 10,56 | ||||
| 2025-07-14 | 13F | Foster Group, Inc. | 65 114 | 6,74 | 1 561 | 11,26 | ||||
| 2025-08-12 | 13F/A | Brightwater Advisory LLC | 290 415 | −1,90 | 6 964 | 2,25 | ||||
| 2025-08-05 | 13F | Plante Moran Financial Advisors, LLC | 351 | −9,30 | 8 | 0,00 | ||||
| 2025-08-14 | 13F | UBS Group AG | 115 672 | 6,02 | 2 774 | 10,48 | ||||
| 2025-08-11 | 13F | HHM Wealth Advisors, LLC | 96 693 | 0,00 | 2 319 | 4,23 | ||||
| 2025-08-14 | 13F | Raymond James Financial Inc | 279 639 | −37,27 | 6 706 | −34,63 | ||||
| 2025-08-12 | 13F | AlphaCore Capital LLC | 1 293 595 | 106 368,72 | 31 020 | 114 788,89 | ||||
| 2025-05-27 | NP | EVGLX - The E-Valuator Growth (70%-85%) RMS Fund Service Class Shares | 195 437 | −3,43 | 4 497 | −4,46 | ||||
| 2025-07-30 | 13F | Exencial Wealth Advisors, Llc | 35 945 | −0,29 | 862 | 3,86 | ||||
| 2025-08-08 | 13F | Cetera Investment Advisers | 26 110 | 60,89 | 626 | 67,83 | ||||
| 2025-07-29 | 13F | Chicago Partners Investment Group LLC | 22 029 | 0,00 | 543 | 9,92 | ||||
| 2025-04-29 | 13F | Callan Capital, LLC | 1 337 085 | −1,25 | 30 766 | −2,31 | ||||
| 2025-07-16 | 13F | Perigon Wealth Management, LLC | 15 258 | 0,00 | 366 | 3,99 | ||||
| 2025-08-08 | 13F | Pnc Financial Services Group, Inc. | 8 700 | −12,12 | 209 | −8,37 | ||||
| 2025-07-09 | 13F | GSG Advisors LLC | 42 487 | 0,32 | 1 019 | 9,94 | ||||
| 2025-07-09 | 13F | Breakwater Investment Management | 8 943 | 0,00 | 214 | 4,39 | ||||
| 2025-07-11 | 13F | SILVER OAK SECURITIES, Inc | 8 523 | 204 | ||||||
| 2025-08-11 | 13F | Pineridge Advisors LLC | 6 999 | 0,29 | 168 | 4,38 | ||||
| 2025-07-08 | 13F | Parallel Advisors, LLC | 2 999 | 99,93 | 72 | 108,82 | ||||
| 2025-08-11 | 13F | Traub Capital Management LLC | 1 050 | 25 | ||||||
| 2025-08-08 | 13F | Kaizen Financial Strategies | 117 633 | −0,59 | 2 821 | 3,60 | ||||
| 2025-08-13 | 13F | Jones Financial Companies Lllp | 52 895 | 186,09 | 1 263 | 199,29 | ||||
| 2025-09-04 | 13F/A | Advisor Group Holdings, Inc. | 54 666 | 10,10 | 1 311 | 14,80 | ||||
| 2025-07-16 | 13F | Townsend Asset Management Corp /nc/ /adv | 130 051 | −0,26 | 3 119 | 3,93 | ||||
| 2025-08-08 | 13F | KM Capital Management Ltd. | 19 809 | −18,02 | 475 | −14,57 | ||||
| 2025-08-08 | 13F | Larson Financial Group LLC | 2 500 | 31,58 | 60 | 37,21 | ||||
| 2025-07-22 | 13F | Valley National Advisers Inc | 6 210 | −22,67 | 0 | |||||
| 2025-08-14 | 13F | Goldman Sachs Group Inc | 273 068 | 217,63 | 6 548 | 231,04 | ||||
| 2025-08-29 | 13F | Centaurus Financial, Inc. | 5 903 | −6,54 | 0 | |||||
| 2025-08-13 | 13F | Lido Advisors, LLC | 12 238 | −4,70 | 293 | −0,68 | ||||
| 2025-05-01 | 13F | Fifth Third Securities, Inc. | 0 | −100,00 | 0 | |||||
| 2025-08-11 | 13F | Aptus Capital Advisors, LLC | 0 | −100,00 | 0 | |||||
| 2025-08-14 | 13F | Murphy & Mullick Capital Management Corp | 285 | 0,00 | 7 | 0,00 | ||||
| 2025-07-21 | 13F | Empirical Financial Services, LLC d.b.a. Empirical Wealth Management | 14 580 | 0,00 | 350 | 4,18 | ||||
| 2025-08-06 | 13F | Founders Financial Securities Llc | 49 823 | 1 195 | ||||||
| 2025-08-18 | 13F | Geneos Wealth Management Inc. | 2 787 | 0,00 | 67 | 3,13 | ||||
| 2025-03-12 | 13F/A | Private Capital Management Llc | 1 944 | −1,87 | 127 | −3,05 | ||||
| 2025-08-14 | 13F | Mml Investors Services, Llc | 145 641 | 63,02 | 3 | 50,00 | ||||
| 2025-08-06 | 13F | Commonwealth Equity Services, Llc | 83 401 | −2,73 | 2 | 100,00 | ||||
| 2025-07-30 | 13F | Retirement Planning Group | 17 424 | 0,00 | 418 | 4,25 | ||||
| 2025-08-01 | 13F | MorganRosel Wealth Management, LLC | 30 586 | −2,43 | 733 | 1,66 | ||||
| 2025-08-14 | 13F | GWM Advisors LLC | 1 923 | 0,00 | 46 | 4,55 | ||||
| 2025-08-14 | 13F | Mercer Global Advisors Inc /adv | 8 876 | −6,35 | 213 | −2,75 | ||||
| 2025-07-10 | 13F | Sovran Advisors, LLC | 18 223 | −5,34 | 443 | 7,26 | ||||
| 2025-08-01 | 13F | James Investment Research Inc | 73 197 | 7,92 | 1 755 | 12,50 | ||||
| 2025-07-11 | 13F | Seacrest Wealth Management, Llc | 42 741 | 0,14 | 1 025 | 4,28 | ||||
| 2025-07-28 | 13F | Eq Wealth Advisors, Llc | 136 | 0,00 | 3 | 0,00 | ||||
| 2025-08-15 | 13F | Tower Research Capital LLC (TRC) | 5 173 | −72,20 | 124 | −71,03 | ||||
| 2025-05-09 | 13F | Wade Financial Advisory, Inc | 45 843 | −0,68 | 1 055 | −1,77 | ||||
| 2025-07-14 | 13F | S.A. Mason LLC | 6 553 | 0,03 | 157 | 4,67 | ||||
| 2025-07-21 | 13F | Pflug Koory, LLC | 522 | 0,00 | 13 | 0,00 | ||||
| 2025-07-23 | 13F | Nbt Bank N A /ny | 11 955 | 0,00 | 287 | 4,00 | ||||
| 2025-08-13 | 13F | Milestone Investment Advisors LLC | 37 386 | −3,39 | 897 | 0,67 | ||||
| 2025-05-27 | NP | EVCLX - The E-Valuator Conservative (15%-30%) RMS Fund Service Class Shares | 8 877 | −9,43 | 204 | −10,13 | ||||
| 2025-08-14 | 13F | Colony Group, LLC | 8 340 | 200 | ||||||
| 2025-08-14 | 13F | Mariner, LLC | 57 569 | 10,35 | 1 381 | 15,00 | ||||
| 2025-08-15 | 13F | Kestra Advisory Services, LLC | 11 574 | 278 | ||||||
| 2025-07-25 | 13F | JustInvest LLC | 12 786 | 0,00 | 307 | 4,08 | ||||
| 2025-08-01 | 13F | Envestnet Asset Management Inc | 245 556 | 28,77 | 5 888 | 34,21 | ||||
| 2025-07-23 | 13F | Litman Gregory Asset Management LLC | 22 537 | 0,00 | 540 | 4,25 | ||||
| 2025-08-12 | 13F | Jpmorgan Chase & Co | 61 525 | 11,17 | 1 475 | 15,87 | ||||
| 2025-07-29 | 13F | Harbor Asset Planning, Inc. | 6 908 | 166 | ||||||
| 2025-07-31 | 13F | Guardian Financial Partners, LLC | 174 339 | −0,89 | 4 181 | 3,29 | ||||
| 2025-08-14 | 13F | Ameriprise Financial Inc | 262 206 | 6,23 | 6 278 | 10,78 | ||||
| 2025-08-14 | 13F | Jane Street Group, Llc | 12 416 | −75,43 | 298 | −74,44 | ||||
| 2025-08-14 | 13F | Wells Fargo & Company/mn | 1 | 0 | ||||||
| 2025-07-09 | 13F | Channel Wealth Llc | 31 150 | −13,81 | 747 | −10,23 | ||||
| 2025-08-11 | 13F | Hexagon Capital Partners LLC | 0 | −100,00 | 0 | |||||
| 2025-08-08 | 13F | Creative Planning | 43 241 | −13,10 | 1 037 | −9,44 | ||||
| 2025-08-13 | 13F | Cheviot Value Management, LLC | 4 018 | 0,42 | 98 | 8,99 | ||||
| 2025-07-28 | 13F | Frazier Financial Advisors, LLC | 22 | 1 | ||||||
| 2025-08-14 | 13F | Ancora Advisors, LLC | 1 350 | 0,00 | 32 | 3,23 | ||||
| 2025-08-15 | 13F | Cornerstone Financial Group, LLC /NE/ | 48 270 | 0,13 | 1 158 | 3,30 | ||||
| 2025-07-07 | 13F | Versant Capital Management, Inc | 465 | 0,00 | 11 | 10,00 | ||||
| 2025-08-13 | 13F | Northwestern Mutual Wealth Management Co | 9 172 | 33,84 | 220 | 39,49 | ||||
| 2025-08-14 | 13F | CoreCap Advisors, LLC | 1 416 | −40,85 | 34 | −40,00 | ||||
| 2025-08-14 | 13F | Royal Bank Of Canada | 23 933 | 49,05 | 574 | 55,56 | ||||
| 2025-05-15 | 13F | Old Mission Capital Llc | 0 | −100,00 | 0 | |||||
| 2025-07-29 | 13F | Stratos Wealth Partners, LTD. | 10 934 | 0,35 | 262 | 4,80 | ||||
| 2025-07-29 | 13F | Chevy Chase Trust Holdings, Inc. | 13 505 | −17,63 | 324 | −14,32 | ||||
| 2025-08-07 | 13F | 49 Wealth Management, Llc | 8 824 | 0,43 | 212 | 4,46 | ||||
| 2025-08-08 | 13F | Tanglewood Legacy Advisors, LLC | 4 191 | 0,00 | 100 | 4,17 | ||||
| 2025-08-29 | 13F | Total Investment Management Inc | 20 108 | 4,07 | 482 | 8,56 | ||||
| 2025-05-15 | 13F | Baird Financial Group, Inc. | 0 | −100,00 | 0 | |||||
| 2025-07-28 | 13F | Harbour Investments, Inc. | 7 412 | 0,43 | 178 | 4,73 | ||||
| 2025-07-25 | 13F | Cwm, Llc | 0 | −100,00 | 0 | |||||
| 2025-07-15 | 13F | Bfsg, Llc | 0 | −100,00 | 0 | |||||
| 2025-07-21 | 13F | Sage Financial Management Group, Inc. | 10 605 | −39,52 | 0 | |||||
| 2025-08-12 | 13F | CIBC Private Wealth Group, LLC | 1 | 0,00 | 0 | |||||
| 2025-07-29 | 13F | Mezzasalma Advisors, LLC | 144 666 | 1,10 | 3 469 | 5,38 | ||||
| 2025-08-12 | 13F | Coldstream Capital Management Inc | 54 096 | 0,00 | 1 297 | 4,26 | ||||
| 2025-08-11 | 13F | Wealthspire Advisors, LLC | 70 740 | 0,00 | 1 696 | 4,24 | ||||
| 2025-08-12 | 13F | Proequities, Inc. | 0 | 0 | ||||||
| 2025-08-15 | 13F | Morgan Stanley | 381 048 | 5,87 | 9 138 | 10,32 | ||||
| 2025-07-14 | 13F | Sound Stewardship, LLC | 616 513 | 7,76 | 14 784 | 12,30 | ||||
| 2025-07-29 | 13F | Werba Rubin Papier Wealth Management | 16 574 | 0,00 | 397 | 4,20 | ||||
| 2025-08-12 | 13F/A | Cozad Asset Management Inc | 28 993 | −3,15 | 695 | 1,02 | ||||
| 2025-07-15 | 13F | Mather Group, Llc. | 24 600 | 0,00 | 590 | 4,06 | ||||
| 2025-07-31 | 13F | Opes Wealth Management LLC | 701 803 | 10,59 | 16 829 | 15,26 | ||||
| 2025-08-14 | 13F | Citadel Advisors Llc | 31 796 | −43,62 | 762 | −41,25 | ||||
| 2025-08-06 | 13F | SOUTH STATE Corp | 4 031 | 1,31 | 97 | 5,49 | ||||
| 2025-08-08 | 13F | Capital Investment Advisory Services, LLC | 17 549 | 0,00 | 421 | 4,22 | ||||
| 2025-07-22 | 13F | Red Door Wealth Management, LLC | 86 728 | 0,00 | 2 080 | 4,21 | ||||
| 2025-07-30 | 13F | Blume Capital Management, Inc. | 2 000 | 0,00 | 48 | 2,17 | ||||
| 2025-05-27 | NP | EVAGX - The E-Valuator Aggressive Growth (85%-99%) RMS Fund Service Class Shares | 128 673 | −19,47 | 2 961 | −20,34 | ||||
| 2025-08-14 | 13F | Susquehanna International Group, Llp | 0 | −100,00 | 0 | |||||
| 2025-07-21 | 13F | Tower View Investment Management & Research LLC | 2 414 | 0,42 | 58 | 3,64 | ||||
| 2025-08-12 | 13F | Coston, McIsaac & Partners | 561 | 0,00 | 0 | |||||
| 2025-08-06 | 13F | Nicholas Hoffman & Company, LLC. | 49 107 | 0,32 | 1 178 | 4,53 | ||||
| 2025-07-08 | 13F | Lowe Wealth Advisors, LLC | 15 | 0,00 | 0 | |||||
| 2025-07-16 | 13F | Signaturefd, Llc | 2 284 | 1,51 | 55 | 5,88 | ||||
| 2025-08-12 | 13F | Steward Partners Investment Advisory, Llc | 7 125 | 105,45 | 171 | 115,19 | ||||
| 2025-07-23 | 13F | Winthrop Advisory Group LLC | 9 143 | 0,56 | 219 | 4,78 | ||||
| 2025-08-07 | 13F | Allworth Financial LP | 2 935 | 108,01 | 70 | 125,81 | ||||
| 2025-05-13 | 13F | Bank Of Montreal /can/ | 0 | −100,00 | 0 | |||||
| 2025-07-22 | 13F | Yoder Wealth Management, Inc. | 73 067 | −0,20 | 1 752 | 4,04 | ||||
| 2025-08-18 | 13F | Front Row Advisors LLC | 66 | 0,00 | 2 | 0,00 | ||||
| 2025-08-14 | 13F | Bank Of America Corp /de/ | 435 216 | 6,02 | 10 436 | 10,49 | ||||
| 2025-08-13 | 13F | Russell Investments Group, Ltd. | 145 | 3 | ||||||
| 2025-07-10 | 13F | Redhawk Wealth Advisors, Inc. | 34 950 | 0,43 | 838 | 4,75 | ||||
| 2025-07-30 | 13F | Crewe Advisors LLC | 8 843 | 0,00 | 212 | 4,43 | ||||
| 2025-07-08 | 13F | Zrc Wealth Management, Llc | 24 879 | −12,86 | 597 | −9,15 | ||||
| 2025-05-12 | 13F | Sandy Spring Bank | 900 | 0,00 | 21 | 0,00 | ||||
| 2025-08-14 | 13F | Great Valley Advisor Group, Inc. | 0 | −100,00 | 0 | |||||
| 2025-08-07 | 13F | Parkside Financial Bank & Trust | 4 846 | 0,37 | 116 | 4,50 | ||||
| 2025-07-17 | 13F | Sound Income Strategies, LLC | 453 | 11 | ||||||
| 2025-08-06 | 13F | Atlantic Union Bankshares Corp | 900 | 22 | ||||||
| 2025-07-08 | 13F | First National Corp /ma/ /adv | 85 225 | 0,00 | 2 044 | 4,18 | ||||
| 2025-08-12 | 13F | MAI Capital Management | 56 822 | 0,05 | 1 363 | 4,29 | ||||
| 2025-08-15 | 13F | CI Private Wealth, LLC | 140 592 | 185,48 | 3 350 | 216,04 | ||||
| 2025-08-14 | 13F | Modern Wealth Management, LLC | 22 008 | 83,31 | 528 | 90,94 | ||||
| 2025-07-21 | 13F | Ameritas Advisory Services, LLC | 1 137 | 27 | ||||||
| 2025-08-08 | 13F | Avantax Advisory Services, Inc. | 13 114 | −36,51 | 314 | −33,89 | ||||
| 2025-07-14 | 13F | Leonard Rickey Investment Advisors P.L.L.C. | 179 405 | −1,91 | 4 302 | 8,06 | ||||
| 2025-07-23 | 13F | Bellevue Asset Management, Llc | 28 555 | 0,00 | 685 | 4,11 | ||||
| 2025-07-31 | 13F | CVA Family Office, LLC | 126 680 | −1,80 | 3 038 | 2,32 | ||||
| 2025-07-31 | 13F | Carnegie Capital Asset Management, LLC | 14 823 | 0,00 | 355 | 16,01 | ||||
| 2025-08-04 | 13F | Creative Financial Designs Inc /adv | 231 | 0,00 | 6 | 0,00 | ||||
| 2025-05-27 | NP | EVMLX - The E-Valuator Moderate (50%-70%) RMS Fund Service Class Shares | 85 101 | 8,62 | 1 958 | 7,46 | ||||
| 2025-07-22 | 13F | Clarius Group, LLC | 89 484 | 0,00 | 2 146 | 4,18 | ||||
| 2025-08-14 | 13F | Fmr Llc | 8 427 | −0,46 | 202 | 4,12 | ||||
| 2025-04-23 | 13F | Mascagni Wealth Management, Inc. | 0 | −100,00 | 0 | −100,00 | ||||
| 2025-07-31 | 13F | Resonant Capital Advisors, LLC | 98 247 | 11,03 | 2 356 | 15,67 | ||||
| 2025-05-27 | NP | EVTTX - The E-Valuator Conservative/Moderate (30%-50%) RMS Fund Service Class Shares | 11 304 | 16,86 | 260 | 16,07 | ||||
| 2025-08-12 | 13F | Sfmg, Llc | 27 996 | 0,00 | 671 | 4,19 | ||||
| 2025-07-31 | 13F | Glass Jacobson Investment Advisors llc | 24 119 | 22,54 | 578 | 26,48 | ||||
| 2025-08-14 | 13F | Comerica Bank | 170 | 0,00 | 4 | 33,33 | ||||
| 2025-07-21 | 13F | Ameriflex Group, Inc. | 168 | 0,00 | 4 | 0,00 | ||||
| 2025-07-15 | 13F | Main Street Group, LTD | 0 | −100,00 | 0 | |||||
| 2025-08-12 | 13F | LPL Financial LLC | 105 719 | −15,86 | 2 535 | −12,31 | ||||
| 2025-08-11 | 13F | HighTower Advisors, LLC | 695 144 | 3,29 | 16 670 | 7,65 | ||||
| 2025-08-14 | 13F | Stifel Financial Corp | 15 854 | 8,67 | 380 | 13,43 | ||||
| 2025-07-17 | 13F | HB Wealth Management, LLC | 37 863 | 0,00 | 908 | 4,13 | ||||
| 2025-07-10 | 13F | Wealth Enhancement Advisory Services, Llc | 44 412 | 1 087 | ||||||
| 2025-07-11 | 13F | Farther Finance Advisors, LLC | 12 603 | 0,00 | 302 | 4,14 | ||||
| 2025-07-18 | 13F | Financial Consulate, Inc | 1 422 825 | −13,08 | 34 119 | −9,42 | ||||
| 2025-08-15 | 13F | Koesten, Hirschmann & Crabtree, INC. | 7 530 | 0,00 | 181 | 4,05 |