Grundläggande statistik
| Institutionella ägare | 259 total, 258 long only, 0 short only, 1 long/short - change of −41,44% MRQ |
| Genomsnittlig portföljallokering | 0.2670 % - change of −50,36% MRQ |
| Institutionella aktier (lång) | 13 004 519 (ex 13D/G) - change of −0,10MM shares −0,75% MRQ |
| Institutionellt värde (lång) | $ 894 292 USD ($1000) |
Institutionellt ägande och aktieägare
Fidelity Covington Trust - Fidelity MSCI Financials Index ETF (US:FNCL) har 259 Institutionella ägare och aktieägare som har lämnat in 13D/G- eller 13F-formulär till Securities Exchange Commission (SEC). Dessa institut innehar totalt 13,004,519 aktier. Största aktieägare inkluderar Lido Advisors, LLC, Charles Schwab Investment Management Inc, Northern Lights Fund Trust - PFG Fidelity Institutional AM® Equity Sector Strategy Fund Class R Shares, Commonwealth Equity Services, Llc, Agf Management Ltd, Morgan Stanley, Congress Wealth Management LLC / DE /, Vicus Capital, LPL Financial LLC, and Full Sail Capital, LLC .
Fidelity Covington Trust - Fidelity MSCI Financials Index ETF (ARCA:FNCL) Institutionell ägarstruktur visar institutioners och fonders nuvarande positioner i företaget, samt de senaste förändringarna i positionernas storlek. Större aktieägare kan vara enskilda investerare, fonder, hedgefonder eller institutioner. Bilaga 13D visar att investeraren äger (eller ägde) mer än 5% av företaget och avser (eller avsåg) att aktivt eftersträva en förändring av affärsstrategin. Schedule 13G indikerar en passiv investering på över 5%.
The share price as of September 9, 2025 is 76,00 / share. Previously, on September 10, 2024, the share price was 62,34 / share. This represents an increase of 21,91% over that period.

Fondsentimentets poäng
Fondsentimentet poängen(fka Ägarackumulation-poäng) visar vilka aktier som är mest köpta av fonder. Det är resultatet av en sofistikerad kvantitativ flerfaktormodell som identifierar företag med de högsta nivåerna av institutionell ackumulering. Poängsättningsmodellen använder en kombination av den totala ökningen av redovisade ägare, förändringarna i portföljallokeringarna för dessa ägare och andra mått. Siffran sträcker sig från 0 till 100, där högre siffror indikerar en högre nivå av ackumulering i förhållande till sina konkurrenter, och 50 är genomsnittet.
Uppdateringsfrekvens: Dagligen
Se Ownership Explorer, som innehåller en lista över de högst rankade företagen.
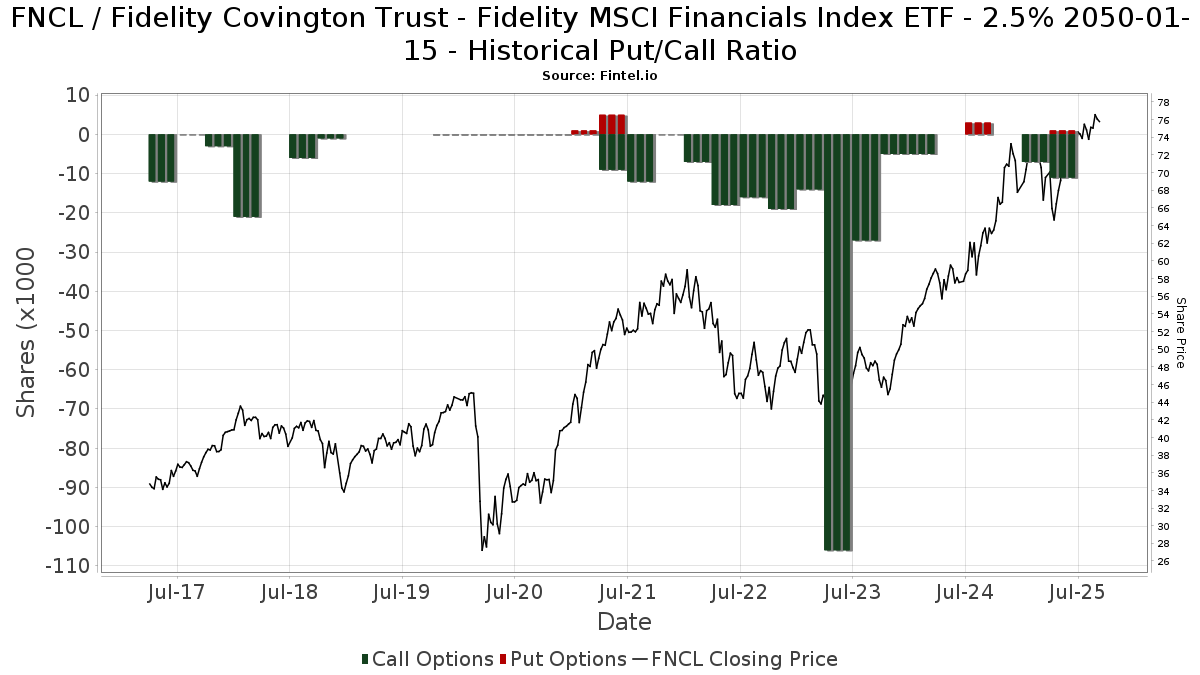
Institutionell sälj/köp-kvot
Förutom att rapportera vanliga eget kapital- och skuldemissioner måste institutioner med mer än 100MM tillgångar under förvaltning också avslöja sina innehav av sälj- och köpoptioner. Eftersom säljoptioner i allmänhet indikerar ett negativt sentiment och köpoptioner indikerar ett positivt sentiment, kan vi få en uppfattning om det övergripande institutionella sentimentet genom att plotta förhållandet mellan säljoptioner och köpoptioner. Diagrammet till höger visar det historiska förhållandet mellan sälj- och köpoptioner för detta instrument.
Genom att använda sälj/köp-kvoten som en indikator på aktieägarnas sentiment undviker man en av de största bristerna med att använda det totala institutionella ägandet, nämligen att en betydande del av de förvaltade tillgångarna investeras passivt för att följa index. Passivt förvaltade fonder köper vanligtvis inte optioner, så indikatorn för sälj/köp-kvoten ger en bättre bild av stämningen i aktivt förvaltade fonder.
13F- och NPORT-arkiveringar
Detaljer om 13F-arkiveringar är gratis. Detaljer om NP-arkiveringar kräver ett premiummedlemskap. Gröna rader indikerar nya positioner. Röda rader indikerar stängda positioner. Klicka på länk symbolen för att se hela transaktionshistoriken.
Uppgradera
för att låsa upp premiumdata och exportera till Excel ![]() .
.
| Fil Datum | Källa | Investerare | Typ | Genomsnittligt pris (beräknat) |
Aktier | Δ Aktier (%) |
Rapporterat värde (1000 USD) |
Δ Värde (%) |
Portföljallokering (%) |
|
|---|---|---|---|---|---|---|---|---|---|---|
| 2025-08-14 | 13F | Paragon Private Wealth Management, LLC | 6 955 | 12,63 | 515 | 19,81 | ||||
| 2025-07-17 | 13F | Janney Montgomery Scott LLC | 6 432 | 2,57 | 0 | |||||
| 2025-08-14 | 13F | Full Sail Capital, LLC | 244 575 | −1,36 | 18 108 | 5,06 | ||||
| 2025-07-21 | 13F | Ameritas Advisory Services, LLC | 23 511 | −22,36 | 1 741 | −16,51 | ||||
| 2025-07-23 | 13F | Prasad Wealth Partners, LLC | 3 475 | 0,00 | 257 | 6,64 | ||||
| 2025-08-01 | 13F | Purkiss Capital Advisors LLC | 2 860 | −2,56 | 212 | 3,43 | ||||
| 2025-08-29 | 13F | Centaurus Financial, Inc. | 8 082 | −4,98 | 1 | |||||
| 2025-05-16 | 13F | Arete Wealth Advisors, LLC | 0 | −100,00 | 0 | |||||
| 2025-08-12 | 13F | Personal Cfo Solutions, Llc | 119 296 | 7,37 | 8 833 | 14,36 | ||||
| 2025-08-12 | 13F | Mcdonald Partners Llc | 6 500 | −16,67 | 481 | −11,25 | ||||
| 2025-04-22 | 13F | Rappaport Reiches Capital Management, LLC | 14 190 | 0,42 | 987 | 1,65 | ||||
| 2025-08-13 | 13F | Rsm Us Wealth Management Llc | 3 006 | 0,33 | 223 | 6,73 | ||||
| 2025-08-07 | 13F | Nwam Llc | 2 967 | −23,09 | 222 | −17,16 | ||||
| 2025-08-01 | 13F | Bessemer Group Inc | 0 | −100,00 | 0 | |||||
| 2025-08-04 | 13F | Creative Financial Designs Inc /adv | 460 | 0,00 | 34 | 9,68 | ||||
| 2025-08-08 | 13F | Capital Investment Advisory Services, LLC | 400 | 0,00 | 30 | 7,41 | ||||
| 2025-04-28 | 13F | Mainstream Capital Management LLC | 0 | −100,00 | 0 | |||||
| 2025-08-11 | 13F | Rothschild Investment Llc | 29 | 0,00 | 2 | 0,00 | ||||
| 2025-08-12 | 13F | SRS Capital Advisors, Inc. | 56 | 0,00 | 43 | 1 300,00 | ||||
| 2025-08-14 | 13F | Stifel Financial Corp | 118 899 | −4,04 | 8 803 | 2,21 | ||||
| 2025-04-24 | 13F | CNB Bank | 0 | −100,00 | 0 | |||||
| 2025-08-07 | 13F | Kestra Private Wealth Services, Llc | 37 129 | 6,17 | 2 749 | 13,08 | ||||
| 2025-07-17 | 13F | Montis Financial, LLC | 9 708 | −18,77 | 719 | −13,49 | ||||
| 2025-08-14 | 13F | Snowden Capital Advisors LLC | 28 063 | −0,94 | 2 078 | 5,49 | ||||
| 2025-05-22 | NP | MXFDX - Great-West Core Bond Fund Investor Class | 0 | −100,00 | 0 | −100,00 | ||||
| 2025-04-23 | 13F | Mascagni Wealth Management, Inc. | 0 | −100,00 | 0 | −100,00 | ||||
| 2025-08-01 | 13F | Envestnet Asset Management Inc | 94 086 | 44,27 | 6 966 | 53,67 | ||||
| 2025-08-06 | 13F | Wedbush Securities Inc | 6 782 | 46,48 | 1 | |||||
| 2025-07-15 | 13F | Fifth Third Bancorp | 474 | 0,00 | 35 | 9,38 | ||||
| 2025-05-22 | NP | MXGBX - Great-West Global Bond Fund Investor Class | 0 | −100,00 | 0 | −100,00 | ||||
| 2025-08-12 | 13F | Charles Schwab Investment Management Inc | 1 820 635 | −1,85 | 134 800 | 4,53 | ||||
| 2025-05-14 | 13F | PKS Advisory Services, LLC | 0 | −100,00 | 0 | |||||
| 2025-05-09 | 13F | Pathway Financial Advisers, LLC | 0 | −100,00 | 0 | |||||
| 2025-07-16 | 13F | Dakota Wealth Management | 3 000 | 0,00 | 222 | 6,73 | ||||
| 2025-08-14 | 13F | Susquehanna International Group, Llp | Call | 9 500 | 35,71 | 703 | 44,65 | |||
| 2025-05-12 | 13F | Founders Financial Securities Llc | 0 | −100,00 | 0 | |||||
| 2025-07-16 | 13F | West Branch Capital LLC | 1 425 | −6,56 | 106 | −0,94 | ||||
| 2025-08-15 | 13F | Captrust Financial Advisors | 2 866 | 212 | ||||||
| 2025-08-13 | 13F | Cresset Asset Management, LLC | 3 890 | −4,98 | 288 | 1,41 | ||||
| 2025-08-14 | 13F | Fmr Llc | 71 164 | −1,59 | 5 269 | 4,81 | ||||
| 2025-08-05 | 13F | Smith Shellnut Wilson Llc /adv | 30 894 | −5,12 | 2 287 | 1,06 | ||||
| 2025-08-12 | 13F | Atlas Capital Advisors Llc | 15 731 | 0,00 | 1 165 | 6,50 | ||||
| 2025-08-14 | 13F | Quantinno Capital Management LP | 18 459 | 14,95 | 1 367 | 22,40 | ||||
| 2025-07-14 | 13F | AdvisorNet Financial, Inc | 44 | −88,83 | 3 | −88,89 | ||||
| 2025-07-17 | 13F | Wolff Wiese Magana Llc | 39 | 0,00 | 3 | 0,00 | ||||
| 2025-08-12 | 13F | Franklin Resources Inc | 1 000 | −69,75 | 74 | −67,69 | ||||
| 2025-07-29 | 13F | Signature Estate & Investment Advisors Llc | 2 716 | −11,73 | 201 | −5,63 | ||||
| 2025-07-16 | 13F | Fischer Financial Services, Inc. | 148 236 | −2,07 | 10 974 | 4,29 | ||||
| 2025-07-29 | 13F | Koshinski Asset Management, Inc. | 3 462 | −9,18 | 256 | −3,03 | ||||
| 2025-08-07 | 13F | Allworth Financial LP | 47 | −67,36 | 3 | −66,67 | ||||
| 2025-08-12 | 13F | Tableaux Llc | 17 756 | 1 002 | ||||||
| 2025-04-28 | 13F | Strategic Financial Concepts, LLC | 0 | −100,00 | 0 | −100,00 | ||||
| 2025-08-12 | 13F | Proequities, Inc. | 0 | 0 | ||||||
| 2025-07-22 | 13F | Valley National Advisers Inc | 2 267 | 0,00 | 0 | |||||
| 2025-07-18 | 13F | Founders Capital Management | 7 | 0,00 | 0 | |||||
| 2025-08-05 | 13F | Sigma Planning Corp | 20 767 | −9,86 | 1 538 | −4,00 | ||||
| 2025-07-24 | 13F | Galvin, Gaustad & Stein, LLC | 8 801 | −14,14 | 652 | −8,57 | ||||
| 2025-07-23 | 13F | Pillar Financial Advisors, LLC | 51 | 0,00 | 4 | 0,00 | ||||
| 2025-07-16 | 13F | Brown, Lisle/cummings, Inc. | 41 | 0,00 | 3 | 50,00 | ||||
| 2025-07-29 | 13F | Stratos Wealth Advisors, LLC | 3 868 | 0,03 | 286 | 6,72 | ||||
| 2025-08-06 | 13F | Aspetuck Financial Management LLC | 21 482 | −1,81 | 1 591 | 4,61 | ||||
| 2025-07-02 | 13F | Central Pacific Bank - Trust Division | 29 | 0,00 | 2 | 0,00 | ||||
| 2025-05-15 | 13F/A | Orion Portfolio Solutions, LLC | 41 943 | 6,45 | 2 916 | 7,72 | ||||
| 2025-08-01 | 13F | Belvedere Trading LLC | Call | 1 800 | 133 | |||||
| 2025-08-01 | 13F | Belvedere Trading LLC | Put | 1 100 | 81 | |||||
| 2025-07-30 | 13F | Financial Perspectives, Inc | 501 | 0,20 | 37 | 8,82 | ||||
| 2025-08-08 | 13F | Pnc Financial Services Group, Inc. | 1 223 | 0,00 | 91 | 5,88 | ||||
| 2025-07-24 | 13F | Robertson Stephens Wealth Management, LLC | 24 640 | −5,36 | 1 824 | 0,83 | ||||
| 2025-08-13 | 13F | Financial Freedom, LLC | 7 261 | 0,28 | 538 | 6,76 | ||||
| 2025-08-14 | 13F | Sunbelt Securities, Inc. | 10 803 | −1,62 | 742 | −2,88 | ||||
| 2025-08-06 | 13F | First Horizon Advisors, Inc. | 618 | 0,00 | 46 | 7,14 | ||||
| 2025-05-05 | 13F | Lindbrook Capital, Llc | 3 | 0,00 | 0 | |||||
| 2025-08-15 | 13F | Kestra Advisory Services, LLC | 137 110 | 7,49 | 10 152 | 14,48 | ||||
| 2025-08-14 | 13F | GWM Advisors LLC | 12 793 | −19,57 | 947 | −14,30 | ||||
| 2025-08-07 | 13F | Panoramic Investment Advisors, Llc | 3 900 | −4,29 | 289 | 1,77 | ||||
| 2025-05-15 | 13F | Minot DeBlois Advisors LLC | 0 | −100,00 | 0 | |||||
| 2025-07-29 | 13F | AssuredPartners Investment Advisors, LLC | 9 519 | −6,52 | 705 | −0,42 | ||||
| 2025-07-17 | 13F | CWA Asset Management Group, LLC | 3 405 | 0,00 | 252 | 6,78 | ||||
| 2025-08-12 | 13F | Steward Partners Investment Advisory, Llc | 56 819 | 3 394,40 | 4 207 | 3 622,12 | ||||
| 2025-08-04 | 13F | Pensionmark Financial Group, Llc | 9 636 | 5,46 | 713 | 12,28 | ||||
| 2025-08-12 | 13F | Jpmorgan Chase & Co | 146 906 | −0,06 | 10 877 | 6,43 | ||||
| 2025-07-22 | 13F | Yoder Wealth Management, Inc. | 63 159 | 1,48 | 4 676 | 8,09 | ||||
| 2025-08-01 | 13F | Belvedere Trading LLC | 459 | 34 | ||||||
| 2025-08-14 | 13F | EP Wealth Advisors, Inc. | 32 802 | −1,57 | 2 429 | 4,84 | ||||
| 2025-07-31 | 13F | Moser Wealth Advisors, LLC | 75 | 6 | ||||||
| 2025-08-13 | 13F | KDK Private Wealth Management, LLC | 26 103 | −2,27 | 1 933 | 4,21 | ||||
| 2025-07-16 | 13F | PFS Partners, LLC | 39 | 0,00 | 3 | 0,00 | ||||
| 2025-08-14 | 13F | Transamerica Financial Advisors, Inc. | 26 | −38,10 | 2 | |||||
| 2025-07-16 | 13F | Signature Resources Capital Management, LLC | 889 | 66 | ||||||
| 2025-07-18 | 13F | Bartlett & Co. Wealth Management Llc | 17 | 0,00 | 1 | 0,00 | ||||
| 2025-08-13 | 13F | Fisher Asset Management, LLC | 14 705 | 52,51 | 1 089 | 62,39 | ||||
| 2025-08-18 | 13F | Geneos Wealth Management Inc. | 626 | −4,43 | 46 | 2,22 | ||||
| 2025-07-30 | 13F | Gables Capital Management Inc. | 283 | 0,00 | 21 | 5,26 | ||||
| 2025-08-11 | 13F | FSA Wealth Management LLC | 543 | 0,37 | 40 | 8,11 | ||||
| 2025-08-13 | 13F | River Wealth Advisors LLC | 4 546 | −1,11 | 337 | 5,33 | ||||
| 2025-07-28 | 13F | Variant Private Wealth, LLC | 7 751 | 0,35 | 574 | 6,90 | ||||
| 2025-08-15 | 13F | Tower Research Capital LLC (TRC) | 2 855 | −59,21 | 211 | −56,58 | ||||
| 2025-08-07 | 13F | PFG Advisors | 0 | −100,00 | 0 | |||||
| 2025-08-06 | 13F | Agf Management Ltd | 579 183 | −30,13 | 42 883 | −25,59 | ||||
| 2025-08-08 | 13F | Cetera Investment Advisers | 23 901 | 2,50 | 1 770 | 9,13 | ||||
| 2025-08-04 | 13F | Bay Colony Advisory Group, Inc d/b/a Bay Colony Advisors | 9 694 | −11,73 | 718 | −4,91 | ||||
| 2025-08-05 | 13F | Advisors Preferred, LLC | 0 | −100,00 | 0 | |||||
| 2025-08-08 | 13F | Meridian Wealth Management, LLC | 16 554 | 0,59 | 1 226 | 7,08 | ||||
| 2025-07-28 | 13F | Mutual Advisors, LLC | 5 588 | −1,88 | 424 | 11,02 | ||||
| 2025-08-11 | 13F | Western Wealth Management, LLC | 12 362 | 0,02 | 915 | 6,52 | ||||
| 2025-08-13 | 13F | Jones Financial Companies Lllp | 12 843 | 47,86 | 942 | 58,05 | ||||
| 2025-08-12 | 13F | O'shaughnessy Asset Management, Llc | 37 160 | 12,87 | 2 751 | 20,24 | ||||
| 2025-08-11 | 13F | Brown Brothers Harriman & Co | 2 467 | 406,57 | 183 | 451,52 | ||||
| 2025-08-12 | 13F | Howe & Rusling Inc | 797 | 59 | ||||||
| 2025-08-14 | 13F | Glenmede Investment Management, LP | 49 | 4 | ||||||
| 2025-07-31 | 13F | Cambridge Investment Research Advisors, Inc. | 50 949 | 3,62 | 4 | 0,00 | ||||
| 2025-08-14 | 13F | Blue Capital, Inc. | 14 392 | 70,32 | 1 066 | 83,62 | ||||
| 2025-08-08 | 13F | Crossmark Global Holdings, Inc. | 13 125 | −4,95 | 972 | 1,25 | ||||
| 2025-08-08 | 13F | Larson Financial Group LLC | 40 | 0,00 | 3 | 0,00 | ||||
| 2025-08-18 | 13F | Wolverine Trading, Llc | 0 | −100,00 | 0 | |||||
| 2025-07-30 | 13F | Wbh Advisory Inc | 6 760 | 28,40 | 501 | 36,61 | ||||
| 2025-04-22 | 13F | Center for Financial Planning, Inc. | 0 | −100,00 | 0 | |||||
| 2025-07-16 | 13F/A | CX Institutional | 1 478 | 283,90 | 0 | |||||
| 2025-07-02 | 13F | HBW Advisory Services LLC | 3 996 | −46,09 | 296 | −42,72 | ||||
| 2025-07-30 | 13F | Retirement Planning Group | 18 033 | 12,14 | 1 335 | 19,52 | ||||
| 2025-07-17 | 13F | Keystone Global Partners, LLC | 0 | −100,00 | 0 | |||||
| 2025-07-31 | 13F | BIP Wealth, LLC | 3 112 | 0,39 | 230 | 6,98 | ||||
| 2025-08-12 | 13F | Global Retirement Partners, LLC | 4 052 | 1,22 | 300 | 9,49 | ||||
| 2025-04-29 | 13F | Element Wealth, LLC | 0 | −100,00 | 0 | |||||
| 2025-08-14 | 13F | UBS Group AG | 29 468 | 4,97 | 2 182 | 11,79 | ||||
| 2025-05-29 | NP | Six Circles Trust - Six Circles Multi-Strategy Fund | 0 | −100,00 | 0 | −100,00 | ||||
| 2025-08-04 | 13F | Spire Wealth Management | 100 | −75,00 | 7 | −74,07 | ||||
| 2025-08-12 | 13F | AlphaCore Capital LLC | 48 | 4 | ||||||
| 2025-05-13 | 13F | Measured Risk Portfolios, Inc. | 0 | −100,00 | 0 | |||||
| 2025-05-29 | NP | Six Circles Trust - Six Circles Global Bond Fund | 0 | −100,00 | 0 | −100,00 | ||||
| 2025-07-21 | 13F | Patriot Financial Group Insurance Agency, LLC | 33 181 | 2,07 | 2 457 | 8,67 | ||||
| 2025-07-30 | 13F | Bogart Wealth, LLC | 1 544 | 0,00 | 114 | 6,54 | ||||
| 2025-08-19 | 13F | Cape Investment Advisory, Inc. | 28 | 3,70 | 2 | 100,00 | ||||
| 2025-07-30 | 13F | Pacific Sun Financial Corp | 8 287 | 3,93 | 614 | 10,65 | ||||
| 2025-07-21 | 13F | Pflug Koory, LLC | 25 | 0,00 | 2 | 0,00 | ||||
| 2025-08-06 | 13F | Legacy Wealth Managment, LLC/ID | 0 | −100,00 | 0 | |||||
| 2025-08-14 | 13F | CoreCap Advisors, LLC | 35 | −48,53 | 3 | −50,00 | ||||
| 2025-07-28 | 13F | Harbour Investments, Inc. | 1 804 | 3,32 | 134 | 9,92 | ||||
| 2025-08-14 | 13F | Mpwm Advisory Solutions, Llc | 1 212 | 203,00 | 90 | 229,63 | ||||
| 2025-08-05 | 13F | Beckerman Institutional, LLC | 5 673 | −0,35 | 0 | |||||
| 2025-08-14 | 13F | Kovitz Investment Group Partners, LLC | 215 753 | 141,10 | 15 974 | 156,78 | ||||
| 2025-08-14 | 13F | Great Valley Advisor Group, Inc. | 17 752 | −10,35 | 1 314 | −4,51 | ||||
| 2025-08-12 | 13F | CIBC Private Wealth Group, LLC | 85 | 0,00 | 6 | 20,00 | ||||
| 2025-04-29 | 13F | Lee Danner & Bass Inc | 0 | −100,00 | 0 | |||||
| 2025-08-19 | 13F | Advisory Services Network, LLC | 8 061 | −88,29 | 599 | −87,51 | ||||
| 2025-08-14 | 13F | Citadel Advisors Llc | 3 962 | −80,11 | 293 | −78,84 | ||||
| 2025-08-11 | 13F | TD Waterhouse Canada Inc. | 1 000 | 0,00 | 75 | 7,25 | ||||
| 2025-08-14 | 13F | Wells Fargo & Company/mn | 161 219 | −11,28 | 11 937 | −5,51 | ||||
| 2025-07-29 | 13F | TFC Financial Management | 1 004 | 0,00 | 74 | 7,25 | ||||
| 2025-08-14 | 13F | Raymond James Financial Inc | 18 810 | −2,34 | 1 393 | 4,04 | ||||
| 2025-07-17 | 13F | Smith Chas P & Associates Pa Cpas | 3 994 | 0,00 | 296 | 6,50 | ||||
| 2025-07-24 | 13F | IFP Advisors, Inc | 6 071 | −20,52 | 450 | −15,44 | ||||
| 2025-08-11 | 13F | Beaumont Capital Management, LLC | 83 159 | 6 157 | ||||||
| 2025-07-15 | 13F | Mather Group, Llc. | 0 | −100,00 | 0 | |||||
| 2025-08-04 | 13F | Amplius Wealth Advisors, LLC | 3 002 | 0,87 | 222 | 7,77 | ||||
| 2025-08-14 | 13F | Boston Private Wealth Llc | 3 762 | 279 | ||||||
| 2025-07-31 | 13F | Briaud Financial Planning, Inc | 346 | 0 | ||||||
| 2025-08-06 | 13F | Prospera Financial Services Inc | 3 137 | −8,70 | 233 | −2,93 | ||||
| 2025-07-15 | 13F | Aspire Capital Advisors LLC | 27 216 | −44,14 | 2 015 | −40,49 | ||||
| 2025-07-18 | 13F | Truist Financial Corp | 10 592 | 5,06 | 784 | 12,00 | ||||
| 2025-09-04 | 13F/A | Advisor Group Holdings, Inc. | 115 966 | 0,09 | 8 605 | 6,60 | ||||
| 2025-08-05 | 13F | Lifeworks Advisors, LLC | 3 913 | 2,81 | 290 | 9,47 | ||||
| 2025-08-26 | 13F/A | Thrivent Financial For Lutherans | 78 514 | 6,22 | 6 | 0,00 | ||||
| 2025-07-22 | 13F | D.B. Root & Company, LLC | 4 850 | −5,25 | 359 | 1,13 | ||||
| 2025-07-28 | 13F | Rosenberg Matthew Hamilton | 2 928 | 0,00 | 217 | 6,40 | ||||
| 2025-07-09 | 13F | Procyon Private Wealth Partners, LLC | 114 516 | 52,56 | 8 479 | 62,48 | ||||
| 2025-07-25 | 13F | Atria Wealth Solutions, Inc. | 25 514 | −40,71 | 1 924 | −35,67 | ||||
| 2025-05-08 | NP | QALTX - Quantified Alternative Investment Fund Investor Class Shares | 2 423 | 498,27 | 168 | 700,00 | ||||
| 2025-07-15 | 13F | Main Street Group, LTD | 100 | 0,00 | 7 | 16,67 | ||||
| 2025-07-23 | 13F | Monte Financial Group, LLC | 4 241 | 6,16 | 314 | 21,24 | ||||
| 2025-07-24 | 13F | Blair William & Co/il | 752 | 0,00 | 56 | 5,77 | ||||
| 2025-06-30 | NP | Northern Lights Fund Trust - PFG Fidelity Institutional AM® Equity Sector Strategy Fund Class R Shares | 1 369 787 | 21,73 | 93 091 | 13,10 | ||||
| 2025-07-14 | 13F | Buska Wealth Management, LLC | 68 815 | 114,74 | 5 095 | 128,78 | ||||
| 2025-08-05 | 13F | Mission Wealth Management, Lp | 5 496 | 0,27 | 407 | 6,56 | ||||
| 2025-07-24 | 13F | Court Place Advisors, LLC | 8 340 | −2,19 | 617 | 4,22 | ||||
| 2025-08-05 | 13F | Bank of New York Mellon Corp | 8 001 | −4,64 | 592 | 1,54 | ||||
| 2025-08-11 | 13F | Aptus Capital Advisors, LLC | 417 | 0,24 | 31 | 7,14 | ||||
| 2025-07-29 | 13F | Harbor Asset Planning, Inc. | 28 348 | 2 099 | ||||||
| 2025-07-07 | 13F | Nova Wealth Management, Inc. | 13 362 | 20,55 | 989 | 28,44 | ||||
| 2025-07-25 | 13F | Strategic Point Investment Advisors, LLC | 205 883 | 0,77 | 15 244 | 7,32 | ||||
| 2025-07-22 | 13F | Merit Financial Group, LLC | 10 494 | −6,87 | 777 | −0,77 | ||||
| 2025-07-25 | 13F | Valley Brook Capital Group, Inc. | 4 470 | 1,15 | 331 | 7,49 | ||||
| 2025-07-30 | NP | QVOY - Q3 All-Season Active Rotation ETF | 0 | −100,00 | 0 | −100,00 | ||||
| 2025-07-11 | 13F | Farther Finance Advisors, LLC | 848 | −70,69 | 63 | −69,00 | ||||
| 2025-08-13 | 13F | Summit Financial, LLC | 12 816 | −7,99 | 949 | −2,07 | ||||
| 2025-08-08 | 13F | Avantax Advisory Services, Inc. | 3 237 | −13,33 | 240 | −7,72 | ||||
| 2025-08-14 | 13F | Mml Investors Services, Llc | 13 111 | −74,17 | 1 | −100,00 | ||||
| 2025-07-15 | 13F | Lynch & Associates/in | 34 820 | 3,58 | 2 578 | 10,31 | ||||
| 2025-08-14 | 13F | Atomi Financial Group, Inc. | 3 224 | 10,90 | 239 | 17,82 | ||||
| 2025-07-31 | 13F | CVA Family Office, LLC | 325 | 0,00 | 24 | 9,09 | ||||
| 2025-08-27 | 13F/A | Brinker Capital Investments, LLC | 39 904 | −4,86 | 2 954 | 1,34 | ||||
| 2025-07-31 | 13F | Sage Mountain Advisors LLC | 1 686 | 0,00 | 125 | 5,98 | ||||
| 2025-05-16 | 13F | Empowered Funds, LLC | 0 | −100,00 | 0 | |||||
| 2025-08-14 | 13F | Old Mission Capital Llc | 4 693 | 347 | ||||||
| 2025-07-09 | 13F | Bank of New Hampshire | 169 | 0,00 | 13 | 9,09 | ||||
| 2025-08-14 | 13F | Qube Research & Technologies Ltd | 1 801 | 14,13 | 133 | 22,02 | ||||
| 2025-04-23 | 13F | PMV Capital Advisers, LLC | 0 | −100,00 | 0 | |||||
| 2025-07-24 | 13F | Us Bancorp \de\ | 1 225 | −63,33 | 91 | −61,21 | ||||
| 2025-07-15 | 13F | Am Investment Strategies Llc | 3 575 | 0,22 | 0 | |||||
| 2025-08-06 | 13F | AE Wealth Management LLC | 92 730 | 6,50 | 6 866 | 13,41 | ||||
| 2025-04-30 | 13F | Round Rock Advisors, LLC | 0 | −100,00 | 0 | |||||
| 2025-07-31 | 13F | United Community Bank | 582 | 0,00 | 43 | 7,50 | ||||
| 2025-07-28 | 13F | Axxcess Wealth Management, Llc | 12 180 | 127,71 | 902 | 142,86 | ||||
| 2025-08-05 | 13F | EPG Wealth Management LLC | 733 | 0,14 | 54 | 8,00 | ||||
| 2025-08-12 | 13F | MAI Capital Management | 1 675 | 0,00 | 124 | 6,90 | ||||
| 2025-08-14 | 13F | Bank Of America Corp /de/ | 102 212 | 17,38 | 7 568 | 25,01 | ||||
| 2025-08-01 | 13F | SYM FINANCIAL Corp | 700 | 52 | ||||||
| 2025-08-06 | 13F | Golden State Wealth Management, LLC | 0 | −100,00 | 0 | |||||
| 2025-08-11 | 13F | HighTower Advisors, LLC | 85 592 | −3,77 | 6 337 | 2,49 | ||||
| 2025-07-08 | 13F | Webster Bank, N. A. | 0 | −100,00 | 0 | |||||
| 2025-07-10 | 13F | Wealth Enhancement Advisory Services, Llc | 10 662 | 5,23 | 804 | 14,20 | ||||
| 2025-07-24 | 13F | Williams & Novak, LLC | 3 325 | −18,20 | 246 | −12,46 | ||||
| 2025-08-04 | 13F | Savvy Advisors, Inc. | 3 098 | −2,94 | 229 | 3,62 | ||||
| 2025-08-12 | 13F | J.w. Cole Advisors, Inc. | 6 404 | 474 | ||||||
| 2025-08-07 | 13F | Traynor Capital Management, Inc. | 13 646 | 0,69 | 1 017 | 7,86 | ||||
| 2025-08-14 | 13F | Florida Financial Advisors, Llc | 0 | −100,00 | 0 | |||||
| 2025-08-14 | 13F | Modern Wealth Management, LLC | 137 539 | 139,89 | 10 183 | 155,53 | ||||
| 2025-07-16 | 13F | Essex Financial Services, Inc. | 7 218 | −5,67 | 534 | 0,56 | ||||
| 2025-08-11 | 13F | Private Advisor Group, LLC | 15 133 | −49,24 | 1 120 | −45,95 | ||||
| 2025-08-25 | 13F/A | Promus Capital, LLC | 210 | 0,00 | 16 | 7,14 | ||||
| 2025-08-05 | 13F | Benchmark Financial Wealth Advisors, LLC | 8 756 | 648 | ||||||
| 2025-07-15 | 13F | Cranbrook Wealth Management, LLC | 0 | −100,00 | 0 | |||||
| 2025-08-04 | 13F | Assetmark, Inc | 448 | −23,42 | 33 | −17,50 | ||||
| 2025-08-06 | 13F | Rialto Wealth Management, LLC | 4 377 | 0,00 | 324 | 6,58 | ||||
| 2025-07-25 | 13F | G2 Capital Management, Llc / Oh | 12 479 | 0,00 | 924 | 6,46 | ||||
| 2025-07-29 | 13F | Spirit Of America Management Corp/ny | 2 433 | −11,59 | 181 | −5,24 | ||||
| 2025-08-06 | 13F | Decker Retirement Planning Inc. | 423 | 0,00 | 31 | 6,90 | ||||
| 2025-08-08 | 13F | Creative Planning | 13 595 | 6,17 | 1 007 | 13,03 | ||||
| 2025-07-16 | 13F | Beaumont Financial Advisors, LLC | 0 | −100,00 | 0 | |||||
| 2025-08-13 | 13F | Renaissance Technologies Llc | 0 | −100,00 | 0 | |||||
| 2025-08-14 | 13F | Glen Eagle Advisors, LLC | 510 | 0,00 | 38 | 5,71 | ||||
| 2025-08-07 | 13F | BOK Financial Private Wealth, Inc. | 87 | 0,00 | 6 | 0,00 | ||||
| 2025-08-08 | 13F | Independence Financial Advisors, LLC | 144 405 | 3,39 | 10 692 | 10,11 | ||||
| 2025-08-14 | 13F | Ancora Advisors, LLC | 0 | 0 | ||||||
| 2025-08-14 | 13F | Wiley Bros.-aintree Capital, Llc | 9 219 | 23,83 | 683 | 33,46 | ||||
| 2025-08-04 | 13F | Arkadios Wealth Advisors | 3 695 | 0,08 | 274 | 6,64 | ||||
| 2025-08-13 | 13F | Quadrant Capital Group Llc | 0 | −100,00 | 0 | |||||
| 2025-08-15 | 13F | CI Private Wealth, LLC | 2 967 | 0,00 | 220 | 6,31 | ||||
| 2025-07-11 | 13F | LongView Wealth Management | 7 562 | 8,14 | 560 | 15,02 | ||||
| 2025-08-13 | 13F | Whalerock Point Partners, Llc | 3 479 | 0,00 | 258 | 6,64 | ||||
| 2025-07-25 | 13F | Envestnet Portfolio Solutions, Inc. | 0 | −100,00 | 0 | |||||
| 2025-07-07 | 13F | Roxbury Financial LLC | 7 944 | 3,84 | 588 | 4,81 | ||||
| 2025-08-13 | 13F | Colonial Trust Co / SC | 362 | 27 | ||||||
| 2025-08-14 | 13F | Bnp Paribas Arbitrage, Sa | 0 | −100,00 | 0 | |||||
| 2025-08-07 | 13F | Addison Advisors LLC | 743 | 0,00 | 55 | 7,84 | ||||
| 2025-08-14 | 13F | Jane Street Group, Llc | 0 | −100,00 | 0 | |||||
| 2025-04-21 | 13F | Nelson, Van Denburg & Campbell Wealth Management Group, LLC | 0 | −100,00 | 0 | |||||
| 2025-07-08 | 13F | Atlas Brown,Inc. | 3 693 | 1,29 | 273 | 7,91 | ||||
| 2025-07-16 | 13F | American National Bank | 9 711 | 11,28 | 719 | 18,65 | ||||
| 2025-07-08 | 13F | Parallel Advisors, LLC | 1 130 | 0,00 | 84 | 6,41 | ||||
| 2025-07-10 | 13F | Oliver Lagore Vanvalin Investment Group | 289 | 0,00 | 20 | 5,26 | ||||
| 2025-05-28 | NP | BBTBX - Bridge Builder Core Bond Fund | 0 | −100,00 | 0 | −100,00 | ||||
| 2025-05-28 | NP | BBCPX - Bridge Builder Core Plus Bond Fund | 0 | −100,00 | 0 | −100,00 | ||||
| 2025-08-13 | 13F | Northwestern Mutual Wealth Management Co | 93 931 | −53,30 | 6 955 | −50,26 | ||||
| 2025-08-14 | 13F | Comerica Bank | 4 053 | 0,15 | 300 | 6,76 | ||||
| 2025-05-13 | 13F | Heck Capital Advisors, LLC | 0 | −100,00 | 0 | −100,00 | ||||
| 2025-07-29 | 13F | Primoris Wealth Advisors, Llc | 4 225 | 313 | ||||||
| 2025-07-21 | 13F | HighMark Wealth Management LLC | 550 | 0,00 | 41 | 5,26 | ||||
| 2025-08-14 | 13F | Mariner, LLC | 47 625 | −3,88 | 3 526 | 2,38 | ||||
| 2025-08-06 | 13F | Atlantic Union Bankshares Corp | 43 | 3 | ||||||
| 2025-08-12 | 13F | Pathstone Holdings, LLC | 8 016 | −44,83 | 594 | −41,69 | ||||
| 2025-08-15 | 13F | Morgan Stanley | 331 555 | 2,76 | 24 548 | 9,44 | ||||
| 2025-07-18 | 13F | Vicus Capital | 299 652 | 2,51 | 22 186 | 9,17 | ||||
| 2025-08-07 | 13F | Birchcreek Wealth Management, LLC | 19 576 | 5,43 | 1 449 | 12,33 | ||||
| 2025-07-17 | 13F | Smith, Salley & Associates | 53 785 | 1,34 | 3 982 | 7,94 | ||||
| 2025-08-06 | 13F | Kcm Investment Advisors Llc | 3 859 | 0,00 | 286 | 6,34 | ||||
| 2025-07-16 | 13F | Signaturefd, Llc | 35 | 0,00 | 3 | 0,00 | ||||
| 2025-08-14 | 13F | Susquehanna International Group, Llp | 0 | −100,00 | 0 | −100,00 | ||||
| 2025-08-07 | 13F | Hughes Financial Services, LLC | 14 | 0,00 | 1 | |||||
| 2025-08-13 | 13F | Lido Advisors, LLC | 2 508 013 | −0,78 | 185 693 | 5,67 | ||||
| 2025-08-14 | 13F | Integrated Wealth Concepts LLC | 3 578 | 265 | ||||||
| 2025-08-13 | 13F | Flow Traders U.s. Llc | 0 | −100,00 | 0 | |||||
| 2025-05-12 | 13F | Sandy Spring Bank | 43 | 0,00 | 3 | 0,00 | ||||
| 2025-08-14 | 13F | Goldman Sachs Group Inc | 22 700 | 168,70 | 1 681 | 186,20 | ||||
| 2025-08-08 | 13F | Capital Investment Counsel, Inc | 5 433 | −3,53 | 402 | 2,81 | ||||
| 2025-07-01 | 13F | Harbor Investment Advisory, Llc | 0 | −100,00 | 0 | |||||
| 2025-07-28 | 13F | Acorn Financial Advisory Services Inc /adv | 9 471 | 34,23 | 701 | 43,06 | ||||
| 2025-08-04 | 13F | Prairie Wealth Advisors, Inc. | 7 045 | 2,85 | 522 | 9,45 | ||||
| 2025-07-09 | 13F | Breakwater Capital Group | 5 966 | −0,07 | 442 | 6,27 | ||||
| 2025-08-12 | 13F | Coldstream Capital Management Inc | 0 | −100,00 | 0 | |||||
| 2025-08-13 | 13F | Congress Wealth Management LLC / DE / | 312 278 | −2,01 | 23 121 | 4,36 | ||||
| 2025-09-03 | 13F | Q3 Asset Management | 0 | −100,00 | 0 | |||||
| 2025-07-15 | 13F | Elevated Capital Advisors, LLC | 4 167 | 0,00 | 290 | 0,00 | ||||
| 2025-08-14 | 13F | Visionary Wealth Advisors | 3 036 | 0,00 | 225 | 6,16 | ||||
| 2025-08-06 | 13F | Valued Wealth Advisors LLC | 73 | 0,00 | 5 | 0,00 | ||||
| 2025-07-28 | 13F | RFG Advisory, LLC | 5 870 | 72,65 | 435 | 83,90 | ||||
| 2025-07-14 | 13F | UMA Financial Services, Inc. | 208 | −22,10 | 15 | −16,67 | ||||
| 2025-08-14 | 13F | Two Sigma Investments, Lp | 94 900 | 7 026 | ||||||
| 2025-08-13 | 13F | Russell Investments Group, Ltd. | 49 | 345,45 | 4 | |||||
| 2025-05-06 | 13F | Venturi Wealth Management, LLC | 0 | −100,00 | 0 | |||||
| 2025-04-21 | 13F | SILVER OAK SECURITIES, Inc | 0 | −100,00 | 0 | |||||
| 2025-07-17 | 13F | Sound Income Strategies, LLC | 138 | 0,00 | 10 | 11,11 | ||||
| 2025-07-18 | 13F | Tanager Wealth Management LLP | 0 | −100,00 | 0 | |||||
| 2025-07-21 | 13F | Exchange Capital Management, Inc. | 31 955 | −2,79 | 2 366 | 3,50 | ||||
| 2025-08-06 | 13F | Mcrae Capital Management Inc | 6 110 | 452 | ||||||
| 2025-05-12 | 13F | Richard W. Paul & Associates, LLC | 0 | −100,00 | 0 | −100,00 | ||||
| 2025-07-30 | 13F | VCI Wealth Management LLC | 32 989 | 8,22 | 2 443 | 15,24 | ||||
| 2025-07-21 | 13F | Quent Capital, LLC | 0 | −100,00 | 0 | |||||
| 2025-05-01 | 13F | High Note Wealth, LLC | 0 | −100,00 | 0 | |||||
| 2025-08-14 | 13F | Colony Group, LLC | 2 881 | 0,03 | 213 | 6,50 | ||||
| 2025-08-11 | 13F | Tidemark, LLC | 150 | 0,00 | 11 | 10,00 | ||||
| 2025-08-14 | 13F | Ameriprise Financial Inc | 103 983 | 120,41 | 7 702 | 134,89 | ||||
| 2025-07-25 | 13F | Cwm, Llc | 32 406 | 347,47 | 2 | |||||
| 2025-08-06 | 13F | Maltin Wealth Management, Inc. | 55 546 | 1,63 | 4 113 | 8,24 | ||||
| 2025-08-12 | 13F | LPL Financial LLC | 245 399 | −13,87 | 18 169 | −8,27 | ||||
| 2025-08-14 | 13F | Royal Bank Of Canada | 20 594 | −32,72 | 1 524 | −28,38 | ||||
| 2025-08-11 | 13F | Citigroup Inc | 27 101 | −6,62 | 2 007 | −0,55 | ||||
| 2025-08-14 | 13F | Mercer Global Advisors Inc /adv | 7 739 | −15,57 | 573 | −10,20 | ||||
| 2025-07-09 | 13F | Pallas Capital Advisors LLC | 7 430 | −0,50 | 550 | 5,97 | ||||
| 2025-07-31 | 13F | Cornerstone Management, Inc. | 7 110 | 15,27 | 526 | 22,90 | ||||
| 2025-07-31 | 13F | Glass Jacobson Investment Advisors llc | 12 202 | −2,22 | 903 | 5,37 | ||||
| 2025-07-29 | 13F | Tradewinds Capital Management, LLC | 312 | 0,32 | 23 | 9,52 | ||||
| 2025-08-06 | 13F | Commonwealth Equity Services, Llc | 595 860 | 1,09 | 44 | 10,00 | ||||
| 2025-08-11 | 13F | Principal Securities, Inc. | 3 272 | −17,48 | 242 | −11,03 | ||||
| 2025-08-01 | 13F | Rossby Financial, LCC | 301 | 0,00 | 22 | 10,00 | ||||
| 2025-08-04 | 13F | Keybank National Association/oh | 5 347 | 0,00 | 396 | 6,47 | ||||
| 2025-07-10 | 13F | Secure Asset Management, LLC | 0 | −100,00 | 0 |