Grundläggande statistik
| Institutionella ägare | 172 total, 172 long only, 0 short only, 0 long/short - change of 16,11% MRQ |
| Genomsnittlig portföljallokering | 0.3793 % - change of 26,76% MRQ |
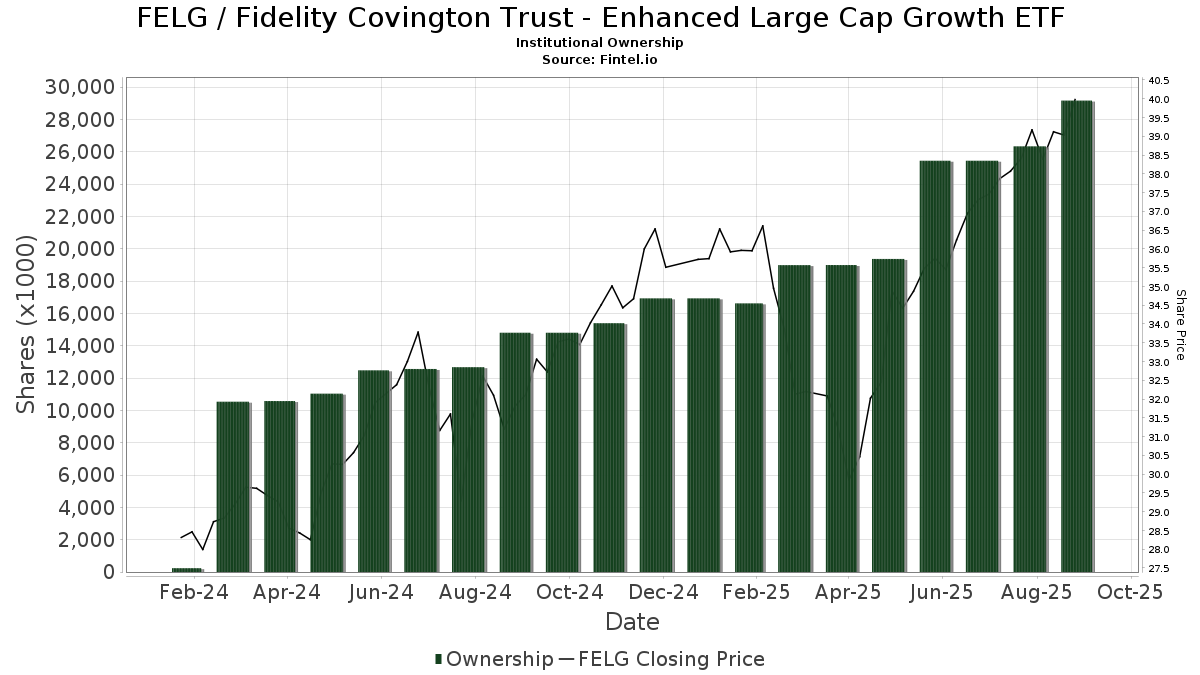
| Institutionella aktier (lång) | 29 171 785 (ex 13D/G) - change of 3,72MM shares 14,63% MRQ |
| Institutionellt värde (lång) | $ 703 097 USD ($1000) |
Institutionellt ägande och aktieägare
Fidelity Covington Trust - Enhanced Large Cap Growth ETF (US:FELG) har 172 Institutionella ägare och aktieägare som har lämnat in 13D/G- eller 13F-formulär till Securities Exchange Commission (SEC). Dessa institut innehar totalt 29,171,785 aktier. Största aktieägare inkluderar Mml Investors Services, Llc, Envestnet Asset Management Inc, Commonwealth Equity Services, Llc, LPL Financial LLC, Equitable Holdings, Inc., Independence Financial Advisors, LLC, Raymond James Financial Inc, Advisor Group Holdings, Inc., Spectrum Investment Advisors, Inc., and Cambridge Investment Research Advisors, Inc. .
Fidelity Covington Trust - Enhanced Large Cap Growth ETF (ARCA:FELG) Institutionell ägarstruktur visar institutioners och fonders nuvarande positioner i företaget, samt de senaste förändringarna i positionernas storlek. Större aktieägare kan vara enskilda investerare, fonder, hedgefonder eller institutioner. Bilaga 13D visar att investeraren äger (eller ägde) mer än 5% av företaget och avser (eller avsåg) att aktivt eftersträva en förändring av affärsstrategin. Schedule 13G indikerar en passiv investering på över 5%.
The share price as of September 10, 2025 is 39,98 / share. Previously, on September 11, 2024, the share price was 31,81 / share. This represents an increase of 25,68% over that period.
Fondsentimentets poäng
Fondsentimentet poängen(fka Ägarackumulation-poäng) visar vilka aktier som är mest köpta av fonder. Det är resultatet av en sofistikerad kvantitativ flerfaktormodell som identifierar företag med de högsta nivåerna av institutionell ackumulering. Poängsättningsmodellen använder en kombination av den totala ökningen av redovisade ägare, förändringarna i portföljallokeringarna för dessa ägare och andra mått. Siffran sträcker sig från 0 till 100, där högre siffror indikerar en högre nivå av ackumulering i förhållande till sina konkurrenter, och 50 är genomsnittet.
Uppdateringsfrekvens: Dagligen
Se Ownership Explorer, som innehåller en lista över de högst rankade företagen.
Institutionell sälj/köp-kvot
Förutom att rapportera vanliga eget kapital- och skuldemissioner måste institutioner med mer än 100MM tillgångar under förvaltning också avslöja sina innehav av sälj- och köpoptioner. Eftersom säljoptioner i allmänhet indikerar ett negativt sentiment och köpoptioner indikerar ett positivt sentiment, kan vi få en uppfattning om det övergripande institutionella sentimentet genom att plotta förhållandet mellan säljoptioner och köpoptioner. Diagrammet till höger visar det historiska förhållandet mellan sälj- och köpoptioner för detta instrument.
Genom att använda sälj/köp-kvoten som en indikator på aktieägarnas sentiment undviker man en av de största bristerna med att använda det totala institutionella ägandet, nämligen att en betydande del av de förvaltade tillgångarna investeras passivt för att följa index. Passivt förvaltade fonder köper vanligtvis inte optioner, så indikatorn för sälj/köp-kvoten ger en bättre bild av stämningen i aktivt förvaltade fonder.
13F- och NPORT-arkiveringar
Detaljer om 13F-arkiveringar är gratis. Detaljer om NP-arkiveringar kräver ett premiummedlemskap. Gröna rader indikerar nya positioner. Röda rader indikerar stängda positioner. Klicka på länk symbolen för att se hela transaktionshistoriken.
Uppgradera
för att låsa upp premiumdata och exportera till Excel ![]() .
.
| Fil Datum | Källa | Investerare | Typ | Genomsnittligt pris (beräknat) |
Aktier | Δ Aktier (%) |
Rapporterat värde (1000 USD) |
Δ Värde (%) |
Portföljallokering (%) |
|
|---|---|---|---|---|---|---|---|---|---|---|
| 2025-08-11 | 13F | Cornerstone Planning Group LLC | 1 082 | 0,00 | 41 | 28,13 | ||||
| 2025-08-14 | 13F | GWM Advisors LLC | 22 225 | 31,19 | 823 | 54,41 | ||||
| 2025-08-14 | 13F | Geneva Partners, LLC | 19 154 | −43,18 | 709 | −32,86 | ||||
| 2025-07-17 | 13F | Janney Montgomery Scott LLC | 14 666 | −1,60 | 1 | |||||
| 2025-08-06 | 13F | Wedbush Securities Inc | 13 099 | 4,93 | 0 | |||||
| 2025-04-28 | 13F | CarsonAllaria Wealth Management, Ltd. | 0 | −100,00 | 0 | |||||
| 2025-08-07 | 13F | Kestra Private Wealth Services, Llc | 22 006 | 37,93 | 815 | 62,15 | ||||
| 2025-07-21 | 13F | Ameritas Advisory Services, LLC | 2 801 | 104 | ||||||
| 2025-05-14 | 13F | PKS Advisory Services, LLC | 0 | −100,00 | 0 | |||||
| 2025-08-18 | 13F/A | Kestra Investment Management, LLC | 462 790 | −41,23 | 17 137 | −30,91 | ||||
| 2025-07-15 | 13F | Fifth Third Bancorp | 231 | 0,00 | 9 | 14,29 | ||||
| 2025-08-07 | 13F | Proficio Capital Partners LLC | 0 | −100,00 | 0 | |||||
| 2025-07-14 | 13F | Sowell Financial Services LLC | 26 372 | 977 | ||||||
| 2025-08-04 | 13F | Integrity Alliance, Llc. | 0 | −100,00 | 0 | |||||
| 2025-05-06 | 13F | Assetmark, Inc | 0 | −100,00 | 0 | |||||
| 2025-08-14 | 13F | Stifel Financial Corp | 24 697 | 90,75 | 915 | 124,57 | ||||
| 2025-08-08 | 13F | Advisors Capital Management, LLC | 190 632 | 89,46 | 7 059 | 122,75 | ||||
| 2025-08-14 | 13F | Menora Mivtachim Holdings Ltd. | 211 326 | 55,32 | 7 825 | 82,61 | ||||
| 2025-08-11 | 13F | Nations Financial Group Inc, /ia/ /adv | 7 647 | 283 | ||||||
| 2025-08-15 | 13F | Captrust Financial Advisors | 10 634 | 11,58 | 394 | 31,00 | ||||
| 2025-08-14 | 13F | Quantinno Capital Management LP | 10 979 | 407 | ||||||
| 2025-07-09 | 13F | Baron Wealth Management LLC | 11 426 | 423 | ||||||
| 2025-08-14 | 13F | UBS Group AG | 1 651 | 0,00 | 61 | 17,31 | ||||
| 2025-08-01 | 13F | Envestnet Asset Management Inc | 5 941 796 | 7,70 | 220 025 | 26,60 | ||||
| 2025-07-21 | 13F | Pacific Financial Group Inc | 6 044 | 224 | ||||||
| 2025-07-18 | 13F | Rogco, Lp | 1 521 | 56 | ||||||
| 2025-08-15 | 13F | Kestra Advisory Services, LLC | 550 317 | 15,08 | 20 378 | 35,29 | ||||
| 2025-08-07 | 13F | Allworth Financial LP | 3 462 | 0,03 | 128 | 18,52 | ||||
| 2025-08-11 | 13F | Regal Investment Advisors LLC | 11 193 | 2,87 | 414 | 21,05 | ||||
| 2025-07-18 | 13F | Madrona Financial Services, LLC | 11 706 | 46,03 | 433 | 71,83 | ||||
| 2025-07-29 | 13F | Fundamentun, Llc | 7 857 | 291 | ||||||
| 2025-08-08 | 13F | Creative Planning | 42 648 | 0,96 | 1 579 | 18,72 | ||||
| 2025-07-15 | 13F | Charter Capital Management, LLC\DE | 8 938 | 331 | ||||||
| 2025-07-09 | 13F | Act Wealth Management, Llc | 10 667 | 0,12 | 395 | 17,61 | ||||
| 2025-08-08 | 13F | Thoroughbred Financial Services, Llc | 6 289 | −38,63 | 0 | |||||
| 2025-08-14 | 13F | EP Wealth Advisors, Inc. | 6 086 | 69,01 | 225 | 99,12 | ||||
| 2025-08-27 | NP | ACGRX - Advisors Capital Growth Fund | 153 700 | 128,38 | 5 692 | 168,57 | ||||
| 2025-07-15 | 13F | Bay Capital Advisors, LLC | 19 219 | 13,23 | 712 | 33,15 | ||||
| 2025-07-25 | 13F | Ball & Co Wealth Management Inc. | 20 497 | −45,42 | 1 | −100,00 | ||||
| 2025-07-15 | 13F | Beacon Investment Advisory Services, Inc. | 10 021 | 0,00 | 371 | 17,78 | ||||
| 2025-07-18 | 13F | Rolek Wealth Management LLC | 31 558 | −20,72 | 1 169 | −4,50 | ||||
| 2025-07-25 | 13F | Verdence Capital Advisors LLC | 11 182 | 0,13 | 414 | 17,95 | ||||
| 2025-08-14 | 13F | Citadel Advisors Llc | 0 | −100,00 | 0 | |||||
| 2025-08-12 | 13F | Steward Partners Investment Advisory, Llc | 1 687 | 313,48 | 62 | 416,67 | ||||
| 2025-08-12 | 13F | Jpmorgan Chase & Co | 499 432 | 0,87 | 18 494 | 18,58 | ||||
| 2025-07-10 | 13F | Oliver Lagore Vanvalin Investment Group | 1 | 0,00 | 0 | |||||
| 2025-08-12 | 13F | SRS Capital Advisors, Inc. | 3 343 | 124 | ||||||
| 2025-07-17 | 13F | Halbert Hargrove Global Advisors, Llc | 253 | 0,00 | 9 | 28,57 | ||||
| 2025-05-28 | 13F | Intrua Financial, LLC | 0 | −100,00 | 0 | −100,00 | ||||
| 2025-07-29 | 13F | Spectrum Investment Advisors, Inc. | 690 417 | 4,06 | 25 566 | 22,34 | ||||
| 2025-08-13 | 13F | Fisher Asset Management, LLC | 6 336 | 235 | ||||||
| 2025-08-12 | 13F | Proequities, Inc. | 0 | 0 | ||||||
| 2025-08-13 | 13F | Colonial Trust Advisors | 1 121 | 42 | ||||||
| 2025-05-01 | 13F | Iron Horse Wealth Management, LLC | 0 | −100,00 | 0 | |||||
| 2025-08-15 | 13F | Tower Research Capital LLC (TRC) | 11 458 | 424 | ||||||
| 2025-07-25 | 13F | Hazlett, Burt & Watson, Inc. | 593 | 0,17 | 0 | |||||
| 2025-08-07 | 13F | Cahill Financial Advisors Inc | 5 887 | 218 | ||||||
| 2025-08-13 | 13F | IAG Wealth Partners, LLC | 28 | 1 | ||||||
| 2025-07-31 | 13F | Cambridge Investment Research Advisors, Inc. | 550 661 | 45,33 | 20 | 81,82 | ||||
| 2025-08-06 | 13F | AE Wealth Management LLC | 3 678 | −8,12 | 136 | 7,94 | ||||
| 2025-08-01 | 13F | Transcend Wealth Collective, Llc | 7 644 | 283 | ||||||
| 2025-08-14 | 13F | Foronjy Financial Llc | 7 758 | 287 | ||||||
| 2025-08-11 | 13F | Heritage Wealth Advisors | 552 | 0,00 | 20 | 17,65 | ||||
| 2025-07-23 | 13F | Element Wealth, LLC | 8 993 | 333 | ||||||
| 2025-07-14 | 13F | Sentinel Pension Advisors Inc | 381 516 | 40,05 | 14 128 | 64,63 | ||||
| 2025-08-08 | 13F | Cetera Investment Advisers | 196 778 | 24,39 | 7 287 | 46,22 | ||||
| 2025-08-05 | 13F | Sigma Planning Corp | 11 822 | −1,34 | 438 | 15,92 | ||||
| 2025-08-13 | 13F | Summit Wealth Group Llc / Co | 31 127 | 1 153 | ||||||
| 2025-08-12 | 13F | O'shaughnessy Asset Management, Llc | 0 | −100,00 | 0 | |||||
| 2025-07-23 | 13F | Clear Creek Financial Management, LLC | 24 841 | −29,85 | 920 | −17,58 | ||||
| 2025-08-14 | 13F | CoreCap Advisors, LLC | 1 671 | 97,99 | 62 | 134,62 | ||||
| 2025-08-06 | 13F | Golden State Wealth Management, LLC | 4 479 | 52,92 | 166 | 79,35 | ||||
| 2025-08-12 | 13F | Wood Tarver Financial Group, LLC | 5 707 | 0,00 | 0 | −100,00 | ||||
| 2025-07-22 | 13F | Wealthcare Advisory Partners LLC | 7 497 | −2,20 | 278 | 14,94 | ||||
| 2025-07-28 | 13F | Duncker Streett & Co Inc | 0 | −100,00 | 0 | |||||
| 2025-08-14 | 13F | Susquehanna International Group, Llp | 34 945 | −13,34 | 1 294 | 1,89 | ||||
| 2025-08-14 | 13F | Hilltop Holdings Inc. | 40 943 | −1,77 | 1 516 | 15,55 | ||||
| 2025-08-14 | 13F | Fmr Llc | 441 654 | 14,85 | 16 354 | 35,01 | ||||
| 2025-07-07 | 13F | Investors Research Corp | 1 208 | −19,89 | 45 | −6,38 | ||||
| 2025-07-23 | 13F | Richardson Capital Management LLC | 5 777 | 0,00 | 214 | 17,68 | ||||
| 2025-08-14 | 13F | Hrt Financial Lp | 8 843 | 0 | ||||||
| 2025-07-23 | 13F | Elm3 Financial Group, LLC | 11 548 | 65,23 | 428 | 94,09 | ||||
| 2025-08-07 | 13F | Flagship Wealth Advisors, Llc | 133 223 | 15,49 | 4 933 | 35,78 | ||||
| 2025-08-05 | 13F | Sage Capital Management, LLC | 12 344 | 0,10 | 457 | 17,78 | ||||
| 2025-05-14 | 13F | Jane Street Group, Llc | 0 | −100,00 | 0 | |||||
| 2025-07-29 | 13F | BKD Wealth Advisors, LLC | 0 | −100,00 | 0 | |||||
| 2025-08-14 | 13F | Great Valley Advisor Group, Inc. | 14 217 | 2,05 | 527 | 20,09 | ||||
| 2025-07-25 | 13F | Cwm, Llc | 2 325 | 0 | ||||||
| 2025-08-19 | 13F | Advisory Services Network, LLC | 9 533 | −10,14 | 364 | 8,98 | ||||
| 2025-08-14 | 13F | Raymond James Financial Inc | 824 707 | −0,30 | 30 539 | 17,20 | ||||
| 2025-07-10 | 13F | Family Legacy Financial Solutions, LLC | 17 | 1 | ||||||
| 2025-08-14 | 13F | Wells Fargo & Company/mn | 148 583 | 3 074,17 | 5 502 | 3 642,86 | ||||
| 2025-07-30 | 13F | Drive Wealth Management, Llc | 6 620 | 0,65 | 245 | 18,36 | ||||
| 2025-07-24 | 13F | IFP Advisors, Inc | 3 720 | 0,11 | 138 | 17,09 | ||||
| 2025-05-09 | 13F | Keeler THomas Management LLC | 0 | −100,00 | 0 | −100,00 | ||||
| 2025-08-06 | 13F | Bensler, LLC | 11 185 | −5,03 | 414 | 11,59 | ||||
| 2025-07-07 | 13F | Nova Wealth Management, Inc. | 59 048 | 3,05 | 2 187 | 21,11 | ||||
| 2025-07-22 | 13F | Valeo Financial Advisors, LLC | 17 504 | −5,24 | 648 | 11,53 | ||||
| 2025-07-08 | 13F | Lowe Wealth Advisors, LLC | 101 | 0,00 | 4 | 0,00 | ||||
| 2025-08-05 | 13F | Carolinas Wealth Consulting Llc | 0 | −100,00 | 0 | −100,00 | ||||
| 2025-08-05 | 13F | Key FInancial Inc | 26 144 | 0,00 | 968 | 17,62 | ||||
| 2025-08-04 | 13F | IFG Advisory, LLC | 21 618 | 9,26 | 801 | 28,41 | ||||
| 2025-07-29 | 13F | Private Trust Co Na | 1 435 | −49,83 | 53 | −41,11 | ||||
| 2025-07-18 | 13F | Truist Financial Corp | 200 469 | −1,99 | 7 423 | 15,23 | ||||
| 2025-08-15 | 13F | Morgan Stanley | 14 954 | −26,48 | 554 | −13,59 | ||||
| 2025-07-21 | 13F | Greenwood Capital Associates Llc | 51 998 | 21,36 | 1 925 | 42,70 | ||||
| 2025-08-26 | 13F/A | Thrivent Financial For Lutherans | 34 390 | −93,88 | 1 | −94,74 | ||||
| 2025-08-14 | 13F | D. E. Shaw & Co., Inc. | 8 100 | 17,39 | 300 | 37,79 | ||||
| 2025-04-21 | 13F | Nelson, Van Denburg & Campbell Wealth Management Group, LLC | 0 | −100,00 | 0 | |||||
| 2025-08-13 | 13F | Flow Traders U.s. Llc | 0 | −100,00 | 0 | |||||
| 2025-09-04 | 13F/A | Advisor Group Holdings, Inc. | 721 700 | −30,49 | 26 723 | −18,31 | ||||
| 2025-07-29 | 13F | Salus Financial Advisors, LLC | 6 772 | −17,68 | 251 | −3,47 | ||||
| 2025-04-21 | 13F | ORG Partners LLC | 0 | −100,00 | 0 | |||||
| 2025-08-04 | 13F | Creekmur Asset Management LLC | 21 071 | 0,04 | 780 | 17,65 | ||||
| 2025-08-14 | 13F | Mml Investors Services, Llc | 5 981 257 | 20,36 | 221 | 41,67 | ||||
| 2025-08-04 | 13F | Atria Investments Llc | 111 039 | 2,60 | 4 112 | 20,59 | ||||
| 2025-08-12 | 13F | Vestor Capital, Llc | 12 665 | 45,74 | 1 | |||||
| 2025-07-22 | 13F | Merit Financial Group, LLC | 24 561 | 84,70 | 909 | 117,46 | ||||
| 2025-07-28 | 13F | Harbour Investments, Inc. | 35 388 | −2,01 | 1 310 | 15,22 | ||||
| 2025-04-21 | 13F | Envestnet Portfolio Solutions, Inc. | 0 | −100,00 | 0 | |||||
| 2025-08-14 | 13F | Redwood Financial Network Corp | 24 448 | 4,33 | 905 | 22,63 | ||||
| 2025-08-08 | 13F | Avantax Advisory Services, Inc. | 275 017 | 123,96 | 10 184 | 163,26 | ||||
| 2025-08-14 | 13F | Mercer Global Advisors Inc /adv | 6 593 | 244 | ||||||
| 2025-08-08 | 13F | Advyzon Investment Management, LLC | 12 282 | 455 | ||||||
| 2025-07-11 | 13F | Farther Finance Advisors, LLC | 1 072 | 40 | ||||||
| 2025-08-11 | 13F | CBIZ Investment Advisory Services, LLC | 0 | −100,00 | 0 | −100,00 | ||||
| 2025-07-15 | 13F | Perennial Advisors, LLC | 12 675 | 0,00 | 469 | 17,54 | ||||
| 2025-08-13 | 13F | Capital Analysts, Inc. | 472 | −98,76 | 0 | −100,00 | ||||
| 2025-08-11 | 13F | HighTower Advisors, LLC | 19 745 | 0,13 | 731 | 17,71 | ||||
| 2025-05-09 | 13F | Atria Wealth Solutions, Inc. | 0 | −100,00 | 0 | |||||
| 2025-08-11 | 13F | Private Advisor Group, LLC | 169 996 | −38,78 | 6 295 | −28,04 | ||||
| 2025-08-12 | 13F | J.w. Cole Advisors, Inc. | 11 935 | −51,75 | 442 | −43,39 | ||||
| 2025-08-14 | 13F | Bank Of America Corp /de/ | 8 651 | 251,10 | 320 | 315,58 | ||||
| 2025-08-08 | 13F | Independence Financial Advisors, LLC | 830 356 | 1 399,41 | 30 748 | 1 663,07 | ||||
| 2025-08-14 | 13F | RMB Capital Management, LLC | 5 822 | 216 | ||||||
| 2025-07-17 | 13F | Prepared Retirement Institute LLC | 239 293 | 64,32 | 8 861 | 93,18 | ||||
| 2025-07-18 | 13F | Pure Financial Advisors, Inc. | 21 944 | 3,04 | 813 | 21,19 | ||||
| 2025-08-15 | 13F | CI Private Wealth, LLC | 6 967 | 0,00 | 258 | 17,35 | ||||
| 2025-08-25 | 13F | Silverlake Wealth Management Llc | 81 009 | −17,10 | 3 000 | −2,57 | ||||
| 2025-07-24 | 13F | Us Bancorp \de\ | 4 087 | −9,92 | 151 | 6,34 | ||||
| 2025-08-13 | 13F | Marshall Wace, Llp | 34 819 | 1 289 | ||||||
| 2025-08-06 | 13F | Commonwealth Equity Services, Llc | 3 520 372 | 47,86 | 130 | 75,68 | ||||
| 2025-07-30 | 13F | Roman Butler Fullerton & Co | 7 078 | 0,13 | 270 | 23,96 | ||||
| 2025-08-04 | 13F | Creative Financial Designs Inc /adv | 101 | 0,00 | 4 | 0,00 | ||||
| 2025-08-13 | 13F | Northwestern Mutual Wealth Management Co | 497 331 | 8,68 | 18 416 | 27,76 | ||||
| 2025-08-01 | 13F | Gwn Securities Inc. | 5 567 | −84,52 | 206 | −83,28 | ||||
| 2025-07-14 | 13F | Abound Wealth Management | 1 093 | 40 | ||||||
| 2025-07-31 | 13F | First Business Financial Services, Inc. | 5 700 | 211 | ||||||
| 2025-07-14 | 13F | Infinity Wealth Counsel, LLC | 23 225 | 10,07 | 860 | 29,52 | ||||
| 2025-07-15 | 13F | Financial Partners Group, Inc | 58 112 | −7,34 | 2 152 | 8,91 | ||||
| 2025-05-14 | 13F | Ameriprise Financial Inc | 0 | −100,00 | 0 | −100,00 | ||||
| 2025-08-14 | 13F | Comerica Bank | 856 | 152,51 | 32 | 210,00 | ||||
| 2025-07-15 | 13F | Regatta Capital Group, Llc | 7 157 | 0,13 | 265 | 17,78 | ||||
| 2025-08-13 | 13F | Maia Wealth LLC | 10 183 | −4,33 | 377 | 15,29 | ||||
| 2025-08-14 | 13F | Investmark Advisory Group LLC | 53 740 | 448,14 | 1 990 | 546,10 | ||||
| 2025-08-14 | 13F | Integrated Wealth Concepts LLC | 153 232 | 4,52 | 5 674 | 22,89 | ||||
| 2025-07-23 | 13F | Traphagen Investment Advisors Llc | 18 187 | 0,12 | 673 | 17,66 | ||||
| 2025-08-14 | 13F | Mariner, LLC | 22 698 | 6,06 | 840 | 24,63 | ||||
| 2025-05-12 | 13F | Sandy Spring Bank | 3 051 | 96 | ||||||
| 2025-08-14 | 13F | Royal Bank Of Canada | 41 284 | −9,77 | 1 529 | 6,03 | ||||
| 2025-08-06 | 13F | Atlantic Union Bankshares Corp | 3 051 | 113 | ||||||
| 2025-08-12 | 13F | Pathstone Holdings, LLC | 10 344 | 0,12 | 383 | 17,85 | ||||
| 2025-08-12 | 13F | SlateStone Wealth, LLC | 5 564 | 0 | ||||||
| 2025-08-12 | 13F | Global Retirement Partners, LLC | 20 017 | 47 559,52 | 741 | 74 000,00 | ||||
| 2025-08-14 | 13F | Goldman Sachs Group Inc | 7 335 | 272 | ||||||
| 2025-08-13 | 13F | Truvestments Capital Llc | 300 | 0,00 | 11 | 22,22 | ||||
| 2025-08-07 | 13F | Rollins Financial Advisors, LLC | 53 948 | −15,16 | 1 998 | −0,25 | ||||
| 2025-07-10 | 13F | Wealth Enhancement Advisory Services, Llc | 12 493 | 466 | ||||||
| 2025-08-13 | 13F | Lido Advisors, LLC | 72 557 | 3,42 | 2 687 | 21,59 | ||||
| 2025-07-15 | 13F | FMA Wealth Management, LLC | 10 965 | 32,68 | 406 | 42,46 | ||||
| 2025-05-15 | 13F | National Wealth Management Group, LLC | 9 642 | 0,00 | 304 | −10,88 | ||||
| 2025-07-23 | 13F | Venturi Wealth Management, LLC | 8 000 | 0,00 | 296 | 17,46 | ||||
| 2025-07-17 | 13F | Sound Income Strategies, LLC | 1 006 | 0,00 | 37 | 19,35 | ||||
| 2025-08-14 | 13F | Qube Research & Technologies Ltd | 1 891 | −39,85 | 70 | −29,29 | ||||
| 2025-08-13 | 13F | Kuhn & Co Investment Counsel | 15 372 | 2,88 | 569 | 21,06 | ||||
| 2025-07-23 | 13F | Valmark Advisers, Inc. | 102 329 | 64,90 | 3 789 | 93,91 | ||||
| 2025-08-15 | 13F | Equitable Holdings, Inc. | 948 919 | −30,16 | 35 138 | −17,90 | ||||
| 2025-07-10 | 13F | Security National Bank | 11 175 | 0,00 | 414 | 17,33 | ||||
| 2025-08-13 | 13F | Russell Investments Group, Ltd. | 1 082 | 40 | ||||||
| 2025-07-14 | 13F | AdvisorNet Financial, Inc | 1 621 | 0,00 | 60 | 17,65 | ||||
| 2025-08-14 | 13F | Coastal Bridge Advisors, LLC | 10 793 | 0,12 | 400 | 17,70 | ||||
| 2025-07-23 | 13F | InTrack Investment Management Inc | 39 816 | 1 474 | ||||||
| 2025-08-11 | 13F | Principal Securities, Inc. | 185 403 | 10 263,50 | 6 865 | 10 796,83 | ||||
| 2025-07-25 | 13F | Gibson Capital, LLC | 16 230 | 0,00 | 601 | 17,61 | ||||
| 2025-07-30 | 13F | Cullen/frost Bankers, Inc. | 5 308 | 90,52 | 197 | 125,29 | ||||
| 2025-08-08 | 13F | Larson Financial Group LLC | 641 | 75,62 | 24 | 109,09 | ||||
| 2025-08-14 | 13F | LaSalle St. Investment Advisors, LLC | 13 775 | −2,73 | 1 | |||||
| 2025-08-18 | 13F | Geneos Wealth Management Inc. | 250 | 0,00 | 9 | 28,57 | ||||
| 2025-08-14 | 13F | Sunbelt Securities, Inc. | 5 969 | −17,56 | 211 | −7,46 | ||||
| 2025-08-07 | 13F | CENTRAL TRUST Co | 440 | 0,00 | 16 | 23,08 | ||||
| 2025-07-10 | 13F | Sovran Advisors, LLC | 26 496 | 162,47 | 980 | 226,33 | ||||
| 2025-07-16 | 13F | Castleview Partners, Llc | 92 003 | 3 407 | ||||||
| 2025-08-06 | 13F | New Millennium Group LLC | 0 | 0 | ||||||
| 2025-07-31 | 13F | Glass Jacobson Investment Advisors llc | 0 | −100,00 | 0 | |||||
| 2025-08-12 | 13F | LPL Financial LLC | 1 836 582 | 47,64 | 68 009 | 73,56 | ||||
| 2025-08-13 | 13F | EverSource Wealth Advisors, LLC | 9 313 | −1,64 | 345 | 15,44 |