Grundläggande statistik
| Institutionella ägare | 170 total, 170 long only, 0 short only, 0 long/short - change of 1,18% MRQ |
| Genomsnittlig portföljallokering | 0.1770 % - change of −1,26% MRQ |
| Institutionella aktier (lång) | 7 881 271 (ex 13D/G) - change of −0,06MM shares −0,75% MRQ |
| Institutionellt värde (lång) | $ 479 577 USD ($1000) |
Institutionellt ägande och aktieägare
SPDR Index Shares Funds - SPDR S&P Emerging Markets Small Cap ETF (US:EWX) har 170 Institutionella ägare och aktieägare som har lämnat in 13D/G- eller 13F-formulär till Securities Exchange Commission (SEC). Dessa institut innehar totalt 7,881,271 aktier. Största aktieägare inkluderar Creative Planning, Bank Of America Corp /de/, Waddell & Associates, Llc, Mariner, LLC, Morgan Stanley, LPL Financial LLC, Wells Fargo & Company/mn, Empirical Financial Services, LLC d.b.a. Empirical Wealth Management, Old Mission Capital Llc, and Victory Capital Management Inc .
SPDR Index Shares Funds - SPDR S&P Emerging Markets Small Cap ETF (ARCA:EWX) Institutionell ägarstruktur visar institutioners och fonders nuvarande positioner i företaget, samt de senaste förändringarna i positionernas storlek. Större aktieägare kan vara enskilda investerare, fonder, hedgefonder eller institutioner. Bilaga 13D visar att investeraren äger (eller ägde) mer än 5% av företaget och avser (eller avsåg) att aktivt eftersträva en förändring av affärsstrategin. Schedule 13G indikerar en passiv investering på över 5%.
The share price as of September 16, 2025 is 68,02 / share. Previously, on September 17, 2024, the share price was 58,64 / share. This represents an increase of 16,00% over that period.

Fondsentimentets poäng
Fondsentimentet poängen(fka Ägarackumulation-poäng) visar vilka aktier som är mest köpta av fonder. Det är resultatet av en sofistikerad kvantitativ flerfaktormodell som identifierar företag med de högsta nivåerna av institutionell ackumulering. Poängsättningsmodellen använder en kombination av den totala ökningen av redovisade ägare, förändringarna i portföljallokeringarna för dessa ägare och andra mått. Siffran sträcker sig från 0 till 100, där högre siffror indikerar en högre nivå av ackumulering i förhållande till sina konkurrenter, och 50 är genomsnittet.
Uppdateringsfrekvens: Dagligen
Se Ownership Explorer, som innehåller en lista över de högst rankade företagen.
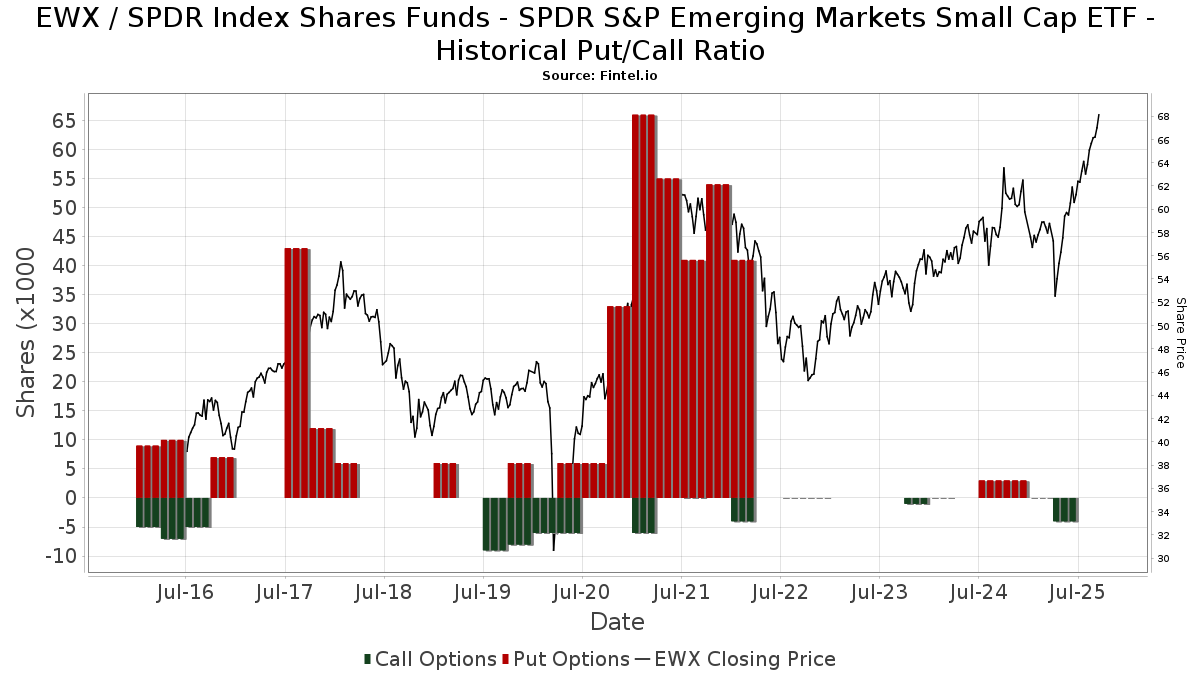
Institutionell sälj/köp-kvot
Förutom att rapportera vanliga eget kapital- och skuldemissioner måste institutioner med mer än 100MM tillgångar under förvaltning också avslöja sina innehav av sälj- och köpoptioner. Eftersom säljoptioner i allmänhet indikerar ett negativt sentiment och köpoptioner indikerar ett positivt sentiment, kan vi få en uppfattning om det övergripande institutionella sentimentet genom att plotta förhållandet mellan säljoptioner och köpoptioner. Diagrammet till höger visar det historiska förhållandet mellan sälj- och köpoptioner för detta instrument.
Genom att använda sälj/köp-kvoten som en indikator på aktieägarnas sentiment undviker man en av de största bristerna med att använda det totala institutionella ägandet, nämligen att en betydande del av de förvaltade tillgångarna investeras passivt för att följa index. Passivt förvaltade fonder köper vanligtvis inte optioner, så indikatorn för sälj/köp-kvoten ger en bättre bild av stämningen i aktivt förvaltade fonder.
13F- och NPORT-arkiveringar
Detaljer om 13F-arkiveringar är gratis. Detaljer om NP-arkiveringar kräver ett premiummedlemskap. Gröna rader indikerar nya positioner. Röda rader indikerar stängda positioner. Klicka på länk symbolen för att se hela transaktionshistoriken.
Uppgradera
för att låsa upp premiumdata och exportera till Excel ![]() .
.
| Fil Datum | Källa | Investerare | Typ | Genomsnittligt pris (beräknat) |
Aktier | Δ Aktier (%) |
Rapporterat värde (1000 USD) |
Δ Värde (%) |
Portföljallokering (%) |
|
|---|---|---|---|---|---|---|---|---|---|---|
| 2025-08-06 | 13F | AE Wealth Management LLC | 18 275 | 15,02 | 1 134 | 26,03 | ||||
| 2025-07-17 | 13F | Camelot Portfolios, LLC | 13 530 | −9,38 | 839 | −0,71 | ||||
| 2025-05-02 | 13F | First Command Advisory Services, Inc. | 0 | −100,00 | 0 | |||||
| 2025-07-11 | 13F | Kingstone Capital Partners Texas, LLC | 24 528 | 1 | ||||||
| 2025-07-09 | 13F | Shore Point Advisors, LLC | 6 132 | 3,21 | 380 | 13,10 | ||||
| 2025-08-06 | 13F | Golden State Wealth Management, LLC | 19 | 0,00 | 1 | 0,00 | ||||
| 2025-08-14 | 13F | Mercer Global Advisors Inc /adv | 8 017 | −18,99 | 497 | −11,25 | ||||
| 2025-08-08 | 13F | Creative Planning | 2 008 095 | −9,52 | 124 562 | −0,89 | ||||
| 2025-08-14 | 13F | Ariadne Wealth Management, LP | 3 538 | −20,44 | 230 | −10,51 | ||||
| 2025-08-05 | 13F | Cherry Tree Wealth Management, LLC | 561 | 0,00 | 35 | 9,68 | ||||
| 2025-08-08 | 13F | Austin Wealth Management, LLC | 5 901 | −52,68 | 369 | −47,43 | ||||
| 2025-08-14 | 13F | Vista Investment Management | 40 103 | 9,38 | 2 488 | 19,80 | ||||
| 2025-08-08 | 13F | Thoroughbred Financial Services, Llc | 5 363 | −29,27 | 0 | |||||
| 2025-05-14 | 13F | CIBC Private Wealth Group, LLC | 0 | −100,00 | 0 | −100,00 | ||||
| 2025-08-19 | 13F | Asset Dedication, LLC | 187 | 0,00 | 12 | 10,00 | ||||
| 2025-07-28 | 13F | Harbour Investments, Inc. | 318 | 0,00 | 20 | 5,56 | ||||
| 2025-07-16 | 13F | Signaturefd, Llc | 85 | 0,00 | 5 | 25,00 | ||||
| 2025-08-04 | 13F | Spire Wealth Management | 13 720 | −3,35 | 851 | 5,98 | ||||
| 2025-05-08 | 13F | Arkadios Wealth Advisors | 0 | −100,00 | 0 | |||||
| 2025-08-07 | 13F | Montag A & Associates Inc | 0 | −100,00 | 0 | |||||
| 2025-05-14 | 13F | Quartz Partners, LLC | 0 | −100,00 | 0 | |||||
| 2025-04-30 | 13F | Cerity Partners LLC | 0 | −100,00 | 0 | |||||
| 2025-08-12 | 13F | Steward Partners Investment Advisory, Llc | 9 746 | −74,61 | 605 | −72,20 | ||||
| 2025-08-13 | 13F | Victory Capital Management Inc | 164 766 | 0,00 | 10 220 | 9,54 | ||||
| 2025-07-21 | 13F | Ameritas Advisory Services, LLC | 292 | 18 | ||||||
| 2025-04-23 | 13F | Mascagni Wealth Management, Inc. | 0 | −100,00 | 0 | −100,00 | ||||
| 2025-07-31 | 13F | Mason & Associates Inc | 45 226 | 4,69 | 2 805 | 14,68 | ||||
| 2025-08-13 | 13F | Flow Traders U.s. Llc | 18 412 | 1 | ||||||
| 2025-08-14 | 13F | CIBC World Markets Inc. | 4 570 | 0,00 | 283 | 9,69 | ||||
| 2025-08-06 | 13F | New Millennium Group LLC | 54 | −14,29 | 3 | 0,00 | ||||
| 2025-05-06 | 13F | Venturi Wealth Management, LLC | 0 | −100,00 | 0 | −100,00 | ||||
| 2025-08-15 | 13F | Tower Research Capital LLC (TRC) | 0 | −100,00 | 0 | |||||
| 2025-08-13 | 13F | Parkworth Wealth Management, Inc. | 151 | 0,67 | 9 | 12,50 | ||||
| 2025-08-07 | 13F | WESCAP Management Group, Inc. | 71 026 | −0,52 | 4 406 | 8,95 | ||||
| 2025-07-31 | 13F | 3EDGE Asset Management, LP | 25 425 | 88,85 | 1 568 | 104,97 | ||||
| 2025-08-12 | 13F | Jpmorgan Chase & Co | 21 682 | −3,09 | 1 345 | 6,16 | ||||
| 2025-08-14 | 13F | Transamerica Financial Advisors, Inc. | 90 964 | 1,53 | 5 642 | 112 740,00 | ||||
| 2025-08-08 | 13F | Empower Advisory Group, LLC | 4 065 | 0,00 | 252 | 9,57 | ||||
| 2025-08-06 | 13F | SNS Financial Group, LLC | 16 833 | 31,14 | 1 044 | 43,80 | ||||
| 2025-04-24 | 13F | Falcon Wealth Planning | 0 | −100,00 | 0 | |||||
| 2025-07-22 | 13F | Rockingstone Advisors LLC | 10 084 | −1,10 | 626 | 8,32 | ||||
| 2025-08-11 | 13F | Johnson Financial Group, LLC | 49 483 | −19,30 | 3 069 | −11,61 | ||||
| 2025-08-14 | 13F | Qube Research & Technologies Ltd | 82 | 0,00 | 5 | 25,00 | ||||
| 2025-08-07 | 13F | Allworth Financial LP | 1 505 | 0,00 | 93 | 10,71 | ||||
| 2025-08-07 | 13F | Cascade Financial Partners, LLC | 33 645 | 34,34 | 2 087 | 47,18 | ||||
| 2025-07-25 | 13F | Atria Wealth Solutions, Inc. | 3 876 | 243 | ||||||
| 2025-07-14 | 13F | AdvisorNet Financial, Inc | 1 045 | 1,06 | 65 | 10,34 | ||||
| 2025-07-16 | 13F | Perigon Wealth Management, LLC | 8 321 | 4,71 | 516 | 14,67 | ||||
| 2025-07-25 | 13F | Investment Advisory Group, LLC | 3 231 | 200 | ||||||
| 2025-07-22 | 13F | Sage Financial Group Inc | 3 305 | 205 | ||||||
| 2025-08-14 | 13F | Ameriprise Financial Inc | 102 289 | −27,16 | 6 345 | −20,22 | ||||
| 2025-04-24 | 13F | Wright Fund Managment, LLC | 0 | −100,00 | 0 | |||||
| 2025-07-25 | NP | USBSX - Cornerstone Moderate Fund | 34 497 | 0,00 | 2 052 | 4,06 | ||||
| 2025-08-14 | 13F | Guardian Wealth Advisors, Llc / Nc | 10 | 0,00 | 1 | |||||
| 2025-08-13 | 13F | Baird Financial Group, Inc. | 50 941 | 1,01 | 3 160 | 10,65 | ||||
| 2025-08-11 | 13F | Private Advisor Group, LLC | 4 539 | −2,97 | 282 | 6,44 | ||||
| 2025-08-14 | 13F | Beaird Harris Wealth Management, LLC | 801 | −20,06 | 50 | −12,50 | ||||
| 2025-08-28 | NP | EDGI - 3EDGE Dynamic International Equity ETF | 21 148 | 155,60 | 1 312 | 180,13 | ||||
| 2025-09-04 | 13F/A | Advisor Group Holdings, Inc. | 19 765 | 5,28 | 1 222 | 14,86 | ||||
| 2025-04-22 | 13F | Veridan Wealth LLC | 0 | −100,00 | 0 | |||||
| 2025-07-16 | 13F | Essex Financial Services, Inc. | 13 230 | 0,00 | 821 | 9,48 | ||||
| 2025-08-12 | 13F | Mustico Financial Group, Inc. | 30 569 | 1 940 | ||||||
| 2025-08-14 | 13F | GWM Advisors LLC | 1 521 | −3,18 | 94 | 6,82 | ||||
| 2025-07-30 | 13F | Bogart Wealth, LLC | 58 700 | 6,94 | 3 641 | 17,15 | ||||
| 2025-07-15 | 13F | SJS Investment Consulting Inc. | 73 | 5 | ||||||
| 2025-05-29 | NP | Northern Lights Fund Trust - Sierra Tactical Risk Spectrum 30 Fund Instl Class | 0 | −100,00 | 0 | −100,00 | ||||
| 2025-04-14 | 13F | Greenspring Advisors, LLC | 6 092 | 43,00 | 345 | 38,15 | ||||
| 2025-05-29 | NP | Northern Lights Fund Trust - Sierra Tactical Risk Spectrum 70 Fund Investor Class | 0 | −100,00 | 0 | −100,00 | ||||
| 2025-05-29 | NP | Northern Lights Fund Trust - Sierra Tactical Risk Spectrum 50 Fund Investor Class | 0 | −100,00 | 0 | −100,00 | ||||
| 2025-05-29 | NP | SIRAX - Sierra Tactical All Asset Fund Class A | 0 | −100,00 | 0 | −100,00 | ||||
| 2025-07-23 | 13F | Watershed Private Wealth Llc | 3 387 | −36,64 | 210 | −30,46 | ||||
| 2025-08-15 | 13F | Equitable Holdings, Inc. | 42 557 | 0,92 | 2 640 | 10,56 | ||||
| 2025-08-08 | 13F | TD Capital Management LLC | 795 | 0,63 | 49 | 11,36 | ||||
| 2025-08-08 | 13F | Tortoise Investment Management, LLC | 62 673 | −2,22 | 3 888 | 7,11 | ||||
| 2025-08-20 | 13F | Forefront Wealth Partners, LLC | 0 | −100,00 | 0 | |||||
| 2025-08-11 | 13F | Aptus Capital Advisors, LLC | 1 072 | 0,00 | 66 | 10,00 | ||||
| 2025-08-14 | 13F | UBS Group AG | 34 929 | 14,07 | 2 167 | 24,91 | ||||
| 2025-08-06 | 13F | Rialto Wealth Management, LLC | 1 180 | 0,00 | 73 | 10,61 | ||||
| 2025-08-06 | 13F | North Capital, Inc. | 0 | −100,00 | 0 | |||||
| 2025-07-18 | 13F | Rogco, Lp | 224 | 0,00 | 14 | 8,33 | ||||
| 2025-05-12 | 13F | Independent Advisor Alliance | 0 | −100,00 | 0 | |||||
| 2025-07-11 | 13F | Farther Finance Advisors, LLC | 1 380 | 5,83 | 86 | 14,86 | ||||
| 2025-08-06 | 13F | Ipsen Advisor Group LLC | 4 916 | 1,05 | 305 | 10,55 | ||||
| 2025-08-12 | 13F | Proequities, Inc. | 0 | 0 | ||||||
| 2025-06-13 | 13F | Optima Capital Llc | 0 | −100,00 | 0 | −100,00 | ||||
| 2025-07-18 | 13F | Pure Financial Advisors, Inc. | 110 784 | −7,65 | 6 872 | 1,15 | ||||
| 2025-05-02 | 13F | Capital A Wealth Management, LLC | 0 | −100,00 | 0 | |||||
| 2025-08-19 | 13F | Advisory Services Network, LLC | 17 640 | −5,67 | 1 103 | 4,06 | ||||
| 2025-07-22 | 13F | Wealthcare Advisory Partners LLC | 5 629 | 1,41 | 349 | 11,15 | ||||
| 2025-07-14 | 13F | Maryland Capital Advisors Inc. | 23 688 | 3,40 | 1 469 | 13,26 | ||||
| 2025-08-14 | 13F | Mariner, LLC | 315 355 | 0,08 | 19 561 | 9,63 | ||||
| 2025-08-06 | 13F | Commonwealth Equity Services, Llc | 37 251 | −20,17 | 2 | 0,00 | ||||
| 2025-08-13 | 13F | Jones Financial Companies Lllp | 4 292 | −67,51 | 265 | −64,94 | ||||
| 2025-08-05 | 13F | Bank Of Montreal /can/ | 836 | 0,00 | 52 | 8,51 | ||||
| 2025-07-25 | NP | UCAGX - Cornerstone Aggressive Fund | 14 790 | 0,00 | 880 | 4,02 | ||||
| 2025-07-22 | 13F | Merit Financial Group, LLC | 49 262 | −6,43 | 3 056 | 2,48 | ||||
| 2025-07-25 | 13F | Cwm, Llc | 1 992 | 0,00 | 0 | |||||
| 2025-08-01 | 13F | Envestnet Asset Management Inc | 42 842 | 7,42 | 2 657 | 17,67 | ||||
| 2025-07-24 | 13F | Blair William & Co/il | 1 314 | −39,00 | 82 | −33,06 | ||||
| 2025-08-08 | 13F | Omega Financial Group, LLC | 10 665 | −0,33 | 662 | 9,26 | ||||
| 2025-08-08 | 13F | Capital Investment Advisory Services, LLC | 29 | 0,00 | 2 | 0,00 | ||||
| 2025-08-13 | 13F | Sepio Capital, LP | 42 561 | −0,21 | 2 640 | 9,32 | ||||
| 2025-08-12 | 13F | MAI Capital Management | 0 | −100,00 | 0 | |||||
| 2025-08-14 | 13F | Royal Bank Of Canada | 18 085 | −9,72 | 1 122 | −1,06 | ||||
| 2025-08-06 | 13F | First Horizon Advisors, Inc. | 6 309 | 0,00 | 391 | 9,52 | ||||
| 2025-08-15 | 13F | Resources Management Corp /ct/ /adv | 425 | 0,00 | 0 | |||||
| 2025-07-25 | 13F | Hemington Wealth Management | 703 | 0,72 | 0 | |||||
| 2025-08-14 | 13F | Citadel Advisors Llc | 11 932 | −61,61 | 740 | −57,93 | ||||
| 2025-07-30 | 13F | Whittier Trust Co Of Nevada Inc | 524 | 0,00 | 32 | 10,34 | ||||
| 2025-08-13 | 13F | Northwestern Mutual Wealth Management Co | 5 272 | 3,45 | 327 | 13,19 | ||||
| 2025-08-14 | 13F | Financial Strategies Group, Inc. | 36 654 | 5,22 | 2 299 | 21,14 | ||||
| 2025-08-13 | 13F | RPg Family Wealth Advisory, LLC | 55 082 | −2,42 | 3 417 | 6,88 | ||||
| 2025-08-14 | 13F | Citadel Advisors Llc | Put | 0 | −100,00 | 0 | ||||
| 2025-08-08 | 13F | JFG Wealth Management, LLC | 21 600 | −41,62 | 1 340 | −36,09 | ||||
| 2025-08-05 | 13F | Cassaday & Co Wealth Management LLC | 12 680 | −2,67 | 787 | 6,65 | ||||
| 2025-08-12 | 13F | Twin Focus Capital Partners, Llc | 0 | −100,00 | 0 | |||||
| 2025-08-14 | 13F | CoreCap Advisors, LLC | 549 | 0,00 | 34 | 9,68 | ||||
| 2025-07-08 | 13F | FF Advisors,LLC | 3 235 | 201 | ||||||
| 2025-07-21 | 13F | Life Planning Partners, Inc | 6 000 | 0,00 | 372 | 9,73 | ||||
| 2025-08-14 | 13F | Old Mission Capital Llc | 188 605 | 152,20 | 11 699 | 176,31 | ||||
| 2025-05-01 | 13F | Quest 10 Wealth Builders, Inc. | 129 | −57,84 | 7 | −58,82 | ||||
| 2025-08-19 | 13F | National Asset Management, Inc. | 3 590 | −59,30 | 223 | −56,98 | ||||
| 2025-08-14 | 13F | Raymond James Financial Inc | 24 130 | −20,57 | 1 497 | −13,02 | ||||
| 2025-05-15 | 13F | Glenmede Trust Co Na | 0 | −100,00 | 0 | −100,00 | ||||
| 2025-08-14 | 13F | Fmr Llc | 960 | −1,13 | 60 | 9,26 | ||||
| 2025-08-14 | 13F | Mml Investors Services, Llc | 45 946 | 4,14 | 3 | 0,00 | ||||
| 2025-05-12 | 13F | Kohmann Bosshard Financial Services, LLC | 0 | −100,00 | 0 | |||||
| 2025-07-17 | 13F | Michels Family Financial, LLC | 17 965 | 3,18 | 1 114 | 12,98 | ||||
| 2025-07-09 | 13F | Massmutual Trust Co Fsb/adv | 460 | 0,00 | 29 | 7,69 | ||||
| 2025-08-04 | 13F | Assetmark, Inc | 20 | −96,68 | 1 | −97,06 | ||||
| 2025-08-12 | 13F | O'shaughnessy Asset Management, Llc | 2 147 | 0,00 | 133 | 9,92 | ||||
| 2025-07-25 | 13F | Index Fund Advisors, Inc. | 8 518 | 0,97 | 528 | 10,69 | ||||
| 2025-08-07 | 13F | Resources Investment Advisors, LLC. | 32 174 | −4,00 | 1 996 | 5,17 | ||||
| 2025-08-11 | 13F | Regal Investment Advisors LLC | 25 502 | 10,55 | 1 582 | 21,06 | ||||
| 2025-07-30 | 13F | Rehmann Capital Advisory Group | 4 810 | 0,00 | 298 | 9,56 | ||||
| 2025-08-26 | NP | EQ ADVISORS TRUST - EQ/All Asset Growth Allocation Portfolio Class IB | 37 945 | 0,00 | 2 354 | 9,54 | ||||
| 2025-07-09 | 13F | Alesco Advisors Llc | 12 041 | −2,31 | 747 | 6,88 | ||||
| 2025-08-13 | 13F | Continuum Advisory, LLC | 0 | −100,00 | 0 | |||||
| 2025-08-04 | 13F | Daymark Wealth Partners, Llc | 4 000 | 0,00 | 248 | 9,73 | ||||
| 2025-08-12 | 13F | Global Retirement Partners, LLC | 189 | 0,00 | 12 | 0,00 | ||||
| 2025-07-31 | 13F | 180 Wealth Advisors, Llc | 6 827 | 4,04 | 423 | 14,02 | ||||
| 2025-08-18 | 13F | N.E.W. Advisory Services LLC | 83 731 | −35,88 | 5 194 | −29,77 | ||||
| 2025-08-05 | 13F | Huntington National Bank | 0 | |||||||
| 2025-05-08 | 13F | We Are One Seven, LLC | 0 | −100,00 | 0 | |||||
| 2025-08-11 | 13F | Principal Securities, Inc. | 5 471 | 2,55 | 339 | 8,65 | ||||
| 2025-08-14 | 13F | Wells Fargo & Company/mn | 208 144 | 3,31 | 12 911 | 13,17 | ||||
| 2025-08-14 | 13F | Susquehanna International Group, Llp | Call | 4 600 | 285 | |||||
| 2025-07-24 | 13F | CarsonAllaria Wealth Management, Ltd. | 31 669 | −10,26 | 1 964 | −1,70 | ||||
| 2025-08-14 | 13F | Susquehanna International Group, Llp | 70 450 | 7,99 | 4 370 | 18,30 | ||||
| 2025-07-17 | 13F | Cyr Financial Inc. | 77 657 | 11,20 | 4 817 | 21,83 | ||||
| 2025-07-30 | 13F | Whittier Trust Co | 5 528 | −4,13 | 343 | 4,91 | ||||
| 2025-08-14 | 13F | Summit Trail Advisors, Llc | 11 382 | −5,89 | 706 | 3,22 | ||||
| 2025-07-31 | 13F | Kathleen S. Wright Associates Inc. | 24 116 | −7,95 | 1 496 | 0,81 | ||||
| 2025-07-25 | NP | USCRX - Cornerstone Moderately Aggressive Fund | 107 983 | 0,00 | 6 423 | 4,08 | ||||
| 2025-08-12 | 13F | Integrated Advisors Network LLC | 3 439 | −33,08 | 213 | −26,80 | ||||
| 2025-08-14 | 13F | Cardiff Park Advisors, Llc | 1 203 | 0,00 | 75 | 8,82 | ||||
| 2025-08-15 | 13F | Morgan Stanley | 258 021 | 8,27 | 16 005 | 18,60 | ||||
| 2025-08-14 | 13F | Quantinno Capital Management LP | 6 984 | 19,45 | 433 | 30,82 | ||||
| 2025-07-25 | NP | UCMCX - Cornerstone Moderately Conservative Fund | 7 496 | 0,00 | 446 | 3,97 | ||||
| 2025-07-31 | 13F | Buckingham Strategic Partners | 3 252 | 202 | ||||||
| 2025-08-12 | 13F | White Pine Capital Llc | 7 400 | 0,00 | 459 | 9,55 | ||||
| 2025-08-14 | 13F | Bank Of America Corp /de/ | 744 468 | −1,58 | 46 179 | 7,81 | ||||
| 2025-08-13 | 13F | Beacon Pointe Advisors, LLC | 36 947 | 23,33 | 2 292 | 35,08 | ||||
| 2025-07-21 | 13F | Empirical Financial Services, LLC d.b.a. Empirical Wealth Management | 194 041 | 4,87 | 12 036 | 14,88 | ||||
| 2025-08-13 | 13F | Smith, Moore & Co. | 15 843 | −0,98 | 983 | 8,39 | ||||
| 2025-07-07 | 13F | Investors Research Corp | 45 | 0,00 | 3 | 0,00 | ||||
| 2025-07-14 | 13F | Sowell Financial Services LLC | 5 605 | −23,45 | 348 | −16,18 | ||||
| 2025-07-08 | 13F | Apella Capital, LLC | 109 714 | 10,13 | 6 804 | 30,00 | ||||
| 2025-05-15 | 13F | Clark Capital Management Group, Inc. | 0 | −100,00 | 0 | |||||
| 2025-08-08 | 13F | Pnc Financial Services Group, Inc. | 173 | 0,00 | 11 | 11,11 | ||||
| 2025-07-14 | 13F | Sound Stewardship, LLC | 5 743 | 0,17 | 356 | 9,88 | ||||
| 2025-07-03 | 13F | Garde Capital, Inc. | 282 | 1,08 | 17 | 13,33 | ||||
| 2025-04-15 | 13F | Noble Wealth Management PBC | 1 700 | 0,00 | 96 | −3,03 | ||||
| 2025-08-08 | 13F | Cetera Investment Advisers | 34 052 | 21,74 | 2 112 | 33,33 | ||||
| 2025-08-14 | 13F | Colony Group, LLC | 6 401 | 1,73 | 397 | 11,52 | ||||
| 2025-07-22 | 13F | 4Thought Financial Group Inc. | 520 | 1,96 | 32 | 14,29 | ||||
| 2025-07-31 | 13F | BIP Wealth, LLC | 100 554 | −8,02 | 6 237 | 0,76 | ||||
| 2025-07-31 | 13F | Cabot Wealth Management Inc | 22 303 | 31,71 | 1 383 | 44,36 | ||||
| 2025-08-12 | 13F | LPL Financial LLC | 209 004 | −3,83 | 12 965 | 5,34 | ||||
| 2025-08-13 | 13F | Martin & Co Inc /tn/ | 39 101 | −0,92 | 2 425 | 8,55 | ||||
| 2025-05-08 | 13F | Plante Moran Financial Advisors, LLC | 0 | −100,00 | 0 | |||||
| 2025-08-05 | 13F | Bank of New York Mellon Corp | 4 024 | −48,95 | 250 | −44,17 | ||||
| 2025-08-14 | 13F | Hancock Whitney Corp | 18 971 | 1 177 | ||||||
| 2025-08-07 | 13F | Addison Advisors LLC | 7 555 | −8,54 | 469 | 0,21 | ||||
| 2025-08-15 | 13F | CI Private Wealth, LLC | 15 864 | 102,81 | 984 | 122,62 | ||||
| 2025-07-29 | 13F | Stratos Wealth Partners, LTD. | 54 158 | 6,39 | 3 359 | 16,55 | ||||
| 2025-08-05 | 13F | Everest Management Corp. | 4 074 | 0,00 | 253 | 9,57 | ||||
| 2025-08-12 | 13F | Bokf, Na | 450 | 0,00 | 28 | 8,00 | ||||
| 2025-08-14 | 13F | Atomi Financial Group, Inc. | 10 836 | 1,53 | 672 | 11,26 | ||||
| 2025-08-18 | 13F | Geneos Wealth Management Inc. | 6 832 | 0,00 | 424 | 9,59 | ||||
| 2025-08-13 | 13F | Transce3nd, LLC | 16 | −48,39 | 1 | −100,00 | ||||
| 2025-07-24 | 13F | Cyndeo Wealth Partners, LLC | 3 365 | −7,61 | 209 | 0,97 | ||||
| 2025-08-12 | 13F | Coldstream Capital Management Inc | 0 | −100,00 | 0 | |||||
| 2025-08-12 | 13F | Archer Investment Corp | 16 | 0,00 | 1 | |||||
| 2025-07-31 | 13F | Cambridge Investment Research Advisors, Inc. | 7 918 | 5,19 | 0 | |||||
| 2025-04-09 | 13F | Hardin Capital Partners, LLC | 0 | −100,00 | 0 | |||||
| 2025-08-06 | 13F | Texas Yale Capital Corp. | 35 229 | 0,55 | 2 185 | 10,13 | ||||
| 2025-07-24 | 13F | rebel Financial LLC | 58 765 | 3 645 | ||||||
| 2025-08-12 | 13F | Waddell & Associates, Llc | 627 138 | 1,97 | 38 901 | 11,69 | ||||
| 2025-08-13 | 13F | Portland Global Advisors LLC | 3 260 | 202 | ||||||
| 2025-07-02 | 13F | Central Pacific Bank - Trust Division | 2 | 0,00 | 0 | |||||
| 2025-08-14 | 13F | Comerica Bank | 7 448 | 8,10 | 462 | 18,46 | ||||
| 2025-07-31 | 13F | Wealthfront Advisers Llc | 4 344 | −11,55 | 269 | −3,24 | ||||
| 2025-07-29 | 13F | Private Trust Co Na | 653 | 0,00 | 41 | 11,11 | ||||
| 2025-07-22 | 13F | Checchi Capital Advisers, LLC | 62 544 | 1,92 | 3 880 | 11,63 |