Grundläggande statistik
| Institutionella ägare | 149 total, 149 long only, 0 short only, 0 long/short - change of 3,45% MRQ |
| Genomsnittlig portföljallokering | 0.1631 % - change of −21,96% MRQ |
| Institutionella aktier (lång) | 14 008 758 (ex 13D/G) - change of −0,33MM shares −2,33% MRQ |
| Institutionellt värde (lång) | $ 325 118 USD ($1000) |
Institutionellt ägande och aktieägare
Eaton Vance Tax-Advantaged Dividend Income Fund (US:EVT) har 149 Institutionella ägare och aktieägare som har lämnat in 13D/G- eller 13F-formulär till Securities Exchange Commission (SEC). Dessa institut innehar totalt 14,008,758 aktier. Största aktieägare inkluderar Morgan Stanley, Bank Of America Corp /de/, UBS Group AG, McGowan Group Asset Management, Inc., Raymond James Financial Inc, 1607 Capital Partners, LLC, Wells Fargo & Company/mn, Joel Isaacson & Co., LLC, Karpus Management, Inc., and LPL Financial LLC .
Eaton Vance Tax-Advantaged Dividend Income Fund (NYSE:EVT) Institutionell ägarstruktur visar institutioners och fonders nuvarande positioner i företaget, samt de senaste förändringarna i positionernas storlek. Större aktieägare kan vara enskilda investerare, fonder, hedgefonder eller institutioner. Bilaga 13D visar att investeraren äger (eller ägde) mer än 5% av företaget och avser (eller avsåg) att aktivt eftersträva en förändring av affärsstrategin. Schedule 13G indikerar en passiv investering på över 5%.
The share price as of September 12, 2025 is 24,40 / share. Previously, on September 13, 2024, the share price was 23,96 / share. This represents an increase of 1,84% over that period.

Fondsentimentets poäng
Fondsentimentet poängen(fka Ägarackumulation-poäng) visar vilka aktier som är mest köpta av fonder. Det är resultatet av en sofistikerad kvantitativ flerfaktormodell som identifierar företag med de högsta nivåerna av institutionell ackumulering. Poängsättningsmodellen använder en kombination av den totala ökningen av redovisade ägare, förändringarna i portföljallokeringarna för dessa ägare och andra mått. Siffran sträcker sig från 0 till 100, där högre siffror indikerar en högre nivå av ackumulering i förhållande till sina konkurrenter, och 50 är genomsnittet.
Uppdateringsfrekvens: Dagligen
Se Ownership Explorer, som innehåller en lista över de högst rankade företagen.
Institutionell sälj/köp-kvot
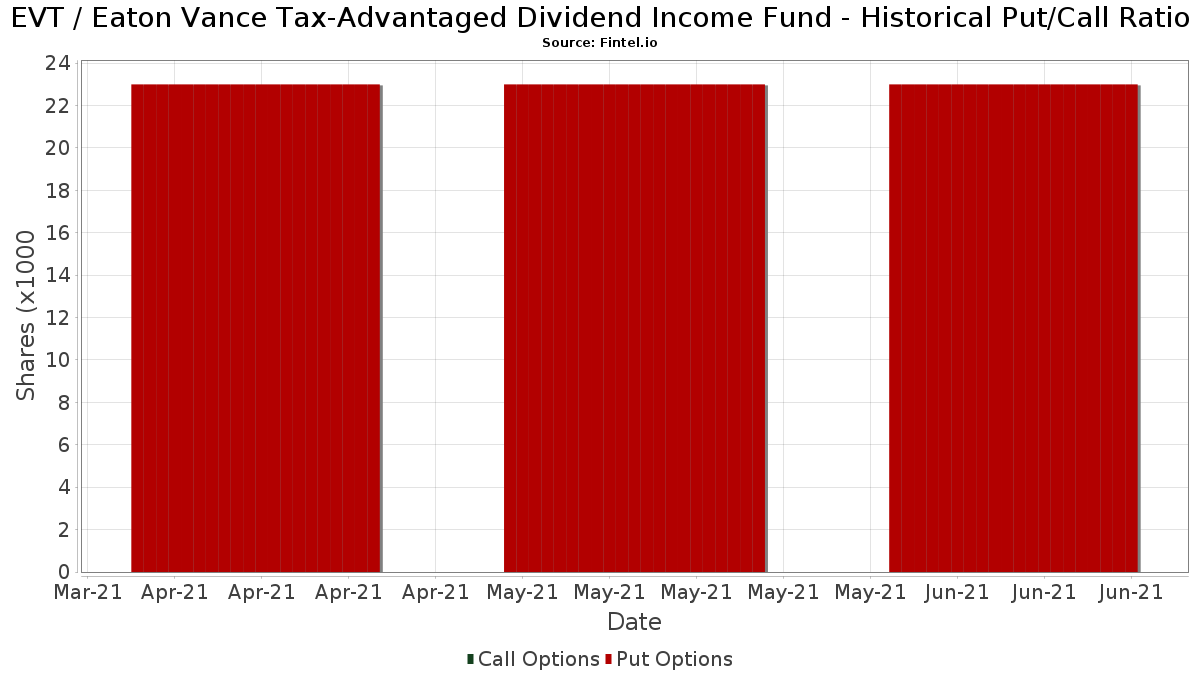
Förutom att rapportera vanliga eget kapital- och skuldemissioner måste institutioner med mer än 100MM tillgångar under förvaltning också avslöja sina innehav av sälj- och köpoptioner. Eftersom säljoptioner i allmänhet indikerar ett negativt sentiment och köpoptioner indikerar ett positivt sentiment, kan vi få en uppfattning om det övergripande institutionella sentimentet genom att plotta förhållandet mellan säljoptioner och köpoptioner. Diagrammet till höger visar det historiska förhållandet mellan sälj- och köpoptioner för detta instrument.
Genom att använda sälj/köp-kvoten som en indikator på aktieägarnas sentiment undviker man en av de största bristerna med att använda det totala institutionella ägandet, nämligen att en betydande del av de förvaltade tillgångarna investeras passivt för att följa index. Passivt förvaltade fonder köper vanligtvis inte optioner, så indikatorn för sälj/köp-kvoten ger en bättre bild av stämningen i aktivt förvaltade fonder.
13F- och NPORT-arkiveringar
Detaljer om 13F-arkiveringar är gratis. Detaljer om NP-arkiveringar kräver ett premiummedlemskap. Gröna rader indikerar nya positioner. Röda rader indikerar stängda positioner. Klicka på länk symbolen för att se hela transaktionshistoriken.
Uppgradera
för att låsa upp premiumdata och exportera till Excel ![]() .
.
| Fil Datum | Källa | Investerare | Typ | Genomsnittligt pris (beräknat) |
Aktier | Δ Aktier (%) |
Rapporterat värde (1000 USD) |
Δ Värde (%) |
Portföljallokering (%) |
|
|---|---|---|---|---|---|---|---|---|---|---|
| 2025-07-14 | 13F | Sowell Financial Services LLC | 26 797 | −11,06 | 646 | −7,99 | ||||
| 2025-08-14 | 13F | Parvin Asset Management, LLC | 2 350 | 0,00 | 57 | 3,70 | ||||
| 2025-08-12 | 13F | Richmond Investment Services, LLC | 34 684 | 100,75 | 836 | 107,71 | ||||
| 2025-08-14 | 13F | Mariner, LLC | 37 622 | 0,67 | 907 | 4,26 | ||||
| 2025-08-01 | 13F | Yukon Wealth Management, Inc. | 0 | −100,00 | 0 | |||||
| 2025-08-13 | 13F | Baird Financial Group, Inc. | 21 535 | 14,34 | 519 | 18,26 | ||||
| 2025-08-18 | 13F | N.E.W. Advisory Services LLC | 2 022 | −6,17 | 49 | −4,00 | ||||
| 2025-08-14 | 13F | Comerica Bank | 8 314 | −1,62 | 200 | 2,04 | ||||
| 2025-08-12 | 13F | Insigneo Advisory Services, Llc | 15 500 | 0,00 | 374 | 3,61 | ||||
| 2025-07-25 | NP | FCEF - First Trust CEF Income Opportunity ETF This fund is a listed as child fund of First Trust Advisors Lp and if that institution has disclosed ownership in this security, then these positions will not be double counted when calculating total shares and total value | 61 484 | 7,09 | 1 429 | 3,85 | ||||
| 2025-08-05 | 13F | GPS Wealth Strategies Group, LLC | 0 | −100,00 | 0 | |||||
| 2025-08-22 | NP | Cornerstone Strategic Value Fund Inc | 140 775 | −42,47 | 3 393 | −40,42 | ||||
| 2025-08-12 | 13F | J.w. Cole Advisors, Inc. | 10 292 | 248 | ||||||
| 2025-08-25 | 13F | Silverlake Wealth Management Llc | 21 769 | 0,00 | 525 | 3,56 | ||||
| 2025-07-14 | 13F | Bank & Trust Co | 2 729 | 0,00 | 66 | 3,17 | ||||
| 2025-07-15 | 13F | Mather Group, Llc. | 0 | −100,00 | 0 | |||||
| 2025-07-16 | 13F | Dakota Wealth Management | 9 340 | 0,00 | 225 | 3,69 | ||||
| 2025-05-14 | 13F | Venture Visionary Partners LLC | 0 | −100,00 | 0 | −100,00 | ||||
| 2025-08-14 | 13F | Hancock Whitney Corp | 10 663 | 0,00 | 257 | 3,23 | ||||
| 2025-07-14 | 13F | GAMMA Investing LLC | 1 500 | 0,00 | 36 | 5,88 | ||||
| 2025-07-29 | 13F | Salomon & Ludwin, LLC | 2 594 | 0,00 | 63 | 5,00 | ||||
| 2025-07-15 | 13F | North Star Investment Management Corp. | 12 260 | −7,37 | 295 | −3,91 | ||||
| 2025-08-06 | 13F | Commonwealth Equity Services, Llc | 203 309 | 2,92 | 5 | 0,00 | ||||
| 2025-08-12 | 13F | Jpmorgan Chase & Co | 136 | −27,27 | 3 | −25,00 | ||||
| 2025-08-14 | 13F | Millennium Management Llc | 0 | −100,00 | 0 | |||||
| 2025-08-06 | 13F | Prospera Financial Services Inc | 26 816 | −3,55 | 646 | 0,00 | ||||
| 2025-08-04 | 13F | Wolverine Asset Management Llc | 69 057 | 8,37 | 1 664 | 12,28 | ||||
| 2025-07-24 | 13F | Financial Security Advisor, Inc. | 12 000 | 9,09 | 289 | 13,33 | ||||
| 2025-05-13 | 13F | Sit Investment Associates Inc | 0 | −100,00 | 0 | |||||
| 2025-08-12 | 13F | NorthStar Asset Management LLC /NJ/ | 9 339 | −0,72 | 225 | 3,21 | ||||
| 2025-08-19 | 13F | Newbridge Financial Services Group, Inc. | 7 296 | 176 | ||||||
| 2025-08-11 | 13F | Private Advisor Group, LLC | 177 497 | −0,30 | 4 278 | 3,26 | ||||
| 2025-08-15 | 13F | Prevail Innovative Wealth Advisors, Llc | 66 918 | 13,71 | 1 613 | 17,75 | ||||
| 2025-07-24 | 13F | IFP Advisors, Inc | 1 700 | 0,00 | 41 | 2,56 | ||||
| 2025-08-13 | 13F | Kayne Anderson Rudnick Investment Management Llc | 10 000 | 0,00 | 241 | 3,88 | ||||
| 2025-07-31 | 13F | Cambridge Investment Research Advisors, Inc. | 70 641 | −20,63 | 2 | −50,00 | ||||
| 2025-08-01 | 13F | Envestnet Asset Management Inc | 11 567 | 279 | ||||||
| 2025-08-28 | NP | Cohen & Steers Closed-end Opportunity Fund, Inc. | 120 913 | −44,37 | 2 914 | −42,38 | ||||
| 2025-08-13 | 13F | McGowan Group Asset Management, Inc. | 833 437 | 0,51 | 20 086 | 4,09 | ||||
| 2025-07-08 | 13F | Morris Retirement Advisors, LLC | 85 401 | 3,53 | 2 058 | 7,24 | ||||
| 2025-07-17 | 13F | Johnson & White Wealth Management, LLC | 14 351 | 47,66 | 0 | |||||
| 2025-08-08 | 13F | Cornerstone Advisors, LLC | 184 683 | −35,69 | 4 451 | −33,41 | ||||
| 2025-08-14 | 13F | Polar Asset Management Partners Inc. | 242 141 | 124,90 | 5 836 | 132,93 | ||||
| 2025-07-16 | 13F | Formidable Asset Management, LLC | 148 841 | 0,00 | 3 464 | 0,00 | ||||
| 2025-08-14 | 13F | Wells Fargo & Company/mn | 675 255 | −1,05 | 16 274 | 2,48 | ||||
| 2025-08-12 | 13F | Cornerstone Wealth Management, LLC | 22 470 | 102,61 | 542 | 109,69 | ||||
| 2025-07-22 | 13F/A | Kingstone Capital Partners Texas, LLC | 300 527 | −10,17 | 7 243 | −6,96 | ||||
| 2025-08-04 | 13F | Spire Wealth Management | 113 200 | 4,79 | 2 728 | 8,56 | ||||
| 2025-08-14 | 13F | Karpus Management, Inc. | 629 393 | −0,93 | 15 168 | 2,60 | ||||
| 2025-07-17 | 13F | Vermillion Wealth Management, Inc. | 832 | 0,00 | 20 | 5,26 | ||||
| 2025-07-22 | 13F | Kessler Investment Group, LLC | 2 024 | −5,60 | 49 | −2,04 | ||||
| 2025-08-20 | NP | ADANX - AQR Diversified Arbitrage Fund Class N | 34 041 | −38,25 | 820 | −36,04 | ||||
| 2025-07-10 | 13F | Wealth Enhancement Advisory Services, Llc | 199 482 | 15,36 | 4 867 | 20,98 | ||||
| 2025-08-13 | 13F | Invesco Ltd. | 20 311 | 0,17 | 489 | 3,82 | ||||
| 2025-07-16 | 13F | ORG Partners LLC | 1 742 | 0,00 | 42 | 5,00 | ||||
| 2025-08-12 | 13F | Heritage Trust Co | 14 888 | −16,83 | 359 | −13,94 | ||||
| 2025-08-13 | 13F | Guggenheim Capital Llc | 357 795 | −5,07 | 8 623 | −1,69 | ||||
| 2025-08-15 | 13F | Morgan Stanley | 930 631 | −0,78 | 22 428 | 2,76 | ||||
| 2025-08-14 | 13F | Colony Group, LLC | 16 862 | −32,31 | 406 | −29,88 | ||||
| 2025-08-13 | 13F | EverSource Wealth Advisors, LLC | 750 | 0,00 | 18 | 5,88 | ||||
| 2025-04-23 | 13F | GHP Investment Advisors, Inc. | 0 | −100,00 | 0 | |||||
| 2025-07-29 | 13F | Stratos Wealth Partners, LTD. | 342 599 | 0,67 | 8 257 | 4,26 | ||||
| 2025-08-11 | 13F | Blue Bell Private Wealth Management, Llc | 900 | 22 | ||||||
| 2025-07-23 | 13F | Joel Isaacson & Co., LLC | 658 913 | −3,56 | 15 880 | −0,13 | ||||
| 2025-08-14 | 13F | Ameriprise Financial Inc | 311 391 | 11,93 | 7 506 | 15,93 | ||||
| 2025-08-14 | 13F | Cnh Partners Llc | 89 732 | −52,65 | 2 163 | −50,36 | ||||
| 2025-08-12 | 13F | CIBC Private Wealth Group, LLC | 2 702 | 0,00 | 65 | 18,18 | ||||
| 2025-07-23 | 13F | Prime Capital Investment Advisors, LLC | 24 251 | −7,00 | 584 | −3,63 | ||||
| 2025-08-12 | 13F | Proequities, Inc. | 0 | 0 | ||||||
| 2025-08-14 | 13F | Snowden Capital Advisors LLC | 21 264 | 0,00 | 512 | 3,64 | ||||
| 2025-08-27 | NP | RYMSX - Guggenheim Multi-Hedge Strategies Fund Class P | 79 | −37,30 | 2 | −50,00 | ||||
| 2025-07-29 | 13F | Commons Capital, Llc | 12 423 | 0,75 | 299 | 4,55 | ||||
| 2025-08-15 | 13F | Tower Research Capital LLC (TRC) | 1 | −90,91 | 0 | |||||
| 2025-08-13 | 13F | Denver Wealth Management, Inc. | 22 689 | −2,12 | 547 | 1,30 | ||||
| 2025-07-25 | 13F | Allspring Global Investments Holdings, LLC | 29 519 | 101,14 | 711 | 108,50 | ||||
| 2025-08-13 | 13F | Northwestern Mutual Wealth Management Co | 1 779 | −28,84 | 43 | −27,59 | ||||
| 2025-08-14 | 13F | Royal Bank Of Canada | 211 425 | 0,01 | 5 096 | 3,60 | ||||
| 2025-08-14 | 13F | Stifel Financial Corp | 55 800 | 3,96 | 1 345 | 7,61 | ||||
| 2025-08-11 | 13F | Principal Securities, Inc. | 950 | 72,73 | 23 | 69,23 | ||||
| 2025-08-13 | 13F | Cresset Asset Management, LLC | 9 264 | 2,15 | 223 | 5,69 | ||||
| 2025-08-07 | 13F | BOK Financial Private Wealth, Inc. | 1 719 | 0,00 | 41 | 2,50 | ||||
| 2025-08-12 | 13F | Advisors Asset Management, Inc. | 251 748 | 1,05 | 6 067 | 4,66 | ||||
| 2025-07-31 | 13F | Oppenheimer & Co Inc | 29 847 | 64,29 | 719 | 70,38 | ||||
| 2025-08-06 | 13F | Smh Capital Advisors Inc | 8 884 | −1,86 | 214 | 1,90 | ||||
| 2025-08-13 | 13F | First Trust Advisors Lp | 124 258 | 2,58 | 2 995 | 6,25 | ||||
| 2025-04-29 | 13F | Truist Financial Corp | 0 | −100,00 | 0 | |||||
| 2025-04-08 | 13F | Parallel Advisors, LLC | 0 | −100,00 | 0 | −100,00 | ||||
| 2025-08-08 | 13F | 1776 Wealth LLC | 72 608 | −0,82 | 1 750 | 2,70 | ||||
| 2025-08-14 | 13F | CoreCap Advisors, LLC | 4 129 | 0,00 | 100 | 3,13 | ||||
| 2025-07-07 | 13F | Wealth Alliance Advisory Group, LLC | 17 037 | 0,00 | 411 | 3,54 | ||||
| 2025-07-21 | 13F | Future Financial Wealth Managment LLC | 1 468 | 2,16 | 35 | 6,06 | ||||
| 2025-08-18 | 13F | Hollencrest Capital Management | 37 855 | 0,00 | 912 | 3,64 | ||||
| 2025-04-29 | 13F | Penserra Capital Management LLC | 0 | −100,00 | 0 | |||||
| 2025-07-10 | 13F | Perkins Coie Trust Co | 500 | 0,00 | 12 | 9,09 | ||||
| 2025-08-11 | 13F | Elequin Capital Lp | 1 275 | 31 | ||||||
| 2025-08-08 | 13F | Pnc Financial Services Group, Inc. | 12 751 | −41,14 | 307 | −39,09 | ||||
| 2025-06-27 | NP | Calamos ETF Trust - Calamos CEF Income & Arbitrage ETF | 12 903 | −11,54 | 287 | −19,83 | ||||
| 2025-08-12 | 13F | Steward Partners Investment Advisory, Llc | 93 018 | −8,23 | 2 242 | −4,96 | ||||
| 2025-08-08 | 13F | Avantax Advisory Services, Inc. | 19 909 | 3,15 | 480 | 6,68 | ||||
| 2025-07-08 | 13F | Nbc Securities, Inc. | 4 350 | 0,00 | 0 | |||||
| 2025-07-11 | 13F | Farther Finance Advisors, LLC | 803 | 0,00 | 19 | 5,56 | ||||
| 2025-07-25 | 13F | Concurrent Investment Advisors, LLC | 11 511 | 14,75 | 277 | 18,88 | ||||
| 2025-07-28 | 13F | RFG Advisory, LLC | 24 901 | −24,68 | 600 | −21,98 | ||||
| 2025-04-15 | 13F | Fifth Third Bancorp | 0 | −100,00 | 0 | −100,00 | ||||
| 2025-08-14 | 13F | Two Sigma Investments, Lp | 81 682 | 1 969 | ||||||
| 2025-07-25 | 13F | Cwm, Llc | 6 221 | 0,00 | 0 | |||||
| 2025-07-15 | 13F | Xcel Wealth Management, LLC | 11 370 | 0,00 | 274 | 3,79 | ||||
| 2025-08-07 | 13F | Allworth Financial LP | 9 863 | −0,10 | 238 | 9,22 | ||||
| 2025-07-17 | 13F | Sound Income Strategies, LLC | 298 | 10,78 | 7 | 16,67 | ||||
| 2025-08-14 | 13F | Wiley Bros.-aintree Capital, Llc | 42 399 | 164,93 | 1 022 | 175,95 | ||||
| 2025-08-06 | 13F | Stonebridge Financial Planning Group, LLC | 13 403 | 3,10 | 323 | 6,95 | ||||
| 2025-08-12 | 13F | Financial Advocates Investment Management | 0 | −100,00 | 0 | |||||
| 2025-07-21 | 13F | Kennebec Savings Bank | 589 | 0,00 | 14 | 7,69 | ||||
| 2025-08-14 | 13F/A | Rockefeller Capital Management L.P. | 217 388 | −0,82 | 5 239 | 2,73 | ||||
| 2025-08-14 | 13F | Aqr Capital Management Llc | 22 505 | 542 | ||||||
| 2025-05-08 | 13F | Plante Moran Financial Advisors, LLC | 0 | −100,00 | 0 | |||||
| 2025-07-16 | 13F | St Germain D J Co Inc | 293 | 0,00 | 7 | 16,67 | ||||
| 2025-07-28 | 13F | Harbour Investments, Inc. | 3 450 | 0,00 | 83 | 3,75 | ||||
| 2025-08-08 | 13F | Meridian Wealth Management, LLC | 38 483 | 13,88 | 927 | 17,94 | ||||
| 2025-08-14 | 13F | Mml Investors Services, Llc | 47 885 | 8,26 | 1 | 0,00 | ||||
| 2025-09-04 | 13F/A | Advisor Group Holdings, Inc. | 227 074 | 7,61 | 5 473 | 11,45 | ||||
| 2025-07-17 | 13F | Janney Montgomery Scott LLC | 48 380 | 1,97 | 1 | 0,00 | ||||
| 2025-08-07 | 13F | Vista Investment Partners Ii, Llc | 8 496 | 205 | ||||||
| 2025-06-30 | 13F/A | Deutsche Bank Ag\ | 0 | −100,00 | 0 | |||||
| 2025-07-24 | 13F | Us Bancorp \de\ | 8 200 | 0,00 | 198 | 3,68 | ||||
| 2025-07-09 | 13F | Dynamic Advisor Solutions LLC | 10 890 | 4,56 | 262 | 8,26 | ||||
| 2025-07-21 | 13F | Ameritas Advisory Services, LLC | 2 700 | 65 | ||||||
| 2025-08-14 | 13F | 1607 Capital Partners, LLC | 750 342 | 35,99 | 18 083 | 40,84 | ||||
| 2025-08-27 | NP | RYDEX VARIABLE TRUST - Multi-Hedge Strategies Fund Variable Annuity | 133 | −18,40 | 3 | 0,00 | ||||
| 2025-08-13 | 13F | Jones Financial Companies Lllp | 60 | 1 | ||||||
| 2025-08-14 | 13F | MGB Wealth Management, LLC | 11 467 | −36,06 | 276 | −34,91 | ||||
| 2025-05-05 | 13F | Transce3nd, LLC | 0 | −100,00 | 0 | |||||
| 2025-08-08 | 13F | Cetera Investment Advisers | 123 973 | 3,28 | 2 988 | 6,95 | ||||
| 2025-08-14 | 13F | Raymond James Financial Inc | 829 247 | 17,15 | 19 985 | 21,33 | ||||
| 2025-08-08 | 13F | TD Capital Management LLC | 631 | 0,00 | 15 | 7,14 | ||||
| 2025-08-22 | NP | Cornerstone Total Return Fund Inc | 43 908 | 3,29 | 1 058 | 6,98 | ||||
| 2025-08-04 | 13F | Kovack Advisors, Inc. | 17 132 | 413 | ||||||
| 2025-08-12 | 13F | LPL Financial LLC | 434 417 | 1,58 | 10 469 | 5,19 | ||||
| 2025-08-04 | 13F | Live Oak Private Wealth LLC | 24 589 | 0,00 | 593 | 3,50 | ||||
| 2025-08-12 | 13F | Putnam Fl Investment Management Co | 20 000 | 0,00 | 482 | 3,66 | ||||
| 2025-08-14 | 13F | Cohen & Steers, Inc. | 117 413 | −45,98 | 3 | −60,00 | ||||
| 2025-07-07 | 13F | Investors Research Corp | 3 145 | 0,00 | 76 | 2,74 | ||||
| 2025-08-14 | 13F | Fiduciary Trust Co | 15 457 | 0,00 | 373 | 3,62 | ||||
| 2025-07-25 | 13F | Atria Wealth Solutions, Inc. | 13 712 | 17,72 | 330 | 21,77 | ||||
| 2025-08-14 | 13F | UBS Group AG | 883 785 | −4,49 | 21 299 | −1,08 | ||||
| 2025-08-05 | 13F | Huntington National Bank | 0 | |||||||
| 2025-08-14 | 13F | Bank Of America Corp /de/ | 927 449 | 1,93 | 22 352 | 5,56 | ||||
| 2025-08-07 | 13F | Readystate Asset Management Lp | 10 435 | 251 | ||||||
| 2025-08-05 | 13F | Shaker Financial Services, LLC | 117 919 | −59,14 | 2 842 | −57,69 | ||||
| 2025-08-14 | 13F | GWM Advisors LLC | 14 331 | 174,38 | 345 | 185,12 | ||||
| 2025-08-15 | 13F | CI Private Wealth, LLC | 27 827 | 0,00 | 671 | 3,55 | ||||
| 2025-07-22 | 13F | Accel Wealth Management | 108 641 | −1,27 | 2 618 | 2,27 | ||||
| 2025-08-12 | 13F | Founders Financial Alliance, LLC | 35 108 | 1,37 | 846 | 5,09 | ||||
| 2025-08-07 | 13F | Kestra Private Wealth Services, Llc | 12 761 | −12,55 | 308 | −9,44 | ||||
| 2025-08-08 | 13F | Kingsview Wealth Management, LLC | 14 103 | 0,06 | 340 | 3,35 | ||||
| 2025-08-12 | 13F | AlphaCore Capital LLC | 13 316 | 9,46 | 321 | 13,07 | ||||
| 2025-08-11 | 13F | HighTower Advisors, LLC | 49 918 | 0,61 | 1 203 | 4,25 | ||||
| 2025-07-14 | 13F | Armstrong Advisory Group, Inc | 544 | 13 | ||||||
| 2025-08-13 | 13F | Summit Financial, LLC | 18 740 | 452 | ||||||
| 2025-08-12 | 13F | Virtu Financial LLC | 0 | −100,00 | 0 | |||||
| 2025-08-12 | 13F | MAI Capital Management | 492 | 0,00 | 12 | 0,00 | ||||
| 2025-07-22 | 13F | DAVENPORT & Co LLC | 18 899 | −4,06 | 455 | −0,66 | ||||
| 2025-08-29 | 13F | Evolution Wealth Management Inc. | 371 | 9 | ||||||
| 2025-08-04 | 13F | Hantz Financial Services, Inc. | 2 | 0 | ||||||
| 2025-07-29 | 13F | Private Trust Co Na | 5 136 | 0,67 | 124 | 4,24 | ||||
| 2025-08-08 | 13F | Calamos Advisors LLC | 12 903 | −8,00 | 311 | −4,91 | ||||
| 2025-08-05 | 13F | Summit Investment Advisory Services, LLC | 0 | −100,00 | 0 | |||||
| 2025-08-08 | 13F | Creative Planning | 24 736 | 13,76 | 596 | 18,02 |