Grundläggande statistik
| Institutionella ägare | 139 total, 139 long only, 0 short only, 0 long/short - change of 0,72% MRQ |
| Genomsnittlig portföljallokering | 0.1294 % - change of −32,36% MRQ |
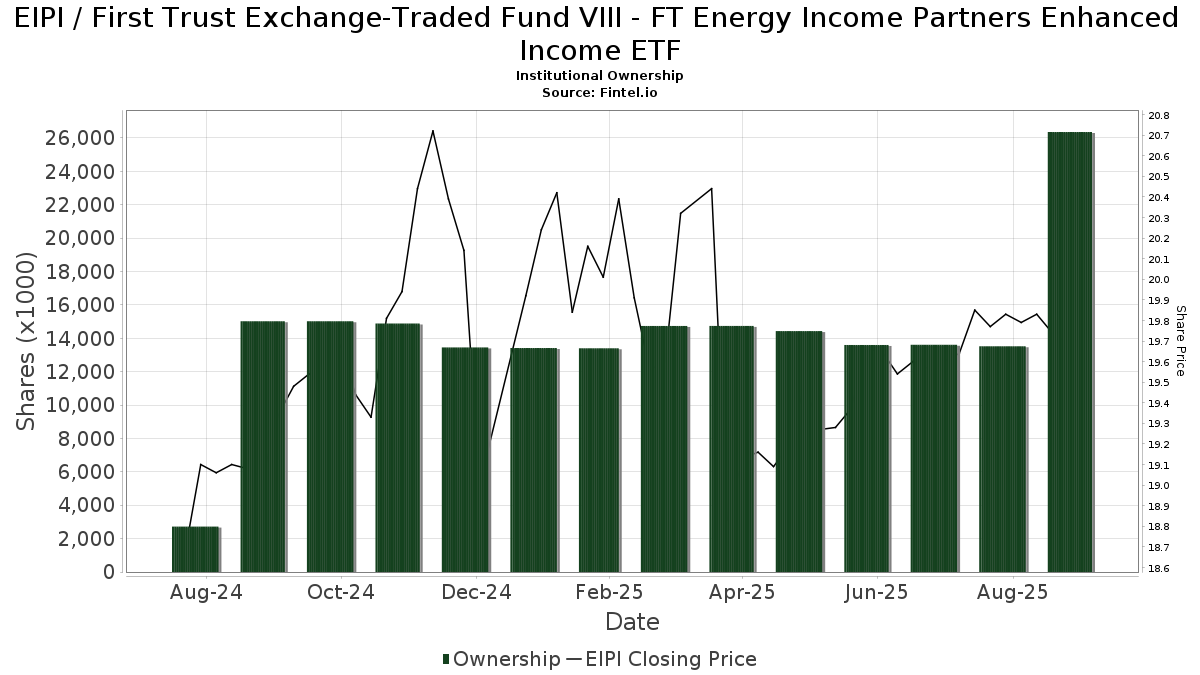
| Institutionella aktier (lång) | 26 352 745 (ex 13D/G) - change of 12,83MM shares 94,94% MRQ |
| Institutionellt värde (lång) | $ 267 782 USD ($1000) |
Institutionellt ägande och aktieägare
First Trust Exchange-Traded Fund VIII - FT Energy Income Partners Enhanced Income ETF (US:EIPI) har 139 Institutionella ägare och aktieägare som har lämnat in 13D/G- eller 13F-formulär till Securities Exchange Commission (SEC). Dessa institut innehar totalt 26,352,745 aktier. Största aktieägare inkluderar Proficio Capital Partners LLC, Morgan Stanley, LPL Financial LLC, Coastal Bridge Advisors, LLC, UBS Group AG, Wealthspire Advisors, LLC, Modern Wealth Management, LLC, Royal Bank Of Canada, Raymond James Financial Inc, and Advisors Asset Management, Inc. .
First Trust Exchange-Traded Fund VIII - FT Energy Income Partners Enhanced Income ETF (ARCA:EIPI) Institutionell ägarstruktur visar institutioners och fonders nuvarande positioner i företaget, samt de senaste förändringarna i positionernas storlek. Större aktieägare kan vara enskilda investerare, fonder, hedgefonder eller institutioner. Bilaga 13D visar att investeraren äger (eller ägde) mer än 5% av företaget och avser (eller avsåg) att aktivt eftersträva en förändring av affärsstrategin. Schedule 13G indikerar en passiv investering på över 5%.
The share price as of September 8, 2025 is 19,50 / share. Previously, on September 9, 2024, the share price was 18,99 / share. This represents an increase of 2,69% over that period.
Fondsentimentets poäng
Fondsentimentet poängen(fka Ägarackumulation-poäng) visar vilka aktier som är mest köpta av fonder. Det är resultatet av en sofistikerad kvantitativ flerfaktormodell som identifierar företag med de högsta nivåerna av institutionell ackumulering. Poängsättningsmodellen använder en kombination av den totala ökningen av redovisade ägare, förändringarna i portföljallokeringarna för dessa ägare och andra mått. Siffran sträcker sig från 0 till 100, där högre siffror indikerar en högre nivå av ackumulering i förhållande till sina konkurrenter, och 50 är genomsnittet.
Uppdateringsfrekvens: Dagligen
Se Ownership Explorer, som innehåller en lista över de högst rankade företagen.
Institutionell sälj/köp-kvot
Förutom att rapportera vanliga eget kapital- och skuldemissioner måste institutioner med mer än 100MM tillgångar under förvaltning också avslöja sina innehav av sälj- och köpoptioner. Eftersom säljoptioner i allmänhet indikerar ett negativt sentiment och köpoptioner indikerar ett positivt sentiment, kan vi få en uppfattning om det övergripande institutionella sentimentet genom att plotta förhållandet mellan säljoptioner och köpoptioner. Diagrammet till höger visar det historiska förhållandet mellan sälj- och köpoptioner för detta instrument.
Genom att använda sälj/köp-kvoten som en indikator på aktieägarnas sentiment undviker man en av de största bristerna med att använda det totala institutionella ägandet, nämligen att en betydande del av de förvaltade tillgångarna investeras passivt för att följa index. Passivt förvaltade fonder köper vanligtvis inte optioner, så indikatorn för sälj/köp-kvoten ger en bättre bild av stämningen i aktivt förvaltade fonder.
13F- och NPORT-arkiveringar
Detaljer om 13F-arkiveringar är gratis. Detaljer om NP-arkiveringar kräver ett premiummedlemskap. Gröna rader indikerar nya positioner. Röda rader indikerar stängda positioner. Klicka på länk symbolen för att se hela transaktionshistoriken.
Uppgradera
för att låsa upp premiumdata och exportera till Excel ![]() .
.
| Fil Datum | Källa | Investerare | Typ | Genomsnittligt pris (beräknat) |
Aktier | Δ Aktier (%) |
Rapporterat värde (1000 USD) |
Δ Värde (%) |
Portföljallokering (%) |
|
|---|---|---|---|---|---|---|---|---|---|---|
| 2025-07-09 | 13F | Fiduciary Alliance LLC | 15 449 | −2,00 | 305 | −4,70 | ||||
| 2025-08-08 | 13F | Compass Wealth Management LLC | 0 | −100,00 | 0 | |||||
| 2025-08-14 | 13F | Royal Bank Of Canada | 759 049 | −18,33 | 14 968 | −20,63 | ||||
| 2025-08-14 | 13F | Old Mission Capital Llc | 61 342 | 163,93 | 1 210 | 156,69 | ||||
| 2025-07-11 | 13F | Farther Finance Advisors, LLC | 580 | −84,88 | 11 | −85,90 | ||||
| 2025-07-21 | 13F | Ameriflex Group, Inc. | 0 | −100,00 | 0 | |||||
| 2025-07-30 | 13F | Nottingham Advisors, Inc. | 126 732 | 0,69 | 2 499 | −2,12 | ||||
| 2025-08-04 | 13F | Kovack Advisors, Inc. | 12 786 | −4,12 | 252 | −6,67 | ||||
| 2025-08-08 | 13F | Kingsview Wealth Management, LLC | 126 039 | 0,13 | 2 485 | −2,70 | ||||
| 2025-08-05 | 13F | EPG Wealth Management LLC | 0 | −100,00 | 0 | |||||
| 2025-07-30 | 13F | D.a. Davidson & Co. | 84 613 | 19,00 | 1 669 | 15,67 | ||||
| 2025-07-31 | 13F | Cambridge Investment Research Advisors, Inc. | 289 673 | −10,53 | 6 | −16,67 | ||||
| 2025-05-12 | 13F | Richard W. Paul & Associates, LLC | 0 | −100,00 | 0 | |||||
| 2025-08-12 | 13F | Bokf, Na | 2 137 | −78,07 | 42 | −78,68 | ||||
| 2025-05-15 | 13F | Tower Research Capital LLC (TRC) | 0 | −100,00 | 0 | |||||
| 2025-08-19 | 13F | National Asset Management, Inc. | 11 017 | −16,71 | 217 | −15,56 | ||||
| 2025-09-04 | 13F/A | Advisor Group Holdings, Inc. | 264 480 | 20,06 | 5 213 | 16,65 | ||||
| 2025-07-30 | 13F | Princeton Global Asset Management LLC | 1 790 | 0,00 | 35 | −2,78 | ||||
| 2025-08-14 | 13F | UBS Group AG | 870 211 | −6,92 | 17 161 | −9,54 | ||||
| 2025-08-14 | 13F | Mariner, LLC | 16 237 | 320 | ||||||
| 2025-08-13 | 13F | Latash Investments, LLC | 32 168 | 0,00 | 634 | −2,76 | ||||
| 2025-07-23 | 13F | Kingswood Wealth Advisors, Llc | 79 520 | −4,45 | 1 568 | −7,11 | ||||
| 2025-07-18 | 13F | SOA Wealth Advisors, LLC. | 196 | 0,00 | 4 | 0,00 | ||||
| 2025-07-21 | 13F | Crews Bank & Trust | 599 | 12 | ||||||
| 2025-08-14 | 13F | Comerica Bank | 24 958 | 23,55 | 492 | 20,29 | ||||
| 2025-07-17 | 13F/A | Capital Investment Advisors, LLC | 10 282 | 0,00 | 203 | −2,88 | ||||
| 2025-08-14 | 13F | Riggs Asset Managment Co. Inc. | 328 | −35,69 | 6 | −40,00 | ||||
| 2025-08-12 | 13F | CIBC Private Wealth Group, LLC | 14 141 | 0,00 | 279 | 9,88 | ||||
| 2025-08-14 | 13F | Susquehanna International Group, Llp | 166 475 | 547,38 | 3 283 | 529,94 | ||||
| 2025-05-13 | 13F | Aptus Capital Advisors, LLC | 0 | −100,00 | 0 | |||||
| 2025-08-05 | 13F | Scarborough Advisors, LLC | 1 207 | 24 | ||||||
| 2025-08-11 | 13F | Wealthspire Advisors, LLC | 835 348 | −7,76 | 16 473 | −10,35 | ||||
| 2025-08-11 | 13F | Brown Brothers Harriman & Co | 79 619 | 1 570 | ||||||
| 2025-08-18 | 13F | N.E.W. Advisory Services LLC | 1 789 | −49,03 | 35 | −50,70 | ||||
| 2025-08-14 | 13F | Ancora Advisors, LLC | 1 552 | 1,90 | 31 | 0,00 | ||||
| 2025-05-13 | 13F | Terril Brothers, Inc. | 0 | −100,00 | 0 | |||||
| 2025-08-14 | 13F | Wells Fargo & Company/mn | 47 640 | 0,88 | 939 | −1,98 | ||||
| 2025-08-14 | 13F/A | Rockefeller Capital Management L.P. | 19 395 | 0,00 | 382 | −2,80 | ||||
| 2025-08-14 | 13F | Raymond James Financial Inc | 467 318 | −3,58 | 9 215 | −6,29 | ||||
| 2025-07-22 | 13F | Cedar Mountain Advisors, LLC | 723 | 0,00 | 14 | 0,00 | ||||
| 2025-07-21 | 13F | Catalina Capital Group, LLC | 0 | −100,00 | 0 | |||||
| 2025-07-25 | 13F | Cwm, Llc | 1 716 | 0,00 | 0 | |||||
| 2025-08-04 | 13F | L.m. Kohn & Company | 21 022 | 55,94 | 415 | 51,65 | ||||
| 2025-08-08 | 13F | Pnc Financial Services Group, Inc. | 572 | 0,00 | 11 | 0,00 | ||||
| 2025-08-13 | 13F | EverSource Wealth Advisors, LLC | 0 | −100,00 | 0 | |||||
| 2025-07-16 | 13F | West Branch Capital LLC | 5 911 | 0,00 | 117 | −2,52 | ||||
| 2025-07-24 | 13F | Thompson Investment Management, Inc. | 4 575 | 90 | ||||||
| 2025-08-12 | 13F | Founders Financial Alliance, LLC | 1 740 | 2,35 | 34 | 0,00 | ||||
| 2025-04-30 | 13F | Axxcess Wealth Management, Llc | 0 | −100,00 | 0 | |||||
| 2025-07-31 | 13F | Moloney Securities Asset Management, LLC | 61 003 | 1,99 | 1 203 | −0,91 | ||||
| 2025-08-06 | 13F | Commonwealth Equity Services, Llc | 105 867 | 15,99 | 2 | 100,00 | ||||
| 2025-08-12 | 13F | Wayfinding Financial, LLC | 0 | −100,00 | 0 | |||||
| 2025-08-14 | 13F | Financial Network Wealth Advisors LLC | 797 | 16 | ||||||
| 2025-07-29 | 13F | Koshinski Asset Management, Inc. | 25 207 | 0,06 | 497 | −2,74 | ||||
| 2025-08-12 | 13F | Advisors Asset Management, Inc. | 369 270 | −30,93 | 7 282 | −32,88 | ||||
| 2025-07-14 | 13F | Sowell Financial Services LLC | 155 262 | −0,54 | 3 062 | −3,35 | ||||
| 2025-04-14 | 13F | Umb Bank N A/mo | 0 | −100,00 | 0 | −100,00 | ||||
| 2025-05-16 | 13F/A | Kestra Investment Management, LLC | 0 | −100,00 | 0 | |||||
| 2025-08-07 | 13F | McClarren Financial Advisors, Inc. | 0 | −100,00 | 0 | |||||
| 2025-08-08 | 13F | Avantax Advisory Services, Inc. | 114 504 | 7,17 | 2 258 | 4,15 | ||||
| 2025-09-09 | 13F | NWF Advisory Services Inc. | 104 635 | 5,23 | 2 063 | 2,28 | ||||
| 2025-07-14 | 13F | Whitener Capital Management, Inc. | 17 312 | −7,52 | 341 | −10,03 | ||||
| 2025-08-05 | 13F | Simplex Trading, Llc | 642 | 3 110,00 | 0 | |||||
| 2025-08-12 | 13F | Mystic Asset Management, Inc. | 96 967 | 0,75 | 1 912 | −2,05 | ||||
| 2025-08-04 | 13F | IFG Advisory, LLC | 21 306 | 13,12 | 420 | 9,95 | ||||
| 2025-07-25 | 13F | We Are One Seven, LLC | 69 935 | −2,40 | 1 379 | −5,09 | ||||
| 2025-07-23 | 13F | WESPAC Advisors, LLC | 35 048 | 2,26 | 691 | −0,58 | ||||
| 2025-07-21 | 13F | Future Financial Wealth Managment LLC | 2 541 | 0,00 | 50 | −1,96 | ||||
| 2025-08-15 | 13F | Puff Wealth Management, Llc | 21 249 | 1,57 | 419 | −1,18 | ||||
| 2025-08-07 | 13F | Kestra Private Wealth Services, Llc | 16 296 | 0,46 | 321 | −2,43 | ||||
| 2025-08-19 | 13F | Advisory Services Network, LLC | 11 318 | 0,74 | 225 | −0,88 | ||||
| 2025-07-16 | 13F | Formidable Asset Management, LLC | 55 523 | 0,00 | 1 127 | 0,00 | ||||
| 2025-07-08 | 13F | Nbc Securities, Inc. | 52 637 | 13,45 | 1 | |||||
| 2025-07-11 | 13F | LongView Wealth Management | 215 874 | 0,16 | 4 257 | −2,65 | ||||
| 2025-07-07 | 13F | Thurston, Springer, Miller, Herd & Titak, Inc. | 2 391 | 0,00 | 47 | −2,08 | ||||
| 2025-07-18 | 13F | Dogwood Wealth Management LLC | 1 264 | 25 | ||||||
| 2025-07-17 | 13F | Vermillion Wealth Management, Inc. | 123 | 2,50 | 2 | 0,00 | ||||
| 2025-08-12 | 13F | Park Square Financial Group, LLC | 415 | −25,89 | 8 | −27,27 | ||||
| 2025-08-12 | 13F | Retirement Planning Co of New England, Inc. | 141 504 | 1,39 | 2 790 | −1,45 | ||||
| 2025-08-14 | 13F | Modern Wealth Management, LLC | 814 854 | −1,62 | 16 069 | −4,39 | ||||
| 2025-08-11 | 13F | Principal Securities, Inc. | 1 035 | 2,88 | 20 | 5,26 | ||||
| 2025-07-28 | 13F | Bridges Investment Management Inc | 121 300 | −30,75 | 2 392 | −32,68 | ||||
| 2025-08-04 | 13F | Spire Wealth Management | 4 146 | 0,00 | 82 | −3,57 | ||||
| 2025-08-08 | 13F | Cetera Investment Advisers | 39 344 | 2,98 | 776 | 0,00 | ||||
| 2025-08-12 | 13F | Global Retirement Partners, LLC | 202 | 0,00 | 4 | 0,00 | ||||
| 2025-08-13 | 13F | Northwestern Mutual Wealth Management Co | 21 287 | −4,16 | 420 | −6,89 | ||||
| 2025-07-28 | 13F | Harbour Investments, Inc. | 2 088 | 1,95 | 41 | 0,00 | ||||
| 2025-08-12 | 13F | Pathstone Holdings, LLC | 17 415 | 1,90 | 343 | −0,87 | ||||
| 2025-08-05 | 13F | Prosperity Wealth Management, Inc. | 15 383 | 11,90 | 303 | 8,99 | ||||
| 2025-07-17 | 13F | Janney Montgomery Scott LLC | 21 418 | −4,45 | 0 | |||||
| 2025-05-14 | 13F | Jane Street Group, Llc | 0 | −100,00 | 0 | |||||
| 2025-07-18 | 13F | Truist Financial Corp | 10 829 | −4,68 | 214 | −7,39 | ||||
| 2025-07-24 | 13F | IFP Advisors, Inc | 9 866 | −5,18 | 195 | −8,06 | ||||
| 2025-07-31 | 13F | Stegent Equity Advisors, Inc. | 10 906 | 0,00 | 215 | −2,71 | ||||
| 2025-07-11 | 13F | Pinnacle Bancorp, Inc. | 1 462 | 18,48 | 29 | 12,00 | ||||
| 2025-07-16 | 13F | Cambridge Advisors Inc. | 141 873 | 2,34 | 2 798 | −0,53 | ||||
| 2025-08-04 | 13F | Assetmark, Inc | 1 719 | 34 | ||||||
| 2025-08-28 | NP | Cohen & Steers Closed-end Opportunity Fund, Inc. | 38 937 | −56,22 | 768 | −57,48 | ||||
| 2025-08-05 | 13F | Carolinas Wealth Consulting Llc | 0 | −100,00 | 0 | −100,00 | ||||
| 2025-05-14 | 13F | Ameriprise Financial Inc | 0 | −100,00 | 0 | −100,00 | ||||
| 2025-07-31 | 13F | Whipplewood Advisors, LLC | 8 350 | 64 130,77 | 165 | −2,96 | ||||
| 2025-08-06 | 13F | Prospera Financial Services Inc | 84 895 | 4,78 | 1 674 | 1,82 | ||||
| 2025-08-12 | 13F | Armor Investment Advisors, LLC | 27 113 | −6,54 | 535 | −9,18 | ||||
| 2025-08-14 | 13F | Sunbelt Securities, Inc. | 581 | 0,00 | 11 | 0,00 | ||||
| 2025-05-15 | 13F | Citadel Advisors Llc | 0 | −100,00 | 0 | |||||
| 2025-07-25 | 13F | Atria Wealth Solutions, Inc. | 30 285 | 0,60 | 597 | −2,30 | ||||
| 2025-08-15 | 13F | Kestra Advisory Services, LLC | 37 664 | −3,41 | 743 | −6,19 | ||||
| 2025-07-16 | 13F | Magnus Financial Group LLC | 64 071 | −12,08 | 1 263 | −14,55 | ||||
| 2025-07-22 | 13F | Belpointe Asset Management LLC | 15 377 | 0,00 | 303 | −2,57 | ||||
| 2025-07-28 | 13F | Fairman Group, LLC | 15 709 | 0,00 | 310 | 0,98 | ||||
| 2025-05-14 | 13F | Flow Traders U.s. Llc | 0 | −100,00 | 0 | |||||
| 2025-08-14 | 13F | Stifel Financial Corp | 79 454 | 2,88 | 1 567 | 0,00 | ||||
| 2025-07-21 | 13F | DHJJ Financial Advisors, Ltd. | 1 005 | 0,00 | 20 | −5,00 | ||||
| 2025-08-11 | 13F | Nations Financial Group Inc, /ia/ /adv | 0 | −100,00 | 0 | |||||
| 2025-08-08 | 13F | Altfest L J & Co Inc | 68 064 | 0,83 | 1 342 | −1,97 | ||||
| 2025-08-13 | 13F | Smith, Moore & Co. | 26 052 | 99,07 | 514 | 93,58 | ||||
| 2025-04-28 | 13F | Mutual Advisors, LLC | 0 | −100,00 | 0 | |||||
| 2025-08-14 | 13F | CoreCap Advisors, LLC | 61 867 | 0,41 | 1 220 | −2,40 | ||||
| 2025-08-06 | 13F | Moors & Cabot, Inc. | 27 435 | 3,71 | 541 | 0,93 | ||||
| 2025-08-12 | 13F | LPL Financial LLC | 1 005 342 | 0,78 | 19 825 | −2,06 | ||||
| 2025-08-12 | 13F | Change Path, LLC | 26 941 | −15,20 | 531 | −17,55 | ||||
| 2025-08-15 | 13F | Morgan Stanley | 2 322 813 | −2,08 | 45 805 | −4,83 | ||||
| 2025-08-06 | 13F | Legacy Wealth Managment, LLC/ID | 1 905 | 0,00 | 38 | −2,63 | ||||
| 2025-08-14 | 13F | IHT Wealth Management, LLC | 19 763 | 390 | ||||||
| 2025-08-06 | 13F | AE Wealth Management LLC | 4 139 | 0,10 | 82 | −2,41 | ||||
| 2025-08-06 | 13F | Legacy Investment Solutions, LLC | 1 905 | 0,00 | 38 | −2,63 | ||||
| 2025-08-05 | 13F | Kesler, Norman & Wride, LLC | 14 049 | −2,58 | 277 | −5,14 | ||||
| 2025-08-13 | 13F | Capital Advisors Wealth Management, LLC | 14 055 | 1,95 | 277 | −0,72 | ||||
| 2025-07-29 | 13F | Stratos Wealth Partners, LTD. | 20 809 | 9,10 | 410 | 5,94 | ||||
| 2025-07-07 | 13F | Investors Research Corp | 0 | −100,00 | 0 | |||||
| 2025-08-18 | 13F | Geneos Wealth Management Inc. | 541 | 0,00 | 11 | 0,00 | ||||
| 2025-05-01 | 13F | Schechter Investment Advisors, LLC | 0 | −100,00 | 0 | |||||
| 2025-07-24 | 13F | Us Bancorp \de\ | 1 003 | 2,98 | 20 | 0,00 | ||||
| 2025-08-14 | 13F | Icon Wealth Advisors, LLC | 19 815 | 1,92 | 391 | −1,02 | ||||
| 2025-08-11 | 13F | HighTower Advisors, LLC | 24 934 | −11,12 | 492 | −13,71 | ||||
| 2025-08-29 | NP | OneAscent Capital Opportunities Fund | 40 000 | 95,12 | 789 | 89,88 | ||||
| 2025-07-31 | 13F | Strait & Sound Wealth Management LLC | 67 313 | 9,51 | 1 327 | 6,42 | ||||
| 2025-08-01 | 13F | Winebrenner Capital Management Llc | 85 952 | −0,28 | 1 695 | −3,09 | ||||
| 2025-08-05 | 13F | Sigma Planning Corp | 11 670 | 4,26 | 230 | 1,32 | ||||
| 2025-08-07 | 13F | Allworth Financial LP | 2 532 | 78,31 | 50 | 81,48 | ||||
| 2025-07-31 | 13F | AlTi Global, Inc. | 48 539 | −0,27 | 957 | −3,04 | ||||
| 2025-08-07 | 13F | Resources Investment Advisors, LLC. | 44 554 | −7,92 | 879 | −10,50 | ||||
| 2025-08-14 | 13F | Coastal Bridge Advisors, LLC | 892 783 | 2,28 | 17 605 | −0,60 | ||||
| 2025-07-25 | 13F | Concurrent Investment Advisors, LLC | 18 183 | 359 | ||||||
| 2025-08-13 | 13F | Baird Financial Group, Inc. | 0 | −100,00 | 0 | |||||
| 2025-08-13 | 13F | Cresset Asset Management, LLC | 54 428 | 0,00 | 1 073 | −2,81 | ||||
| 2025-08-14 | 13F | GWM Advisors LLC | 40 751 | −10,29 | 804 | −12,81 | ||||
| 2025-08-07 | 13F | Proficio Capital Partners LLC | 12 937 487 | 13 399 | ||||||
| 2025-08-12 | 13F | MAI Capital Management | 41 382 | −0,49 | 816 | −3,20 | ||||
| 2025-08-08 | 13F | SBI Securities Co., Ltd. | 7 | 0 | ||||||
| 2025-07-29 | 13F | Stephens Inc /ar/ | 42 413 | 0,03 | 836 | −2,79 | ||||
| 2025-08-12 | 13F | Proequities, Inc. | 0 | 0 | ||||||
| 2025-07-31 | 13F | Oppenheimer & Co Inc | 189 379 | 0,55 | 3 735 | −2,28 | ||||
| 2025-08-14 | 13F | Cohen & Steers, Inc. | 38 937 | −56,22 | 1 | −100,00 | ||||
| 2025-08-01 | 13F | Bessemer Group Inc | 1 688 | 0 | ||||||
| 2025-07-22 | 13F | Iron Horse Wealth Management, LLC | 0 | −100,00 | 0 | |||||
| 2025-08-11 | 13F | Private Advisor Group, LLC | 46 093 | −0,94 | 909 | −3,81 | ||||
| 2025-07-29 | 13F | Salomon & Ludwin, LLC | 704 | 0,00 | 14 | −7,14 | ||||
| 2025-07-25 | 13F | Community Bank, N.A. | 100 000 | 0,00 | 1 971 | −2,81 | ||||
| 2025-07-30 | 13F | Whittier Trust Co Of Nevada Inc | 16 060 | 0,00 | 317 | −2,77 | ||||
| 2025-08-12 | 13F | Steward Partners Investment Advisory, Llc | 45 605 | 1,82 | 899 | −0,99 | ||||
| 2025-08-14 | 13F | Bank Of America Corp /de/ | 11 721 | 231 | ||||||
| 2025-07-10 | 13F | Wealth Enhancement Advisory Services, Llc | 98 833 | −1,99 | 1 947 | −4,79 | ||||
| 2025-07-23 | 13F | Morey & Quinn Wealth Partners, LLC | 0 | −100,00 | 0 | |||||
| 2025-07-25 | 13F | Hazlett, Burt & Watson, Inc. | 1 479 | 0,00 | 0 | |||||
| 2025-08-14 | 13F | Aqr Capital Management Llc | 14 433 | 285 |