Grundläggande statistik
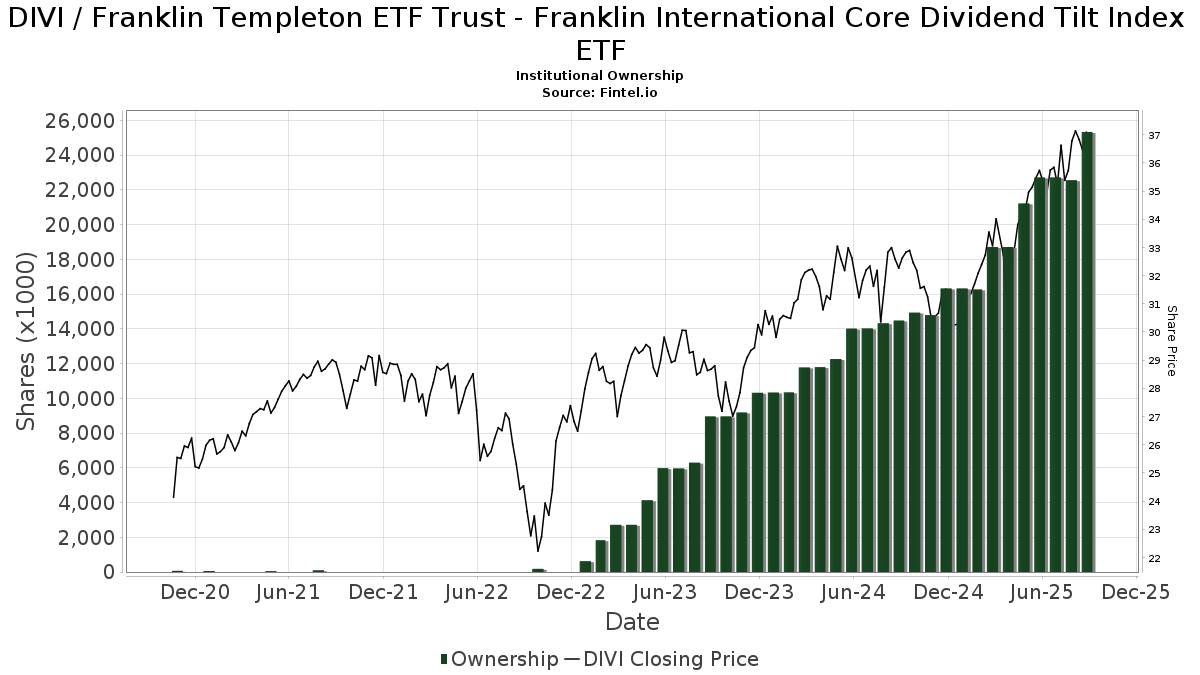
| Institutionella ägare | 144 total, 144 long only, 0 short only, 0 long/short - change of 7,41% MRQ |
| Genomsnittlig portföljallokering | 0.4807 % - change of 8,28% MRQ |
| Institutionella aktier (lång) | 25 335 825 (ex 13D/G) - change of 2,62MM shares 11,55% MRQ |
| Institutionellt värde (lång) | $ 782 787 USD ($1000) |
Institutionellt ägande och aktieägare
Franklin Templeton ETF Trust - Franklin International Core Dividend Tilt Index ETF (US:DIVI) har 144 Institutionella ägare och aktieägare som har lämnat in 13D/G- eller 13F-formulär till Securities Exchange Commission (SEC). Dessa institut innehar totalt 25,335,825 aktier. Största aktieägare inkluderar Retirement Planning Group, LPL Financial LLC, Bank Of America Corp /de/, Capital Analysts, Inc., Legacy Financial Advisors, Inc., Cwm, Llc, Raymond James Financial Inc, Northwestern Mutual Wealth Management Co, GWM Advisors LLC, and Baron Wealth Management LLC .
Franklin Templeton ETF Trust - Franklin International Core Dividend Tilt Index ETF (ARCA:DIVI) Institutionell ägarstruktur visar institutioners och fonders nuvarande positioner i företaget, samt de senaste förändringarna i positionernas storlek. Större aktieägare kan vara enskilda investerare, fonder, hedgefonder eller institutioner. Bilaga 13D visar att investeraren äger (eller ägde) mer än 5% av företaget och avser (eller avsåg) att aktivt eftersträva en förändring av affärsstrategin. Schedule 13G indikerar en passiv investering på över 5%.
The share price as of September 10, 2025 is 37,09 / share. Previously, on September 11, 2024, the share price was 32,27 / share. This represents an increase of 14,94% over that period.
Fondsentimentets poäng
Fondsentimentet poängen(fka Ägarackumulation-poäng) visar vilka aktier som är mest köpta av fonder. Det är resultatet av en sofistikerad kvantitativ flerfaktormodell som identifierar företag med de högsta nivåerna av institutionell ackumulering. Poängsättningsmodellen använder en kombination av den totala ökningen av redovisade ägare, förändringarna i portföljallokeringarna för dessa ägare och andra mått. Siffran sträcker sig från 0 till 100, där högre siffror indikerar en högre nivå av ackumulering i förhållande till sina konkurrenter, och 50 är genomsnittet.
Uppdateringsfrekvens: Dagligen
Se Ownership Explorer, som innehåller en lista över de högst rankade företagen.
Institutionell sälj/köp-kvot
Förutom att rapportera vanliga eget kapital- och skuldemissioner måste institutioner med mer än 100MM tillgångar under förvaltning också avslöja sina innehav av sälj- och köpoptioner. Eftersom säljoptioner i allmänhet indikerar ett negativt sentiment och köpoptioner indikerar ett positivt sentiment, kan vi få en uppfattning om det övergripande institutionella sentimentet genom att plotta förhållandet mellan säljoptioner och köpoptioner. Diagrammet till höger visar det historiska förhållandet mellan sälj- och köpoptioner för detta instrument.
Genom att använda sälj/köp-kvoten som en indikator på aktieägarnas sentiment undviker man en av de största bristerna med att använda det totala institutionella ägandet, nämligen att en betydande del av de förvaltade tillgångarna investeras passivt för att följa index. Passivt förvaltade fonder köper vanligtvis inte optioner, så indikatorn för sälj/köp-kvoten ger en bättre bild av stämningen i aktivt förvaltade fonder.
13F- och NPORT-arkiveringar
Detaljer om 13F-arkiveringar är gratis. Detaljer om NP-arkiveringar kräver ett premiummedlemskap. Gröna rader indikerar nya positioner. Röda rader indikerar stängda positioner. Klicka på länk symbolen för att se hela transaktionshistoriken.
Uppgradera
för att låsa upp premiumdata och exportera till Excel ![]() .
.
| Fil Datum | Källa | Investerare | Typ | Genomsnittligt pris (beräknat) |
Aktier | Δ Aktier (%) |
Rapporterat värde (1000 USD) |
Δ Värde (%) |
Portföljallokering (%) |
|
|---|---|---|---|---|---|---|---|---|---|---|
| 2025-08-13 | 13F | Cary Street Partners Financial Llc | 140 173 | 0,00 | 4 996 | 9,35 | ||||
| 2025-07-16 | 13F/A | CX Institutional | 23 254 | −6,14 | 1 | |||||
| 2025-07-18 | 13F | Powers Advisory Group, LLC | 30 329 | 55,58 | 1 081 | 70,08 | ||||
| 2025-07-15 | 13F | Burns Matteson Capital Management, LLC | 8 100 | −3,77 | 289 | 5,11 | ||||
| 2025-08-12 | 13F | Proequities, Inc. | 0 | 0 | ||||||
| 2025-08-12 | 13F | LPL Financial LLC | 3 905 450 | 3,69 | 139 190 | 13,40 | ||||
| 2025-08-06 | 13F | AE Wealth Management LLC | 70 | 0,00 | 2 | 0,00 | ||||
| 2025-07-31 | 13F | Sage Mountain Advisors LLC | 379 | 0,00 | 14 | 8,33 | ||||
| 2025-08-14 | 13F | Bank Of America Corp /de/ | 1 519 906 | 138,40 | 54 169 | 160,72 | ||||
| 2025-08-14 | 13F | Mml Investors Services, Llc | 53 544 | 12,05 | 2 | 0,00 | ||||
| 2025-07-25 | 13F | Cwm, Llc | 830 491 | 17,00 | 30 | 26,09 | ||||
| 2025-07-24 | 13F | Ridgeline Wealth Planning, LLC | 111 469 | 7,62 | 3 973 | 17,69 | ||||
| 2025-08-05 | 13F | Bank Of Montreal /can/ | 6 773 | 6,91 | 241 | 16,99 | ||||
| 2025-08-14 | 13F | Royal Bank Of Canada | 23 157 | 350,09 | 825 | 391,07 | ||||
| 2025-07-28 | 13F | Harbour Investments, Inc. | 54 281 | −49,33 | 1 935 | −44,60 | ||||
| 2025-07-08 | 13F | Parallel Advisors, LLC | 121 | 1,68 | 4 | 33,33 | ||||
| 2025-07-24 | 13F | IFP Advisors, Inc | 5 813 | −19,92 | 207 | −12,29 | ||||
| 2025-07-11 | 13F | SILVER OAK SECURITIES, Inc | 6 765 | −6,46 | 241 | 1,69 | ||||
| 2025-08-14 | 13F | Fmr Llc | 5 529 | 120,89 | 197 | 143,21 | ||||
| 2025-08-14 | 13F | Benjamin Edwards Inc | 26 473 | 0,00 | 943 | 9,40 | ||||
| 2025-07-17 | 13F | Kelly Financial Services LLC | 47 719 | 1 701 | ||||||
| 2025-08-13 | 13F | EverSource Wealth Advisors, LLC | 0 | −100,00 | 0 | |||||
| 2025-08-15 | 13F | Morgan Stanley | 622 | −88,19 | 22 | −87,13 | ||||
| 2025-07-09 | 13F | Baron Wealth Management LLC | 678 704 | 93,77 | 24 189 | 111,91 | ||||
| 2025-08-12 | 13F | SRS Capital Advisors, Inc. | 1 224 | 44 | ||||||
| 2025-08-11 | 13F | Tidemark, LLC | 4 559 | 59,85 | 162 | 76,09 | ||||
| 2025-08-13 | 13F | Jones Financial Companies Lllp | 120 073 | 57,67 | 4 277 | 71,04 | ||||
| 2025-08-25 | 13F | Silverlake Wealth Management Llc | 21 787 | 12,55 | 776 | 23,17 | ||||
| 2025-08-07 | 13F | LOM Asset Management Ltd | 7 155 | 0 | ||||||
| 2025-04-28 | 13F | Rosenberg Matthew Hamilton | 0 | −100,00 | 0 | −100,00 | ||||
| 2025-08-06 | 13F | Commonwealth Equity Services, Llc | 174 616 | −11,66 | 6 | 0,00 | ||||
| 2025-08-13 | 13F | StoneX Group Inc. | 6 665 | 238 | ||||||
| 2025-07-16 | 13F | Perigon Wealth Management, LLC | 6 934 | 247 | ||||||
| 2025-08-11 | 13F | Cascade Wealth Advisors, Inc | 7 720 | 280 | ||||||
| 2025-08-14 | 13F | Federation des caisses Desjardins du Quebec | 715 | 0,00 | 25 | 8,70 | ||||
| 2025-07-29 | 13F | Stratos Wealth Partners, LTD. | 7 488 | 5,30 | 267 | 15,15 | ||||
| 2025-08-05 | 13F | GPS Wealth Strategies Group, LLC | 200 | 0,00 | 7 | 16,67 | ||||
| 2025-08-13 | 13F | Northwestern Mutual Wealth Management Co | 734 473 | 30,07 | 26 177 | 42,25 | ||||
| 2025-05-12 | 13F | Independent Advisor Alliance | 0 | −100,00 | 0 | |||||
| 2025-07-25 | 13F | Atria Wealth Solutions, Inc. | 0 | −100,00 | 0 | |||||
| 2025-07-22 | 13F | Valley National Advisers Inc | 0 | −100,00 | 0 | |||||
| 2025-08-12 | 13F | Titleist Asset Management, Llc | 20 548 | −20,92 | 732 | −13,48 | ||||
| 2025-05-06 | 13F | PFG Advisors | 0 | −100,00 | 0 | |||||
| 2025-08-12 | 13F | Coldstream Capital Management Inc | 0 | −100,00 | 0 | |||||
| 2025-08-12 | 13F | Jpmorgan Chase & Co | 14 395 | 23,36 | 513 | 35,00 | ||||
| 2025-08-14 | 13F | Visionary Wealth Advisors | 81 671 | 2 911 | ||||||
| 2025-08-14 | 13F | Wells Fargo & Company/mn | 288 | 28 700,00 | 10 | |||||
| 2025-08-14 | 13F | Stifel Financial Corp | 242 446 | 18,89 | 8 641 | 30,02 | ||||
| 2025-08-04 | 13F | Savvy Advisors, Inc. | 13 146 | −2,81 | 469 | 6,36 | ||||
| 2025-08-04 | 13F | Atria Investments Llc | 6 164 | 220 | ||||||
| 2025-08-07 | 13F | Winch Advisory Services, LLC | 246 | 0,00 | 9 | 0,00 | ||||
| 2025-08-19 | 13F | Advisory Services Network, LLC | 5 842 | 205 | ||||||
| 2025-07-17 | 13F | Nelson, Van Denburg & Campbell Wealth Management Group, LLC | 6 157 | 0,00 | 219 | 9,50 | ||||
| 2025-08-11 | 13F | Ritter Daniher Financial Advisory LLC / DE | 2 | 0 | ||||||
| 2025-07-22 | 13F | Integrated Capital Management, LLC | 303 380 | 5,50 | 11 | 11,11 | ||||
| 2025-08-13 | 13F | Lido Advisors, LLC | 24 781 | 22,14 | 883 | 33,59 | ||||
| 2025-07-29 | 13F | Fundamentun, Llc | 15 964 | 569 | ||||||
| 2025-07-10 | 13F | Redhawk Wealth Advisors, Inc. | 8 244 | 1,80 | 294 | 11,41 | ||||
| 2025-08-08 | 13F | Empower Advisory Group, LLC | 11 489 | 0,00 | 409 | 9,36 | ||||
| 2025-08-11 | 13F | Slagle Financial, LLC | 37 316 | 17,05 | 1 330 | 28,03 | ||||
| 2025-07-29 | 13F | Goldstein Advisors, LLC | 16 796 | −0,55 | 599 | 8,73 | ||||
| 2025-07-16 | 13F | Owen LaRue, LLC | 107 419 | −0,51 | 3 828 | 8,81 | ||||
| 2025-07-31 | 13F | Hartford Financial Management Inc. | 1 946 | −19,52 | 69 | −11,54 | ||||
| 2025-07-14 | 13F | Sowell Financial Services LLC | 34 611 | 15,64 | 1 234 | 26,46 | ||||
| 2025-08-14 | 13F | Jane Street Group, Llc | 381 022 | 1,14 | 13 580 | 10,61 | ||||
| 2025-07-16 | 13F | Novem Group | 58 601 | −2,50 | 2 089 | 6,64 | ||||
| 2025-08-14 | 13F | Susquehanna International Group, Llp | 0 | −100,00 | 0 | |||||
| 2025-08-01 | 13F | Envestnet Asset Management Inc | 210 825 | 41,08 | 7 514 | 54,27 | ||||
| 2025-08-14 | 13F | Betterment LLC | 9 397 | −3,89 | 0 | |||||
| 2025-08-07 | 13F | Allworth Financial LP | 350 | 0,86 | 12 | 9,09 | ||||
| 2025-08-14 | 13F | Raymond James Financial Inc | 752 548 | 35,11 | 26 821 | 47,75 | ||||
| 2025-07-29 | 13F | Tradewinds Capital Management, LLC | 0 | −100,00 | 0 | |||||
| 2025-07-31 | 13F | CAP Partners, LLC | 19 468 | 6,45 | 694 | 16,28 | ||||
| 2025-08-12 | 13F | Cornerstone Wealth Management, LLC | 26 107 | 3,44 | 930 | 13,14 | ||||
| 2025-07-25 | 13F | Evolution Advisers, Inc. | 2 | 0,00 | 0 | |||||
| 2025-08-14 | 13F | Ameriprise Financial Inc | 91 711 | 79,71 | 3 269 | 96,63 | ||||
| 2025-07-28 | 13F | RFG Advisory, LLC | 30 441 | 19,17 | 1 085 | 30,29 | ||||
| 2025-07-17 | 13F | Prepared Retirement Institute LLC | 114 223 | 1,24 | 4 071 | 10,72 | ||||
| 2025-08-12 | 13F | Steward Partners Investment Advisory, Llc | 56 240 | 99,33 | 2 004 | 118,06 | ||||
| 2025-08-14 | 13F | GWM Advisors LLC | 683 764 | 3,83 | 24 369 | 13,55 | ||||
| 2025-07-10 | 13F | Exchange Traded Concepts, Llc | 874 | 31 | ||||||
| 2025-08-14 | 13F | CoreCap Advisors, LLC | 959 | 0,00 | 34 | 9,68 | ||||
| 2025-08-13 | 13F | Royal Fund Management, LLC | 16 083 | −1,06 | 573 | 8,32 | ||||
| 2025-05-13 | 13F | UBS Group AG | 0 | −100,00 | 0 | |||||
| 2025-07-07 | 13F | Whitaker-Myers Wealth Managers, LTD. | 22 018 | 9,44 | 785 | 19,69 | ||||
| 2025-08-11 | 13F | Principal Securities, Inc. | 3 608 | −3,24 | 129 | 15,32 | ||||
| 2025-08-08 | 13F | Avantax Advisory Services, Inc. | 24 882 | 14,91 | 887 | 25,67 | ||||
| 2025-07-29 | 13F | Private Trust Co Na | 7 926 | −0,60 | 282 | 8,88 | ||||
| 2025-07-29 | 13F | LMG Wealth Partners, LLC | 249 684 | 2,31 | 8 899 | 11,88 | ||||
| 2025-08-08 | 13F | Crossmark Global Holdings, Inc. | 12 167 | 1,82 | 432 | 11,95 | ||||
| 2025-08-08 | 13F | Thoroughbred Financial Services, Llc | 131 978 | −38,81 | 5 | −42,86 | ||||
| 2025-07-11 | 13F | OxenFree Capital LLC | 47 594 | 0,03 | 1 696 | 10,78 | ||||
| 2025-08-12 | 13F | Change Path, LLC | 69 655 | 6,12 | 2 482 | 16,04 | ||||
| 2025-08-18 | 13F | Geneos Wealth Management Inc. | 250 | 0,00 | 9 | 0,00 | ||||
| 2025-07-02 | 13F | HBW Advisory Services LLC | 45 253 | 230,80 | 1 613 | 262,25 | ||||
| 2025-07-24 | 13F | Ronald Blue Trust, Inc. | 250 | 0,00 | 9 | 0,00 | ||||
| 2025-08-08 | 13F | Capital Investment Advisory Services, LLC | 70 | 0,00 | 2 | 0,00 | ||||
| 2025-08-14 | 13F | Great Valley Advisor Group, Inc. | 20 616 | 96,03 | 734 | 113,99 | ||||
| 2025-07-29 | 13F | Koshinski Asset Management, Inc. | 353 793 | 14,01 | 12 609 | 24,68 | ||||
| 2025-08-27 | 13F | Barnes Wealth Management Group, Inc | 7 759 | −2,22 | 277 | 6,98 | ||||
| 2025-07-30 | 13F | Castle Wealth Management Llc | 127 160 | 2,09 | 4 532 | 11,63 | ||||
| 2025-09-04 | 13F/A | Advisor Group Holdings, Inc. | 107 454 | 6,16 | 3 830 | 16,10 | ||||
| 2025-08-05 | 13F | Bank of New York Mellon Corp | 261 023 | 46,17 | 9 303 | 59,86 | ||||
| 2025-08-13 | 13F | Flow Traders U.s. Llc | 65 452 | −32,04 | 2 | −33,33 | ||||
| 2025-07-09 | 13F | Defined Wealth Management, Llc | 119 474 | −1,28 | 4 258 | 7,96 | ||||
| 2025-07-30 | 13F | Crewe Advisors LLC | 1 592 | 57 | ||||||
| 2025-08-07 | 13F | AllGen Financial Advisors, Inc. | 303 123 | 10 803 | ||||||
| 2025-07-14 | 13F | AdvisorNet Financial, Inc | 3 010 | 0,00 | 107 | 9,18 | ||||
| 2025-07-16 | 13F | Highline Wealth Partners Llc | 0 | −100,00 | 0 | |||||
| 2025-07-18 | 13F | Midwest Financial Group LLC | 34 511 | 94,26 | 1 230 | 112,63 | ||||
| 2025-08-12 | 13F | Global Retirement Partners, LLC | 1 208 | 1 489,47 | 43 | 2 050,00 | ||||
| 2025-08-27 | 13F/A | Brinker Capital Investments, LLC | 45 903 | 0,04 | 1 636 | 9,36 | ||||
| 2025-08-12 | 13F | Absolute Capital Management, LLC | 45 000 | 0,00 | 1 604 | 9,35 | ||||
| 2025-06-11 | 13F | Fortitude Financial, LLC | 29 225 | 0,00 | 952 | 8,55 | ||||
| 2025-08-15 | 13F | Equitable Holdings, Inc. | 136 352 | 8,50 | 4 860 | 18,66 | ||||
| 2025-07-16 | 13F | Meridian Financial, LLC | 11 714 | 9,04 | 417 | 19,14 | ||||
| 2025-07-14 | 13F | Southland Equity Partners LLC | 40 423 | 6,45 | 1 441 | 16,41 | ||||
| 2025-04-28 | 13F | Financial Advocates Investment Management | 0 | −100,00 | 0 | |||||
| 2025-07-17 | 13F | Janney Montgomery Scott LLC | 117 339 | −29,23 | 4 | −20,00 | ||||
| 2025-07-23 | 13F | TriaGen Wealth Management LLC | 468 136 | 13,33 | 16 684 | 23,93 | ||||
| 2025-04-21 | 13F | Envestnet Portfolio Solutions, Inc. | 0 | −100,00 | 0 | |||||
| 2025-04-28 | 13F | Smart Money Group LLC | 0 | −100,00 | 0 | |||||
| 2025-08-19 | 13F | Cape Investment Advisory, Inc. | 1 316 | 0,00 | 47 | 9,52 | ||||
| 2025-07-28 | 13F | Mutual Advisors, LLC | 106 332 | 0,83 | 3 859 | 9,20 | ||||
| 2025-08-11 | 13F | Private Advisor Group, LLC | 97 106 | −34,76 | 3 461 | −28,66 | ||||
| 2025-08-13 | 13F | Capital Analysts, Inc. | 1 335 749 | 116,33 | 48 | 135,00 | ||||
| 2025-08-08 | 13F | Cetera Investment Advisers | 636 711 | 9,51 | 22 692 | 19,76 | ||||
| 2025-08-12 | 13F | O'shaughnessy Asset Management, Llc | 391 | 14 | ||||||
| 2025-08-05 | 13F | Sigma Planning Corp | 5 943 | 212 | ||||||
| 2025-08-28 | NP | AAMAX - Absolute Capital Asset Allocator Fund Class A Shares | 45 000 | 0,00 | 1 604 | 9,35 | ||||
| 2025-07-18 | 13F | Truist Financial Corp | 8 228 | 293 | ||||||
| 2025-05-15 | 13F/A | Orion Portfolio Solutions, LLC | 45 886 | 1,38 | 1 495 | 10,09 | ||||
| 2025-08-05 | 13F | BCGM Wealth Management, LLC | 12 610 | −88,09 | 449 | −86,99 | ||||
| 2025-08-14 | 13F | Citadel Advisors Llc | 73 294 | 661,10 | 2 612 | 734,50 | ||||
| 2025-08-07 | 13F | Kestra Private Wealth Services, Llc | 449 890 | 10,18 | 16 034 | 20,49 | ||||
| 2025-07-30 | 13F | Retirement Planning Group | 4 475 833 | 5,09 | 159 519 | 14,93 | ||||
| 2025-07-31 | 13F | Oppenheimer & Co Inc | 59 880 | 0,44 | 2 134 | 9,89 | ||||
| 2025-08-15 | 13F | Kestra Advisory Services, LLC | 226 501 | 14,61 | 8 072 | 25,34 | ||||
| 2025-08-14 | 13F | Mariner, LLC | 432 808 | −15,70 | 15 425 | −7,81 | ||||
| 2025-08-15 | 13F | Koesten, Hirschmann & Crabtree, INC. | 20 | 0,00 | 1 | |||||
| 2025-08-07 | 13F | Legacy Financial Advisors, Inc. | 877 208 | 2,02 | 31 264 | 11,56 | ||||
| 2025-07-03 | 13F | First Hawaiian Bank | 139 987 | 41,79 | 4 989 | 55,08 | ||||
| 2025-07-21 | 13F | Ameritas Advisory Services, LLC | 1 963 | 70 | ||||||
| 2025-08-04 | 13F | Flagship Harbor Advisors, Llc | 404 307 | −0,39 | 14 409 | 8,93 | ||||
| 2025-07-31 | 13F | Cambridge Investment Research Advisors, Inc. | 228 842 | −74,01 | 8 | −71,43 | ||||
| 2025-08-14 | 13F | Wiley Bros.-aintree Capital, Llc | 141 930 | 99,58 | 5 058 | 116,62 | ||||
| 2025-08-15 | 13F | Cornerstone Financial Group, LLC /NE/ | 7 441 | 0,45 | 265 | 4,33 | ||||
| 2025-08-14 | 13F | Comerica Bank | 2 960 | −9,40 | 105 | −0,94 | ||||
| 2025-08-08 | 13F | Emerald Investment Partners, Llc | 5 276 | 1,00 | 188 | 10,59 | ||||
| 2025-07-11 | 13F | Farther Finance Advisors, LLC | 1 187 | 1,80 | 42 | 10,53 | ||||
| 2025-08-12 | 13F | Vickerman Investment Advisors, Inc. | 354 086 | 6,80 | 12 620 | 16,79 | ||||
| 2025-08-26 | NP | FTRAX - Franklin LifeSmart Retirement Income Fund CLASS A | 40 500 | −1,70 | 1 443 | 7,53 | ||||
| 2025-08-14 | 13F | Clark Capital Management Group, Inc. | 26 113 | 0,00 | 931 | 9,28 | ||||
| 2025-08-15 | 13F/A | MONECO Advisors, LLC | 0 | −100,00 | 0 | −100,00 | ||||
| 2025-07-23 | 13F | Godsey & Gibb Associates | 0 | −100,00 | 0 | −100,00 | ||||
| 2025-08-12 | 13F | J.w. Cole Advisors, Inc. | 19 296 | 0,07 | 688 | 9,39 | ||||
| 2025-08-12 | 13F | Franklin Resources Inc | 40 966 | −1,75 | 1 460 | 7,51 | ||||
| 2025-08-06 | 13F | Prospera Financial Services Inc | 38 217 | −0,26 | 1 362 | 9,05 | ||||
| 2025-08-07 | 13F | Blackston Financial Advisory Group, LLC | 10 550 | −9,32 | 376 | −0,79 | ||||
| 2025-08-14 | 13F | Sunbelt Securities, Inc. | 85 | 0,00 | 3 | 0,00 | ||||
| 2025-08-26 | 13F/A | Thrivent Financial For Lutherans | 87 614 | 3 |