Grundläggande statistik
| Institutionella ägare | 334 total, 334 long only, 0 short only, 0 long/short - change of 4,70% MRQ |
| Genomsnittlig portföljallokering | 0.4588 % - change of −7,15% MRQ |
| Institutionella aktier (lång) | 108 155 787 (ex 13D/G) - change of 10,71MM shares 10,99% MRQ |
| Institutionellt värde (lång) | $ 3 586 975 USD ($1000) |
Institutionellt ägande och aktieägare
Capital Group Core Equity ETF (US:CGUS) har 334 Institutionella ägare och aktieägare som har lämnat in 13D/G- eller 13F-formulär till Securities Exchange Commission (SEC). Dessa institut innehar totalt 108,155,787 aktier. Största aktieägare inkluderar LPL Financial LLC, Envestnet Asset Management Inc, Raymond James Financial Inc, Morgan Stanley, Cetera Investment Advisers, Capital Group Private Client Services, Inc., Northwestern Mutual Wealth Management Co, Jones Financial Companies Lllp, Commonwealth Equity Services, Llc, and Wells Fargo & Company/mn .
Capital Group Core Equity ETF (ARCA:CGUS) Institutionell ägarstruktur visar institutioners och fonders nuvarande positioner i företaget, samt de senaste förändringarna i positionernas storlek. Större aktieägare kan vara enskilda investerare, fonder, hedgefonder eller institutioner. Bilaga 13D visar att investeraren äger (eller ägde) mer än 5% av företaget och avser (eller avsåg) att aktivt eftersträva en förändring av affärsstrategin. Schedule 13G indikerar en passiv investering på över 5%.
The share price as of September 11, 2025 is 39,49 / share. Previously, on September 12, 2024, the share price was 33,44 / share. This represents an increase of 18,09% over that period.

Fondsentimentets poäng
Fondsentimentet poängen(fka Ägarackumulation-poäng) visar vilka aktier som är mest köpta av fonder. Det är resultatet av en sofistikerad kvantitativ flerfaktormodell som identifierar företag med de högsta nivåerna av institutionell ackumulering. Poängsättningsmodellen använder en kombination av den totala ökningen av redovisade ägare, förändringarna i portföljallokeringarna för dessa ägare och andra mått. Siffran sträcker sig från 0 till 100, där högre siffror indikerar en högre nivå av ackumulering i förhållande till sina konkurrenter, och 50 är genomsnittet.
Uppdateringsfrekvens: Dagligen
Se Ownership Explorer, som innehåller en lista över de högst rankade företagen.
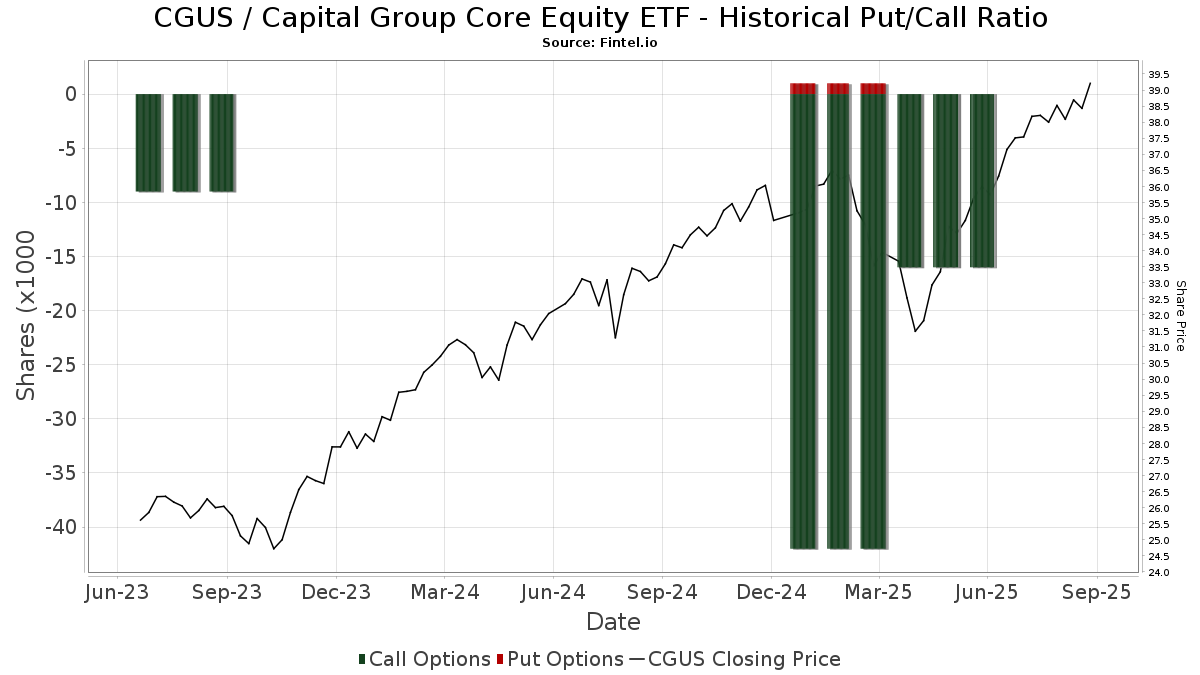
Institutionell sälj/köp-kvot
Förutom att rapportera vanliga eget kapital- och skuldemissioner måste institutioner med mer än 100MM tillgångar under förvaltning också avslöja sina innehav av sälj- och köpoptioner. Eftersom säljoptioner i allmänhet indikerar ett negativt sentiment och köpoptioner indikerar ett positivt sentiment, kan vi få en uppfattning om det övergripande institutionella sentimentet genom att plotta förhållandet mellan säljoptioner och köpoptioner. Diagrammet till höger visar det historiska förhållandet mellan sälj- och köpoptioner för detta instrument.
Genom att använda sälj/köp-kvoten som en indikator på aktieägarnas sentiment undviker man en av de största bristerna med att använda det totala institutionella ägandet, nämligen att en betydande del av de förvaltade tillgångarna investeras passivt för att följa index. Passivt förvaltade fonder köper vanligtvis inte optioner, så indikatorn för sälj/köp-kvoten ger en bättre bild av stämningen i aktivt förvaltade fonder.
13F- och NPORT-arkiveringar
Detaljer om 13F-arkiveringar är gratis. Detaljer om NP-arkiveringar kräver ett premiummedlemskap. Gröna rader indikerar nya positioner. Röda rader indikerar stängda positioner. Klicka på länk symbolen för att se hela transaktionshistoriken.
Uppgradera
för att låsa upp premiumdata och exportera till Excel ![]() .
.
| Fil Datum | Källa | Investerare | Typ | Genomsnittligt pris (beräknat) |
Aktier | Δ Aktier (%) |
Rapporterat värde (1000 USD) |
Δ Värde (%) |
Portföljallokering (%) |
|
|---|---|---|---|---|---|---|---|---|---|---|
| 2025-07-22 | 13F | Merit Financial Group, LLC | 122 226 | 16,87 | 4 514 | 29,20 | ||||
| 2025-08-12 | 13F | Steward Partners Investment Advisory, Llc | 42 666 | 55,62 | 1 576 | 72,13 | ||||
| 2025-04-17 | 13F | Cornerstone Wealth Advisors, Inc. | 0 | −100,00 | 0 | |||||
| 2025-07-24 | 13F | Blair William & Co/il | 159 403 | 2,44 | 5 887 | 13,26 | ||||
| 2025-08-12 | 13F | Rather & Kittrell, Inc. | 10 064 | 0,80 | 372 | 11,41 | ||||
| 2025-08-14 | 13F | UBS Group AG | 1 447 626 | 61,67 | 53 461 | 78,75 | ||||
| 2025-08-13 | 13F | Certior Financial Group, Llc | 21 483 | −7,29 | 793 | 2,59 | ||||
| 2025-08-14 | 13F | TCG Advisory Services, LLC | 750 208 | 7,23 | 27 705 | 18,56 | ||||
| 2025-04-16 | 13F | Salem Investment Counselors Inc | 0 | −100,00 | 0 | |||||
| 2025-07-30 | 13F | Bogart Wealth, LLC | 514 | 0,00 | 19 | 5,88 | ||||
| 2025-08-04 | 13F | Atria Investments Llc | 9 633 | 26,68 | 356 | 40,32 | ||||
| 2025-08-08 | 13F | Advyzon Investment Management, LLC | 34 249 | 0,76 | 1 265 | 11,37 | ||||
| 2025-07-22 | 13F | Siligmueller & Norvid Wealth Advisors LLC | 57 722 | −15,62 | 2 167 | −5,17 | ||||
| 2025-07-22 | 13F | Belpointe Asset Management LLC | 24 567 | −0,61 | 907 | 9,94 | ||||
| 2025-07-08 | 13F | Everpar Advisors Llc | 16 856 | −0,18 | 622 | 10,48 | ||||
| 2025-07-23 | 13F | Cannon Wealth Management Services, LLC | 222 851 | 6,36 | 8 230 | 17,81 | ||||
| 2025-08-11 | 13F | Advisor Resource Council | 0 | −100,00 | 0 | |||||
| 2025-07-29 | 13F | Signature Estate & Investment Advisors Llc | 70 874 | 0,92 | 2 617 | 11,60 | ||||
| 2025-07-25 | 13F | Hazlett, Burt & Watson, Inc. | 1 000 | 0,00 | 0 | |||||
| 2025-07-22 | 13F | Woodmont Investment Counsel Llc | 103 409 | 12,72 | 3 819 | 24,61 | ||||
| 2025-07-22 | 13F | Wealthcare Advisory Partners LLC | 264 366 | 12,73 | 9 763 | 24,66 | ||||
| 2025-08-11 | 13F | Private Advisor Group, LLC | 1 199 797 | 4,19 | 44 309 | 15,21 | ||||
| 2025-07-29 | 13F | Koshinski Asset Management, Inc. | 51 326 | 12,55 | 1 895 | 24,43 | ||||
| 2025-08-06 | 13F | Mascagni Wealth Management, Inc. | 18 338 | −29,72 | 677 | −22,27 | ||||
| 2025-07-29 | 13F | Balboa Wealth Partners | 8 795 | 325 | ||||||
| 2025-07-29 | 13F | Burford Brothers, Inc. | 332 972 | −2,13 | 12 296 | 8,21 | ||||
| 2025-08-07 | 13F | Cvfg Llc | 15 170 | 11,14 | 560 | 23,08 | ||||
| 2025-08-14 | 13F | Wells Fargo & Company/mn | 3 137 696 | 6,52 | 115 875 | 17,78 | ||||
| 2025-08-11 | 13F | Principal Securities, Inc. | 267 142 | 21,87 | 9 866 | 28,70 | ||||
| 2025-08-12 | 13F | Lodestone Wealth Management LLC | 60 558 | 0,32 | 2 236 | 10,91 | ||||
| 2025-08-12 | 13F | Indie Asset Partners, LLC | 6 689 | −1,47 | 247 | 9,29 | ||||
| 2025-08-13 | 13F | Beacon Pointe Advisors, LLC | 116 048 | 4 286 | ||||||
| 2025-08-14 | 13F | Florida Financial Advisors, Llc | 0 | −100,00 | 0 | |||||
| 2025-07-28 | 13F | Sagespring Wealth Partners, Llc | 185 471 | 8,14 | 6 849 | 19,57 | ||||
| 2025-08-13 | 13F | Capital Group Private Client Services, Inc. | 4 412 415 | 2,88 | 162 951 | 13,75 | ||||
| 2025-08-08 | 13F | Gts Securities Llc | 0 | −100,00 | 0 | |||||
| 2025-08-12 | 13F | Jpmorgan Chase & Co | 22 025 | −23,08 | 813 | −14,96 | ||||
| 2025-05-14 | 13F | Oarsman Capital, Inc. | 0 | −100,00 | 0 | −100,00 | ||||
| 2025-07-31 | 13F | Hanlon Investment Management, Inc. | 15 678 | 1,79 | 579 | 12,45 | ||||
| 2025-08-18 | 13F | Tyler-Stone Wealth Management | 16 282 | 15,42 | 601 | 27,60 | ||||
| 2025-07-25 | 13F | Cwm, Llc | 580 783 | 3,77 | 21 | 16,67 | ||||
| 2025-07-22 | 13F | DAVENPORT & Co LLC | 21 458 | 3,79 | 792 | 14,78 | ||||
| 2025-08-14 | 13F | Wiley Bros.-aintree Capital, Llc | 456 595 | 21,38 | 16 888 | 34,67 | ||||
| 2025-07-24 | 13F | IFP Advisors, Inc | 380 451 | 10,51 | 14 050 | 22,18 | ||||
| 2025-07-16 | 13F | Kerntke Otto McGlone Wealth Management Group | 19 620 | 21,48 | 725 | 34,32 | ||||
| 2025-07-29 | 13F | International Assets Investment Management, Llc | 15 933 | 67,10 | 588 | 84,91 | ||||
| 2025-07-25 | 13F | Atria Wealth Solutions, Inc. | 288 796 | −19,77 | 10 703 | −11,19 | ||||
| 2025-07-10 | 13F | Kmg Fiduciary Partners, Llc | 48 842 | −3,49 | 1 804 | 6,69 | ||||
| 2025-08-12 | 13F | AlphaCore Capital LLC | 12 343 | 0,64 | 457 | 11,46 | ||||
| 2025-08-12 | 13F/A | Cozad Asset Management Inc | 33 013 | 16,41 | 1 219 | 28,72 | ||||
| 2025-08-04 | 13F | Bay Colony Advisory Group, Inc d/b/a Bay Colony Advisors | 12 337 | 0,24 | 456 | 11,25 | ||||
| 2025-08-12 | 13F | Coldstream Capital Management Inc | 0 | −100,00 | 0 | |||||
| 2025-08-15 | 13F | High Falls Advisors, Inc | 15 876 | 5,65 | 586 | 16,97 | ||||
| 2025-07-25 | 13F | Northwest Capital Management Inc | 3 134 | 0,00 | 116 | 10,58 | ||||
| 2025-08-08 | 13F | Kingsview Wealth Management, LLC | 253 557 | 28,59 | 9 364 | 42,19 | ||||
| 2025-08-07 | 13F | Commerce Bank | 5 419 | −19,35 | 200 | −10,71 | ||||
| 2025-08-11 | 13F | Forge Financial Services LLC | 389 756 | 7,57 | 14 589 | 20,55 | ||||
| 2025-08-14 | 13F | Royal Bank Of Canada | 1 922 030 | −2,67 | 70 980 | 7,62 | ||||
| 2025-08-14 | 13F | Great Valley Advisor Group, Inc. | 194 938 | 24,09 | 7 199 | 37,23 | ||||
| 2025-07-21 | 13F | Investment Planning Advisors, Inc. | 788 011 | 20,79 | 29 101 | 33,56 | ||||
| 2025-08-08 | 13F | CWS Financial Advisors, LLC | 40 581 | 6,66 | 1 499 | 17,95 | ||||
| 2025-08-04 | 13F | Bridgewealth Advisory Group, LLC | 267 169 | 44,00 | 9 867 | 59,23 | ||||
| 2025-08-11 | 13F | Aptus Capital Advisors, LLC | 61 102 | −0,92 | 2 256 | 9,57 | ||||
| 2025-08-11 | 13F | United Advisor Group, LLC | 10 729 | 2,43 | 396 | 13,47 | ||||
| 2025-08-14 | 13F | Benjamin Edwards Inc | 470 078 | 27,42 | 17 360 | 40,89 | ||||
| 2025-07-21 | 13F | Patriot Financial Group Insurance Agency, LLC | 28 329 | 9,33 | 1 046 | 20,92 | ||||
| 2025-08-14 | 13F | Mpwm Advisory Solutions, Llc | 35 | 0,00 | 1 | 0,00 | ||||
| 2025-07-31 | 13F | 180 Wealth Advisors, Llc | 31 269 | 1,29 | 1 155 | 11,93 | ||||
| 2025-08-05 | 13F | Summit Investment Advisory Services, LLC | 0 | −100,00 | 0 | |||||
| 2025-08-06 | NP | LINCOLN VARIABLE INSURANCE PRODUCTS TRUST - LVIP American Funds Vanguard Active Passive Growth Fund Standard Class | 1 790 | 66 | ||||||
| 2025-07-08 | 13F | Advance Capital Management, Inc. | 7 430 | −9,45 | 274 | 0,00 | ||||
| 2025-08-04 | 13F | Arkadios Wealth Advisors | 13 415 | 1,92 | 495 | 12,76 | ||||
| 2025-08-04 | 13F | Integrity Alliance, Llc. | 0 | −100,00 | 0 | |||||
| 2025-07-16 | 13F | Midwest Heritage Bank, FSB | 978 124 | 3,03 | 36 122 | 13,92 | ||||
| 2025-07-28 | 13F | Holistic Planning, LLC | 15 691 | 45,95 | 579 | 61,28 | ||||
| 2025-08-14 | 13F | Sunbelt Securities, Inc. | 240 929 | 3,34 | 8 425 | 8,19 | ||||
| 2025-07-23 | 13F | Clear Creek Financial Management, LLC | 118 786 | 6,79 | 4 387 | 18,06 | ||||
| 2025-07-29 | 13F | Latitude Advisors, LLC | 48 669 | 2,89 | 1 797 | 13,81 | ||||
| 2025-08-05 | 13F | Hunter Associates Investment Management Llc | 16 300 | 0,00 | 1 | |||||
| 2025-08-12 | 13F | Titleist Asset Management, Llc | 7 989 | −1,69 | 295 | 8,86 | ||||
| 2025-08-11 | 13F | Western Wealth Management, LLC | 105 829 | −16,44 | 3 908 | −7,61 | ||||
| 2025-08-13 | 13F | StoneX Group Inc. | 9 092 | −13,95 | 337 | −4,82 | ||||
| 2025-08-19 | 13F | Cim, Llc | 11 182 | 57,54 | 413 | 73,84 | ||||
| 2025-08-14 | 13F | Visionary Wealth Advisors | 15 579 | 3,60 | 575 | 14,54 | ||||
| 2025-07-30 | 13F | Strategic Blueprint, LLC | 647 391 | 8,65 | 23 908 | 20,13 | ||||
| 2025-08-12 | 13F | Proequities, Inc. | 0 | 0 | ||||||
| 2025-08-12 | 13F | Marshall & Sterling Wealth Advisors Inc. | 2 099 | 19,46 | 78 | 32,76 | ||||
| 2025-07-17 | 13F | Investment Advisory Services Inc /tx /adv | 57 850 | 14,38 | 2 136 | 26,47 | ||||
| 2025-07-31 | 13F | Richards, Merrill & Peterson, Inc. | 0 | −100,00 | 0 | |||||
| 2025-08-13 | 13F | Congress Wealth Management LLC / DE / | 37 230 | 7,37 | 1 375 | 17,04 | ||||
| 2025-08-13 | 13F | Summit Wealth Group Llc / Co | 12 396 | 458 | ||||||
| 2025-08-12 | 13F | Putnam Fl Investment Management Co | 14 308 | −63,95 | 528 | −60,15 | ||||
| 2025-07-10 | 13F | Wealth Enhancement Advisory Services, Llc | 673 845 | −1,09 | 25 242 | 10,93 | ||||
| 2025-08-13 | 13F | Baird Financial Group, Inc. | 1 154 988 | 8,29 | 42 654 | 19,74 | ||||
| 2025-07-16 | 13F | St Germain D J Co Inc | 294 083 | 0,36 | 10 860 | 10,96 | ||||
| 2025-07-14 | 13F | AdvisorNet Financial, Inc | 17 216 | 33,51 | 636 | 47,67 | ||||
| 2025-08-13 | 13F | Continuum Advisory, LLC | 112 396 | −6,75 | 4 151 | 3,11 | ||||
| 2025-08-14 | 13F | Mariner, LLC | 52 568 | 23,63 | 1 941 | 36,69 | ||||
| 2025-08-12 | 13F | Wood Tarver Financial Group, LLC | 197 | 0,00 | 0 | −100,00 | ||||
| 2025-08-08 | 13F | Thoroughbred Financial Services, Llc | 121 874 | 11,30 | 4 | 33,33 | ||||
| 2025-08-12 | 13F | J.w. Cole Advisors, Inc. | 48 184 | 21,05 | 1 779 | 33,86 | ||||
| 2025-08-14 | 13F | Challenger Wealth Management | 272 601 | 7,81 | 10 067 | 19,21 | ||||
| 2025-08-08 | 13F | Security Financial Services, INC. | 12 409 | 458 | ||||||
| 2025-07-18 | 13F | Trilogy Capital Inc. | 10 792 | −16,77 | 399 | −8,08 | ||||
| 2025-07-24 | 13F | MSH Capital Advisors LLC | 10 185 | 376 | ||||||
| 2025-07-30 | 13F | Financial Perspectives, Inc | 1 541 | 0,00 | 57 | 9,80 | ||||
| 2025-08-08 | 13F | Cetera Investment Advisers | 4 826 699 | 25,59 | 178 250 | 38,86 | ||||
| 2025-07-30 | 13F | Smith Thornton Advisors LLC | 18 388 | 0,01 | 679 | 10,59 | ||||
| 2025-07-11 | 13F | First PREMIER Bank | 2 234 | 0 | ||||||
| 2025-08-07 | 13F | Allworth Financial LP | 26 870 | 2,19 | 992 | 16,16 | ||||
| 2025-08-11 | 13F | Annis Gardner Whiting Capital Advisors, LLC | 692 | 5,49 | 26 | 19,05 | ||||
| 2025-08-25 | 13F | Silverlake Wealth Management Llc | 14 616 | −0,22 | 540 | 10,22 | ||||
| 2025-07-09 | 13F | Pines Wealth Management, LLC | 64 850 | 7,64 | 2 429 | 34,72 | ||||
| 2025-07-17 | 13F | Janney Montgomery Scott LLC | 548 695 | 23,63 | 20 | 42,86 | ||||
| 2025-08-15 | 13F | Captrust Financial Advisors | 1 828 484 | 6,90 | 67 526 | 18,20 | ||||
| 2025-07-11 | 13F | Lincoln Capital LLC | 26 742 | 7,68 | 988 | 27,03 | ||||
| 2025-05-12 | 13F | Fmr Llc | 0 | −100,00 | 0 | |||||
| 2025-07-25 | 13F | Bill Few Associates, Inc. | 24 482 | 18,67 | 904 | 31,20 | ||||
| 2025-08-14 | 13F | Sei Investments Co | 1 338 685 | 33,84 | 49 438 | 47,98 | ||||
| 2025-07-21 | 13F | Ameritas Advisory Services, LLC | 34 646 | −16,65 | 1 279 | −9,68 | ||||
| 2025-08-08 | 13F | Meridian Wealth Management, LLC | 49 265 | 40,30 | 1 819 | 55,20 | ||||
| 2025-08-01 | 13F | Chilton Capital Management Llc | 2 332 | 149,41 | 86 | 177,42 | ||||
| 2025-08-05 | 13F | Simplex Trading, Llc | 2 886 | 166,73 | 0 | |||||
| 2025-07-23 | 13F | Capital Management Associates, Inc | 59 030 | −50,10 | 2 180 | −44,85 | ||||
| 2025-08-18 | 13F | Wellington Capital Management, Inc. | 7 201 | 1 | ||||||
| 2025-07-22 | 13F | Berger Financial Group, Inc | 115 045 | −6,98 | 4 249 | 2,83 | ||||
| 2025-08-04 | 13F | Creative Financial Designs Inc /adv | 145 220 | −29,89 | 5 363 | −22,49 | ||||
| 2025-08-06 | 13F | Prospera Financial Services Inc | 119 540 | 11,21 | 4 415 | 22,95 | ||||
| 2025-07-11 | 13F | Farther Finance Advisors, LLC | 557 | 21 | ||||||
| 2025-08-12 | 13F | Leigh Baldwin & Co., Llc | 5 503 | 203 | ||||||
| 2025-07-14 | 13F | Abound Wealth Management | 32 | 1 | ||||||
| 2025-07-16 | 13F | Essex Financial Services, Inc. | 266 668 | −0,30 | 9 848 | 10,24 | ||||
| 2025-08-13 | 13F | Capital Analysts, Inc. | 14 073 | 149,12 | 1 | |||||
| 2025-07-16 | 13F | Swisher Financial Concepts, Inc. | 25 081 | −14,05 | 926 | −4,93 | ||||
| 2025-07-31 | 13F | Cambridge Investment Research Advisors, Inc. | 2 493 713 | 10,01 | 92 | 22,67 | ||||
| 2025-08-12 | 13F | CIBC Private Wealth Group, LLC | 2 770 | 0,00 | 102 | 24,39 | ||||
| 2025-05-15 | 13F | MAI Capital Management | 0 | −100,00 | 0 | |||||
| 2025-07-28 | 13F | Axxcess Wealth Management, Llc | 23 011 | −4,37 | 850 | 5,73 | ||||
| 2025-07-23 | 13F | Detalus Advisors, LLC | 8 416 | 0,00 | 311 | 10,32 | ||||
| 2025-05-09 | 13F | Delta Financial Group, Inc. | 17 338 | 5,93 | 1 | |||||
| 2025-08-06 | 13F | Mark Sheptoff Financial Planning, Llc | 2 329 | 0,60 | 86 | 11,69 | ||||
| 2025-05-02 | 13F | Capital A Wealth Management, LLC | 886 | −9,78 | 30 | −14,71 | ||||
| 2025-08-13 | 13F | Aspire Growth Partners LLC | 127 590 | 15,88 | 4 712 | 28,33 | ||||
| 2025-07-22 | 13F | Iron Horse Wealth Management, LLC | 297 | 11 | ||||||
| 2025-08-13 | 13F | Cary Street Partners Financial Llc | 253 233 | −53,93 | 9 352 | −49,06 | ||||
| 2025-08-15 | 13F | Equitable Holdings, Inc. | 138 737 | 162,43 | 5 124 | 190,25 | ||||
| 2025-04-28 | 13F | Strategic Financial Concepts, LLC | 0 | −100,00 | 0 | −100,00 | ||||
| 2025-07-14 | 13F | Ai Financial Services Llc | 108 032 | 17,24 | 3 990 | 29,64 | ||||
| 2025-07-15 | 13F | Fifth Third Bancorp | 1 076 | 40 | ||||||
| 2025-08-12 | 13F | Gladstone Institutional Advisory LLC | 11 156 | −13,48 | 412 | −4,42 | ||||
| 2025-08-14 | 13F | Integrated Wealth Concepts LLC | 142 452 | 28,06 | 5 261 | 41,59 | ||||
| 2025-08-06 | 13F | Vestmark Advisory Solutions, Inc. | 849 562 | 109,73 | 31 374 | 131,90 | ||||
| 2025-08-14 | 13F/A | Rockefeller Capital Management L.P. | 13 898 | 513 | ||||||
| 2025-07-21 | 13F | Barrett & Company, Inc. | 987 | 0,00 | 36 | 12,50 | ||||
| 2025-08-14 | 13F | Gerber Kawasaki Wealth & Investment Management | 180 809 | 5,32 | 6 677 | 16,45 | ||||
| 2025-08-13 | 13F | IAG Wealth Partners, LLC | 2 505 | 14,91 | 93 | 27,78 | ||||
| 2025-08-13 | 13F | Smith, Moore & Co. | 153 458 | −13,98 | 5 667 | −4,88 | ||||
| 2025-07-23 | 13F | Trueblood Wealth Management, LLC | 50 430 | 15,42 | 1 862 | 27,62 | ||||
| 2025-08-01 | 13F | Rossby Financial, LCC | 69 | 0,00 | 3 | 0,00 | ||||
| 2025-08-12 | 13F | LPL Financial LLC | 16 186 883 | 9,10 | 597 782 | 20,63 | ||||
| 2025-08-04 | 13F | Premier Path Wealth Partners, LLC | 32 713 | 0,00 | 1 208 | 10,62 | ||||
| 2025-08-06 | 13F | Founders Financial Securities Llc | 145 839 | 9,85 | 5 386 | 23,88 | ||||
| 2025-07-25 | 13F | Concurrent Investment Advisors, LLC | 92 317 | 130,67 | 3 409 | 155,16 | ||||
| 2025-07-09 | 13F | Procyon Private Wealth Partners, LLC | 16 725 | 0,24 | 618 | 10,77 | ||||
| 2025-08-13 | 13F | Jones Financial Companies Lllp | 3 845 225 | 46,01 | 141 660 | 61,53 | ||||
| 2025-08-14 | 13F | Raymond James Financial Inc | 5 668 346 | 8,63 | 209 332 | 20,11 | ||||
| 2025-08-14 | 13F | Hilltop Holdings Inc. | 6 981 | 258 | ||||||
| 2025-07-17 | 13F | Eclectic Associates Inc /adv | 11 095 | −11,46 | 410 | −2,15 | ||||
| 2025-08-14 | 13F | Jane Street Group, Llc | 160 000 | 11,61 | 5 909 | 23,39 | ||||
| 2025-08-15 | 13F | First Heartland Consultants, Inc. | 18 585 | −53,08 | 686 | −48,11 | ||||
| 2025-07-16 | 13F | ORG Partners LLC | 9 148 | 799,51 | 337 | 891,18 | ||||
| 2025-07-16 | 13F | Signature Resources Capital Management, LLC | 50 455 | 9,14 | 1 863 | 20,66 | ||||
| 2025-05-12 | 13F | Independent Advisor Alliance | 0 | −100,00 | 0 | |||||
| 2025-07-14 | 13F | U.S. Capital Wealth Advisors, LLC | 22 791 | 57,26 | 842 | 73,76 | ||||
| 2025-07-29 | 13F | Stephens Inc /ar/ | 232 010 | 13,50 | 8 568 | 25,50 | ||||
| 2025-08-04 | 13F | IFG Advisory, LLC | 27 806 | 61,95 | 1 027 | 79,06 | ||||
| 2025-07-11 | 13F | AA Financial Advisors, LLC | 381 380 | −0,49 | 14 084 | 10,02 | ||||
| 2025-08-08 | 13F | Sittner & Nelson, Llc | 78 156 | 1,61 | 2 886 | 12,34 | ||||
| 2025-07-15 | 13F | tru Independence LLC | 13 068 | 1,59 | 483 | 12,35 | ||||
| 2025-07-09 | 13F | WealthCare Investment Partners, LLC | 41 906 | 0,50 | 1 570 | 22,67 | ||||
| 2025-08-08 | 13F | Good Life Advisors, LLC | 0 | −100,00 | 0 | |||||
| 2025-08-13 | 13F | Rsm Us Wealth Management Llc | 64 835 | −5,19 | 2 401 | 4,85 | ||||
| 2025-08-12 | 13F | Global Retirement Partners, LLC | 54 362 | 36,33 | 2 008 | 43,97 | ||||
| 2025-08-18 | 13F | Geneos Wealth Management Inc. | 140 501 | 1 807,17 | 5 189 | 2 008,94 | ||||
| 2025-07-23 | 13F | Tcfg Wealth Management, Llc | 27 026 | 97,24 | 998 | 118,38 | ||||
| 2025-08-07 | 13F | Winch Advisory Services, LLC | 1 188 | 0,17 | 44 | 10,26 | ||||
| 2025-08-06 | 13F | Souders Financial Advisors | 932 782 | 5,85 | 34 448 | 17,03 | ||||
| 2025-08-13 | 13F | EverSource Wealth Advisors, LLC | 382 889 | 18,86 | 14 140 | 31,42 | ||||
| 2025-09-04 | 13F/A | Advisor Group Holdings, Inc. | 1 757 275 | 16,42 | 64 400 | 27,72 | ||||
| 2025-08-12 | 13F | Richmond Investment Services, LLC | 23 406 | 154,16 | 864 | 181,43 | ||||
| 2025-08-14 | 13F | Colony Group, LLC | 25 000 | 163,60 | 923 | 192,09 | ||||
| 2025-07-23 | 13F | Seamount Financial Group Inc | 85 417 | 11,49 | 3 154 | 23,30 | ||||
| 2025-07-24 | 13F | Us Bancorp \de\ | 1 115 | 197,33 | 41 | 241,67 | ||||
| 2025-07-17 | 13F | Venture Visionary Partners LLC | 27 697 | 97,88 | 1 023 | 118,84 | ||||
| 2025-08-14 | 13F | Citadel Advisors Llc | Call | 16 300 | −61,83 | 602 | −57,85 | |||
| 2025-08-14 | 13F | Citadel Advisors Llc | 283 714 | 10 478 | ||||||
| 2025-07-30 | 13F | Eqis Capital Management, Inc. | 18 392 | 58,39 | 679 | 75,45 | ||||
| 2025-08-12 | 13F | O'shaughnessy Asset Management, Llc | 34 302 | 59,51 | 1 267 | 76,32 | ||||
| 2025-07-24 | 13F | Reuter James Wealth Management, Llc | 21 256 | 10,75 | 785 | 22,31 | ||||
| 2025-08-06 | 13F | First Horizon Advisors, Inc. | 3 978 | −38,08 | 147 | −31,78 | ||||
| 2025-08-18 | 13F | N.E.W. Advisory Services LLC | 200 | 0,00 | 7 | 16,67 | ||||
| 2025-07-28 | 13F | Cushing Capital Partners, LLC | 132 159 | −0,96 | 4 893 | 9,51 | ||||
| 2025-08-12 | 13F | Virtu Financial LLC | 108 747 | 4 | ||||||
| 2025-08-13 | 13F | M Holdings Securities, Inc. | 24 292 | 1 | ||||||
| 2025-07-15 | 13F | Norden Group Llc | 53 330 | 0,00 | 1 969 | 10,56 | ||||
| 2025-07-23 | 13F | Prime Capital Investment Advisors, LLC | 12 125 | −16,99 | 448 | −8,21 | ||||
| 2025-07-22 | 13F | Simplicity Wealth,LLC | 26 662 | 124,54 | 985 | 148,48 | ||||
| 2025-07-09 | 13F | Dynamic Advisor Solutions LLC | 184 004 | −12,64 | 6 795 | −3,40 | ||||
| 2025-07-24 | 13F | Stonebridge Financial Group, LLC | 0 | −100,00 | 0 | |||||
| 2025-07-25 | 13F | Apollon Wealth Management, LLC | 54 239 | 2 003 | ||||||
| 2025-08-12 | 13F | SRS Capital Advisors, Inc. | 8 088 | −57,61 | 299 | −53,22 | ||||
| 2025-07-09 | 13F | Massmutual Trust Co Fsb/adv | 2 | 0,00 | 0 | |||||
| 2025-07-31 | 13F | Moloney Securities Asset Management, LLC | 35 996 | 0,98 | 1 329 | 11,68 | ||||
| 2025-08-08 | 13F | Larson Financial Group LLC | 2 465 | 0,00 | 91 | 10,98 | ||||
| 2025-08-14 | 13F | Acas, Llc | 5 212 | 201 | ||||||
| 2025-08-15 | 13F | Kestra Advisory Services, LLC | 1 174 544 | 7,28 | 43 376 | 18,62 | ||||
| 2025-07-17 | 13F | G&S Capital LLC | 99 445 | 0,91 | 3 672 | 11,58 | ||||
| 2025-08-06 | 13F | Golden State Wealth Management, LLC | 0 | −100,00 | 0 | −100,00 | ||||
| 2025-08-13 | 13F | VestGen Advisors, LLC | 264 597 | 4,74 | 9 772 | 15,81 | ||||
| 2025-07-21 | 13F | Ascent Group, LLC | 17 295 | −2,88 | 639 | 7,41 | ||||
| 2025-08-12 | 13F | BlackRock, Inc. | 47 500 | 0,00 | 1 754 | 10,59 | ||||
| 2025-07-15 | 13F | Lynch & Associates/in | 32 360 | 9,89 | 1 195 | 21,57 | ||||
| 2025-08-15 | 13F | Lantern Wealth Advisors, LLC | 9 736 | 360 | ||||||
| 2025-07-02 | 13F | HBW Advisory Services LLC | 39 152 | 35,15 | 1 446 | 49,43 | ||||
| 2025-05-16 | 13F/A | Kestra Investment Management, LLC | 0 | −100,00 | 0 | |||||
| 2025-07-14 | 13F | Armstrong Advisory Group, Inc | 0 | −100,00 | 0 | |||||
| 2025-08-04 | 13F | Clear Investment Research, Llc | 1 805 | 0,28 | 67 | 10,00 | ||||
| 2025-08-14 | 13F | Old Mission Capital Llc | 387 686 | 0,96 | 14 317 | 11,62 | ||||
| 2025-07-21 | 13F | Ashton Thomas Securities, Llc | 56 857 | 9,95 | 2 100 | 21,54 | ||||
| 2025-08-11 | 13F | Synergy Investment Management, LLC | 0 | −100,00 | 0 | |||||
| 2025-07-21 | 13F | Ameriflex Group, Inc. | 435 | −75,28 | 16 | −74,14 | ||||
| 2025-08-14 | 13F | Evergreen Wealth Solutions, LLC | 28 975 | 1 070 | ||||||
| 2025-08-14 | 13F | Susquehanna International Group, Llp | 0 | −100,00 | 0 | |||||
| 2025-08-01 | 13F | Gwn Securities Inc. | 22 540 | −52,82 | 832 | −47,84 | ||||
| 2025-07-25 | 13F | We Are One Seven, LLC | 10 590 | −1,93 | 391 | 8,61 | ||||
| 2025-07-17 | 13F | Tempus Wealth Planning, LLC | 55 855 | 4,59 | 2 063 | 15,65 | ||||
| 2025-08-14 | 13F | Aqr Capital Management Llc | 12 455 | −21,10 | 460 | −12,90 | ||||
| 2025-08-14 | 13F | Hrt Financial Lp | 18 424 | 2,24 | 1 | |||||
| 2025-07-24 | 13F | NavPoint Financial, Inc. | 5 839 | 216 | ||||||
| 2025-07-11 | 13F | LongView Wealth Management | 53 631 | 12,99 | 1 981 | 24,92 | ||||
| 2025-08-12 | 13F | Barnes Pettey Financial Advisors, Llc | 95 366 | −0,92 | 3 522 | 9,55 | ||||
| 2025-08-13 | 13F | Renaissance Technologies Llc | 13 900 | 513 | ||||||
| 2025-08-13 | 13F | Townsquare Capital Llc | 0 | −100,00 | 0 | |||||
| 2025-04-29 | 13F | Lee Danner & Bass Inc | 0 | −100,00 | 0 | |||||
| 2025-08-13 | 13F | Cerity Partners LLC | 31 211 | 0,12 | 1 153 | 10,66 | ||||
| 2025-07-22 | 13F | Beacon Financial Advisory LLC | 20 108 | −4,68 | 743 | 5,40 | ||||
| 2025-08-07 | 13F | Kestra Private Wealth Services, Llc | 31 539 | 15,06 | 1 165 | 27,21 | ||||
| 2025-07-11 | 13F | Lantz Financial LLC | 43 182 | 7,65 | 1 595 | 19,04 | ||||
| 2025-07-28 | 13F | RFG Advisory, LLC | 35 575 | 125,34 | 1 314 | 149,15 | ||||
| 2025-07-14 | 13F | Park Avenue Securities Llc | 109 461 | 11,10 | 4 | 33,33 | ||||
| 2025-07-31 | 13F | West Michigan Advisors, Llc | 5 560 | 205 | ||||||
| 2025-07-23 | 13F | Valmark Advisers, Inc. | 402 564 | 6,79 | 14 867 | 18,08 | ||||
| 2025-07-31 | 13F | Hobart Private Capital, LLC | 14 293 | 4,66 | 528 | 15,57 | ||||
| 2025-08-11 | 13F | HighTower Advisors, LLC | 139 386 | 19,10 | 5 148 | 31,70 | ||||
| 2025-07-28 | 13F | Harbour Investments, Inc. | 412 211 | 0,48 | 15 223 | 11,09 | ||||
| 2025-07-15 | 13F | World Equity Group, Inc. | 7 553 | −13,43 | 279 | −4,47 | ||||
| 2025-04-08 | 13F | Private Client Services, Llc | 0 | −100,00 | 0 | |||||
| 2025-07-09 | 13F | Beacon Financial Group | 8 979 | 0,03 | 332 | 10,70 | ||||
| 2025-07-16 | 13F | Perigon Wealth Management, LLC | 9 374 | 10,59 | 346 | 22,26 | ||||
| 2025-08-07 | 13F | PFG Advisors | 109 197 | 0,51 | 4 033 | 11,14 | ||||
| 2025-07-23 | 13F | Kingswood Wealth Advisors, Llc | 62 571 | −2,10 | 2 311 | 8,25 | ||||
| 2025-08-14 | 13F | Harmony Asset Management Llc | 13 999 | 6,88 | 517 | 18,08 | ||||
| 2025-07-18 | 13F | PFG Investments, LLC | 8 156 | 2,77 | 301 | 13,58 | ||||
| 2025-08-05 | 13F | Westside Investment Management, Inc. | 450 | 17 | ||||||
| 2025-08-13 | 13F | Capital International Investors | 33 275 | 0,01 | 1 229 | 10,53 | ||||
| 2025-08-14 | 13F | Comerica Bank | 12 200 | 3,66 | 451 | 14,50 | ||||
| 2025-08-19 | 13F | Advisory Services Network, LLC | 108 403 | −26,63 | 4 139 | −16,13 | ||||
| 2025-08-29 | 13F | Centaurus Financial, Inc. | 136 665 | 20,14 | 5 | 66,67 | ||||
| 2025-08-11 | 13F | Rothschild Investment Llc | 18 139 | 7,41 | 670 | 18,62 | ||||
| 2025-08-14 | 13F | Bank Of America Corp /de/ | 465 996 | 50,48 | 17 209 | 66,40 | ||||
| 2025-08-14 | 13F | Smartleaf Asset Management LLC | 169 565 | 16,63 | 6 247 | 29,02 | ||||
| 2025-08-15 | 13F | Morgan Stanley | 5 008 826 | 14,95 | 184 976 | 27,09 | ||||
| 2025-07-07 | 13F | Thurston, Springer, Miller, Herd & Titak, Inc. | 6 356 | 24,02 | 235 | 36,84 | ||||
| 2025-08-05 | 13F | GPS Wealth Strategies Group, LLC | 8 520 | −3,80 | 315 | 6,44 | ||||
| 2025-08-14 | 13F/A | Skopos Labs, Inc. | 318 | 12 | ||||||
| 2025-07-25 | 13F | Transcendent Capital Group LLC | 139 941 | 1,08 | 5 168 | 11,79 | ||||
| 2025-07-10 | 13F | Sovran Advisors, LLC | 124 932 | 26,97 | 4 647 | 50,63 | ||||
| 2025-08-01 | 13F | Envestnet Asset Management Inc | 10 327 349 | 13,62 | 381 389 | 25,63 | ||||
| 2025-08-14 | 13F | Ambassador Advisors, LLC | 16 053 | 0,00 | 593 | 10,45 | ||||
| 2025-09-09 | 13F | NWF Advisory Services Inc. | 12 802 | 90,59 | 473 | 110,71 | ||||
| 2025-07-30 | 13F | Cullen/frost Bankers, Inc. | 93 425 | 63,57 | 3 450 | 80,91 | ||||
| 2025-07-31 | 13F | Whipplewood Advisors, LLC | 557 | 4,90 | 21 | 17,65 | ||||
| 2025-07-31 | 13F | Oppenheimer & Co Inc | 21 275 | 89,53 | 786 | 109,89 | ||||
| 2025-08-27 | 13F/A | Brinker Capital Investments, LLC | 411 239 | 1,99 | 15 187 | 12,77 | ||||
| 2025-08-04 | 13F | Kovack Advisors, Inc. | 5 989 | −12,95 | 221 | −3,49 | ||||
| 2025-08-11 | 13F | Nations Financial Group Inc, /ia/ /adv | 44 621 | 16,67 | 1 648 | 28,97 | ||||
| 2025-08-04 | 13F | Pensionmark Financial Group, Llc | 88 604 | 37,07 | 3 272 | 51,55 | ||||
| 2025-08-12 | 13F | Cravens & Co Advisors, LLC | 12 551 | −11,81 | 464 | −2,53 | ||||
| 2025-05-15 | 13F | National Wealth Management Group, LLC | 9 559 | −0,42 | 319 | −4,78 | ||||
| 2025-08-14 | 13F | Mml Investors Services, Llc | 3 032 309 | 11,03 | 112 | 21,98 | ||||
| 2025-07-22 | 13F | Olistico Wealth, LLC | 68 256 | 0,02 | 2 521 | 10,57 | ||||
| 2025-07-16 | 13F | Independent Wealth Network Inc. | 33 719 | 4,57 | 1 245 | 15,71 | ||||
| 2025-08-14 | 13F | Herold Advisors, Inc. | 9 736 | 360 | ||||||
| 2025-07-07 | 13F | Trust Co | 840 | 0,00 | 31 | 10,71 | ||||
| 2025-07-24 | 13F | FinDec Wealth Services, Inc. | 7 739 | −67,82 | 286 | −64,51 | ||||
| 2025-05-15 | 13F/A | Orion Portfolio Solutions, LLC | 403 211 | 12,99 | 13 467 | 7,92 | ||||
| 2025-08-05 | 13F | HFG Advisors, Inc. | 9 925 | 0,00 | 367 | 10,57 | ||||
| 2025-08-14 | 13F | Citadel Advisors Llc | Put | 0 | −100,00 | 0 | ||||
| 2025-08-06 | 13F | Wedbush Securities Inc | 12 745 | −15,44 | 0 | |||||
| 2025-07-16 | 13F | Signaturefd, Llc | 306 | 0,00 | 11 | 10,00 | ||||
| 2025-08-04 | 13F | Assetmark, Inc | 852 157 | 6,14 | 31 470 | 17,36 | ||||
| 2025-08-14 | 13F | GWM Advisors LLC | 826 422 | −17,82 | 30 520 | −9,14 | ||||
| 2025-07-10 | 13F | Affiance Financial, LLC | 262 404 | −46,54 | 9 691 | −40,90 | ||||
| 2025-07-14 | 13F | Sowell Financial Services LLC | 44 258 | 10,81 | 1 634 | 22,49 | ||||
| 2025-08-06 | 13F | Commonwealth Equity Services, Llc | 3 415 953 | 7,31 | 126 | 18,87 | ||||
| 2025-07-03 | 13F | Arvest Investments, Inc. | 409 | 0,00 | 15 | 15,38 | ||||
| 2025-07-08 | 13F | Nbc Securities, Inc. | 175 829 | 8,03 | 6 | 20,00 | ||||
| 2025-07-02 | 13F | Central Pacific Bank - Trust Division | 85 | 0,00 | 3 | 50,00 | ||||
| 2025-07-22 | 13F | Ergawealth Advisors, Inc. | 34 142 | 1 261 | ||||||
| 2025-07-29 | 13F | CapWealth Advisors, LLC | 7 523 | −14,48 | 278 | −5,46 | ||||
| 2025-07-25 | 13F | M.e. Allison & Co., Inc. | 55 598 | 3,02 | 2 053 | 13,93 | ||||
| 2025-08-11 | 13F | Perennial Investment Advisors, LLC | 86 113 | 40,12 | 3 180 | 54,97 | ||||
| 2025-07-29 | 13F | Stratos Wealth Partners, LTD. | 29 374 | 51,30 | 1 085 | 67,28 | ||||
| 2025-07-14 | 13F | Golden State Equity Partners | 0 | −100,00 | 0 | |||||
| 2025-07-23 | 13F | Armstrong, Fleming & Moore, Inc | 42 441 | 1 567 | ||||||
| 2025-07-30 | 13F/A | KPP Advisory Services LLC | 37 341 | 11,06 | 1 379 | 22,91 | ||||
| 2025-08-14 | 13F | Stifel Financial Corp | 847 182 | 14,85 | 31 286 | 26,99 | ||||
| 2025-07-17 | 13F | Worth Financial Advisory Group, LLC | 11 135 | 0,25 | 411 | 11,08 | ||||
| 2025-07-17 | 13F | Nelson, Van Denburg & Campbell Wealth Management Group, LLC | 5 690 | 210 | ||||||
| 2025-07-15 | 13F | Mather Group, Llc. | 0 | −100,00 | 0 | |||||
| 2025-08-12 | 13F | Insigneo Advisory Services, Llc | 6 030 | 223 | ||||||
| 2025-08-13 | 13F | Natixis Advisors, L.p. | 138 283 | 16,96 | 5 | 66,67 | ||||
| 2025-07-28 | 13F | Mutual Advisors, LLC | 193 476 | 32,32 | 7 449 | 55,78 | ||||
| 2025-07-29 | 13F | Private Trust Co Na | 21 081 | 82,96 | 779 | 102,60 | ||||
| 2025-08-04 | 13F | Balentine LLC | 29 107 | 0,00 | 1 075 | 10,49 | ||||
| 2025-08-13 | 13F | Gateway Wealth Partners, LLC | 27 702 | −2,21 | 1 023 | 8,14 | ||||
| 2025-08-12 | 13F | Entruity Wealth, LLC | 314 621 | 7,21 | 11 619 | 18,54 | ||||
| 2025-08-14 | 13F | D. E. Shaw & Co., Inc. | 8 004 | −64,89 | 296 | −61,24 | ||||
| 2025-08-04 | 13F | Mayflower Financial Advisors, LLC | 43 159 | −3,77 | 1 594 | 6,34 | ||||
| 2025-08-07 | 13F | Nwam Llc | 12 975 | 11,35 | 496 | 27,25 | ||||
| 2025-07-16 | 13F | Owen LaRue, LLC | 9 484 | 23,09 | 350 | 36,19 | ||||
| 2025-08-05 | 13F | Carolinas Wealth Consulting Llc | 0 | −100,00 | 0 | −100,00 | ||||
| 2025-08-11 | 13F | Landaas & Co /wi /adv | 19 090 | −9,77 | 705 | −0,28 | ||||
| 2025-08-04 | 13F | Daymark Wealth Partners, Llc | 6 818 | 0,40 | 252 | 11,06 | ||||
| 2025-05-06 | 13F | Venturi Wealth Management, LLC | 0 | −100,00 | 0 | |||||
| 2025-07-22 | 13F | Confluence Wealth Services, Inc. | 38 786 | 12,97 | 1 432 | 31,14 | ||||
| 2025-07-25 | 13F | Envestnet Portfolio Solutions, Inc. | 221 166 | −31,05 | 8 168 | −23,77 | ||||
| 2025-08-13 | 13F | Vermillion & White Wealth Management Group, LLC | 3 965 | 6,53 | 146 | 17,74 | ||||
| 2025-07-18 | 13F | Truist Financial Corp | 186 633 | 8,83 | 6 892 | 20,34 | ||||
| 2025-08-14 | 13F | Advisor OS, LLC | 22 796 | 24,98 | 842 | 38,10 | ||||
| 2025-07-30 | 13F | D.a. Davidson & Co. | 443 816 | 2,12 | 16 390 | 12,91 | ||||
| 2025-07-11 | 13F | Pinnacle Bancorp, Inc. | 192 | 0,00 | 7 | 16,67 | ||||
| 2025-07-18 | 13F | Vicus Capital | 14 937 | 68,17 | 552 | 86,15 | ||||
| 2025-08-27 | 13F | Cypress Capital Advisors, LLC | 12 280 | −27,46 | 454 | −19,82 | ||||
| 2025-08-06 | 13F | TKG Advisors, LLC | 15 936 | 14,24 | 589 | 26,45 | ||||
| 2025-07-30 | 13F | Bleakley Financial Group, LLC | 83 904 | −6,48 | 3 099 | 3,40 | ||||
| 2025-08-13 | 13F | Keystone Financial Group | 52 778 | 16,65 | 1 950 | 29,05 | ||||
| 2025-08-05 | 13F | Plante Moran Financial Advisors, LLC | 0 | −100,00 | 0 | |||||
| 2025-07-24 | 13F | Endeavor Private Wealth, Inc. | 105 721 | 34,58 | 3 915 | 48,82 | ||||
| 2025-07-25 | 13F | Total Clarity Wealth Management, Inc. | 13 493 | −2,41 | 498 | 3,11 | ||||
| 2025-08-12 | 13F | RiverFront Investment Group, LLC | 7 487 | 276 | ||||||
| 2025-08-12 | 13F | Jacobi Capital Management LLC | 19 286 | 712 | ||||||
| 2025-08-14 | 13F | Ameriprise Financial Inc | 11 828 | −80,07 | 437 | −78,00 | ||||
| 2025-08-05 | 13F | Sigma Planning Corp | 23 663 | 26,67 | 874 | 40,13 | ||||
| 2025-08-13 | 13F | Northwestern Mutual Wealth Management Co | 3 865 009 | 8,81 | 142 735 | 20,31 | ||||
| 2025-08-07 | 13F | Resources Investment Advisors, LLC. | 32 528 | −31,16 | 1 201 | −23,89 | ||||
| 2025-08-27 | 13F | Tribridge Partners Financial LLC | 12 065 | 0 | ||||||
| 2025-08-08 | 13F | Capital Investment Advisory Services, LLC | 10 936 | 404 | ||||||
| 2025-07-16 | 13F | Octavia Wealth Advisors, LLC | 11 835 | 2,03 | 438 | 12,89 | ||||
| 2025-08-08 | 13F | Avantax Advisory Services, Inc. | 115 626 | 23,42 | 4 270 | 36,47 | ||||
| 2025-08-14 | 13F | McIlrath & Eck, LLC | 900 | 0,00 | 33 | 10,00 | ||||
| 2025-07-16 | 13F/A | CX Institutional | 330 | 0,00 | 0 | |||||
| 2025-08-14 | 13F | CoreCap Advisors, LLC | 653 | −74,94 | 24 | −72,41 | ||||
| 2025-08-08 | 13F | Creative Planning | 25 191 | 0,43 | 930 | 11,11 | ||||
| 2025-08-12 | 13F | Cornerstone Wealth Management, LLC | 9 461 | 0,00 | 349 | 10,79 | ||||
| 2025-08-14 | 13F | Investmark Advisory Group LLC | 9 782 | −3,42 | 361 | 6,80 |