Grundläggande statistik
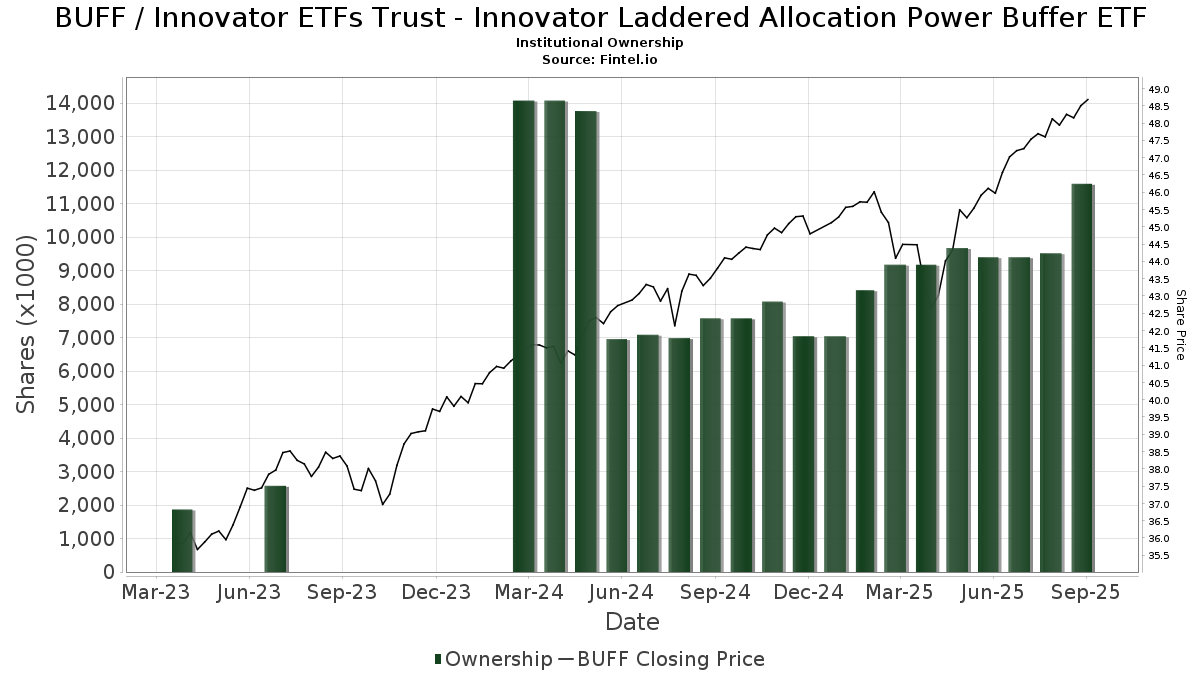
| Institutionella ägare | 129 total, 129 long only, 0 short only, 0 long/short - change of 4,00% MRQ |
| Genomsnittlig portföljallokering | 0.5071 % - change of 8,69% MRQ |
| Institutionella aktier (lång) | 11 593 564 (ex 13D/G) - change of 2,19MM shares 23,33% MRQ |
| Institutionellt värde (lång) | $ 520 825 USD ($1000) |
Institutionellt ägande och aktieägare
Innovator ETFs Trust - Innovator Laddered Allocation Power Buffer ETF (US:BUFF) har 129 Institutionella ägare och aktieägare som har lämnat in 13D/G- eller 13F-formulär till Securities Exchange Commission (SEC). Dessa institut innehar totalt 11,593,564 aktier. Största aktieägare inkluderar LPL Financial LLC, Envestnet Asset Management Inc, Advisor Group Holdings, Inc., GGM Financials LLC, Kingsview Wealth Management, LLC, Kfg Wealth Management, Llc, Cetera Investment Advisers, Prasad Wealth Partners, LLC, Holos Integrated Wealth LLC, and Raymond James Financial Inc .
Innovator ETFs Trust - Innovator Laddered Allocation Power Buffer ETF (BATS:BUFF) Institutionell ägarstruktur visar institutioners och fonders nuvarande positioner i företaget, samt de senaste förändringarna i positionernas storlek. Större aktieägare kan vara enskilda investerare, fonder, hedgefonder eller institutioner. Bilaga 13D visar att investeraren äger (eller ägde) mer än 5% av företaget och avser (eller avsåg) att aktivt eftersträva en förändring av affärsstrategin. Schedule 13G indikerar en passiv investering på över 5%.
The share price as of September 11, 2025 is 48,51 / share. Previously, on September 12, 2024, the share price was 43,69 / share. This represents an increase of 11,03% over that period.
Fondsentimentets poäng
Fondsentimentet poängen(fka Ägarackumulation-poäng) visar vilka aktier som är mest köpta av fonder. Det är resultatet av en sofistikerad kvantitativ flerfaktormodell som identifierar företag med de högsta nivåerna av institutionell ackumulering. Poängsättningsmodellen använder en kombination av den totala ökningen av redovisade ägare, förändringarna i portföljallokeringarna för dessa ägare och andra mått. Siffran sträcker sig från 0 till 100, där högre siffror indikerar en högre nivå av ackumulering i förhållande till sina konkurrenter, och 50 är genomsnittet.
Uppdateringsfrekvens: Dagligen
Se Ownership Explorer, som innehåller en lista över de högst rankade företagen.
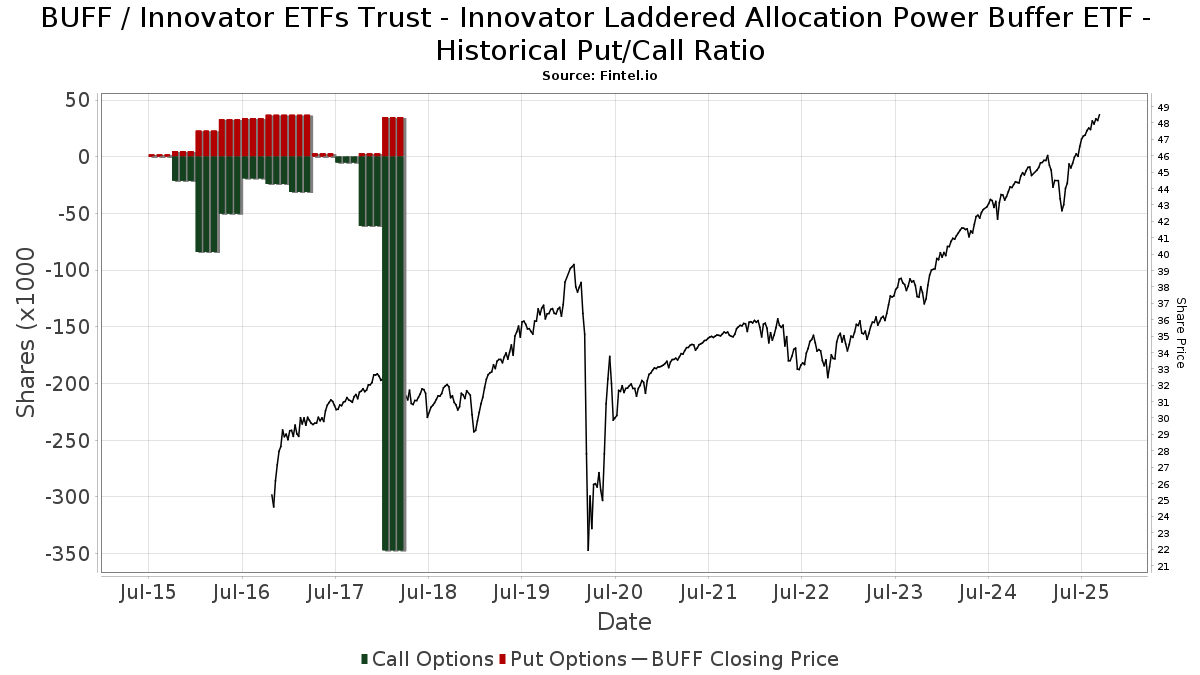
Institutionell sälj/köp-kvot
Förutom att rapportera vanliga eget kapital- och skuldemissioner måste institutioner med mer än 100MM tillgångar under förvaltning också avslöja sina innehav av sälj- och köpoptioner. Eftersom säljoptioner i allmänhet indikerar ett negativt sentiment och köpoptioner indikerar ett positivt sentiment, kan vi få en uppfattning om det övergripande institutionella sentimentet genom att plotta förhållandet mellan säljoptioner och köpoptioner. Diagrammet till höger visar det historiska förhållandet mellan sälj- och köpoptioner för detta instrument.
Genom att använda sälj/köp-kvoten som en indikator på aktieägarnas sentiment undviker man en av de största bristerna med att använda det totala institutionella ägandet, nämligen att en betydande del av de förvaltade tillgångarna investeras passivt för att följa index. Passivt förvaltade fonder köper vanligtvis inte optioner, så indikatorn för sälj/köp-kvoten ger en bättre bild av stämningen i aktivt förvaltade fonder.
13F- och NPORT-arkiveringar
Detaljer om 13F-arkiveringar är gratis. Detaljer om NP-arkiveringar kräver ett premiummedlemskap. Gröna rader indikerar nya positioner. Röda rader indikerar stängda positioner. Klicka på länk symbolen för att se hela transaktionshistoriken.
Uppgradera
för att låsa upp premiumdata och exportera till Excel ![]() .
.
| Fil Datum | Källa | Investerare | Typ | Genomsnittligt pris (beräknat) |
Aktier | Δ Aktier (%) |
Rapporterat värde (1000 USD) |
Δ Värde (%) |
Portföljallokering (%) |
|
|---|---|---|---|---|---|---|---|---|---|---|
| 2025-07-25 | 13F | Hazlett, Burt & Watson, Inc. | 26 702 | 3 503,51 | 1 | |||||
| 2025-07-22 | 13F | Wealthcare Advisory Partners LLC | 40 409 | 94,77 | 1 899 | 107,77 | ||||
| 2025-08-07 | 13F | Sound View Wealth Advisors Group, LLC | 30 370 | −1,10 | 1 427 | 5,47 | ||||
| 2025-07-14 | 13F | Buska Wealth Management, LLC | 231 838 | 114,03 | 10 896 | 128,19 | ||||
| 2025-07-25 | 13F | Atria Wealth Solutions, Inc. | 53 914 | −11,66 | 2 534 | −5,84 | ||||
| 2025-08-01 | 13F/A | GGM Financials LLC | 504 153 | 3,59 | 23 695 | 10,43 | ||||
| 2025-08-12 | 13F | J.w. Cole Advisors, Inc. | 14 951 | 0,00 | 703 | 6,53 | ||||
| 2025-07-30 | 13F | Caliber Wealth Management, LLC / KS | 10 247 | 482 | ||||||
| 2025-04-17 | 13F | Atlas Private Wealth Advisors | 0 | −100,00 | 0 | |||||
| 2025-07-21 | 13F | Seros Financial, LLC | 74 894 | 1,36 | 3 520 | 8,07 | ||||
| 2025-07-22 | 13F | Merit Financial Group, LLC | 71 361 | 12,70 | 3 354 | 20,14 | ||||
| 2025-07-25 | 13F | Cwm, Llc | 346 | −34,59 | 0 | |||||
| 2025-07-31 | 13F | Cambridge Investment Research Advisors, Inc. | 169 334 | −0,34 | 8 | 0,00 | ||||
| 2025-08-14 | 13F | Wells Fargo & Company/mn | 0 | 0 | ||||||
| 2025-08-05 | 13F | Bank of New York Mellon Corp | 13 392 | 0,01 | 629 | 6,61 | ||||
| 2025-07-10 | 13F | Sovran Advisors, LLC | 20 919 | −77,47 | 985 | −75,15 | ||||
| 2025-07-30 | 13F | IMG Wealth Management, Inc. | 6 953 | 0,00 | 327 | 6,54 | ||||
| 2025-08-11 | 13F | Principal Securities, Inc. | 24 618 | 222,61 | 1 157 | 238,30 | ||||
| 2025-04-22 | 13F | Castleview Partners, Llc | 0 | −100,00 | 0 | |||||
| 2025-08-04 | 13F | Atria Investments Llc | 19 333 | −1,86 | 909 | 4,61 | ||||
| 2025-08-12 | 13F | LPL Financial LLC | 2 790 469 | 224,86 | 131 152 | 246,30 | ||||
| 2025-08-08 | 13F | Collaborative Wealth Managment Inc. | 28 927 | 8,65 | 1 360 | 15,86 | ||||
| 2025-08-12 | 13F | Change Path, LLC | 67 615 | 8,98 | 3 178 | 16,16 | ||||
| 2025-07-22 | 13F | Siligmueller & Norvid Wealth Advisors LLC | 13 829 | 102,50 | 654 | 116,94 | ||||
| 2025-08-13 | 13F | BCJ Capital Management, LLC | 10 115 | 5,57 | 475 | 12,56 | ||||
| 2025-07-30 | 13F | Onyx Bridge Wealth Group LLC | 9 750 | 0,00 | 458 | 6,76 | ||||
| 2025-07-17 | 13F | Applied Capital LLC | 5 225 | −42,07 | 246 | −38,29 | ||||
| 2025-08-06 | 13F | AE Wealth Management LLC | 2 150 | −96,74 | 101 | −96,53 | ||||
| 2025-07-15 | 13F | Armis Advisers, LLC | 33 894 | 0,00 | 1 593 | 6,63 | ||||
| 2025-07-30 | 13F | Brookstone Capital Management | 132 342 | 5,98 | 6 220 | 12,99 | ||||
| 2025-08-14 | 13F | Planwiser Financial, Llc | 45 422 | −29,00 | 2 169 | −23,53 | ||||
| 2025-08-11 | 13F | HighTower Advisors, LLC | 161 890 | 9,50 | 7 609 | 16,72 | ||||
| 2025-07-18 | 13F | Trilogy Capital Inc. | 0 | −100,00 | 0 | |||||
| 2025-08-15 | 13F | Kestra Advisory Services, LLC | 93 213 | 104,22 | 4 381 | 117,74 | ||||
| 2025-07-10 | 13F | Atticus Wealth Management, Llc | 520 | 24 | ||||||
| 2025-08-14 | 13F | Garden State Investment Advisory Services LLC | 104 439 | −2,50 | 4 909 | 3,94 | ||||
| 2025-07-30 | 13F | Capstone Triton Financial Group, LLC | 6 853 | 26,98 | 322 | 33,06 | ||||
| 2025-08-12 | 13F | MAI Capital Management | 137 | 0,00 | 6 | 0,00 | ||||
| 2025-08-13 | 13F | Holos Integrated Wealth LLC | 308 564 | 5,78 | 14 765 | 14,81 | ||||
| 2025-08-08 | 13F | Cetera Investment Advisers | 400 966 | 4,81 | 18 845 | 11,72 | ||||
| 2025-08-05 | 13F | Sigma Planning Corp | 4 824 | −30,66 | 227 | −26,14 | ||||
| 2025-08-13 | 13F | Townsquare Capital Llc | 0 | −100,00 | 0 | |||||
| 2025-07-30 | 13F | Strategic Blueprint, LLC | 18 436 | 45,57 | 866 | 55,20 | ||||
| 2025-07-30 | 13F | LifeWealth Investments, LLC | 227 813 | 27,67 | 10 707 | 36,10 | ||||
| 2025-07-16 | 13F | Vestia Personal Wealth Advisors | 36 352 | −2,92 | 1 709 | 3,45 | ||||
| 2025-08-08 | 13F | Avantax Advisory Services, Inc. | 111 783 | 10,75 | 5 254 | 18,04 | ||||
| 2025-08-11 | 13F | Bellwether Advisors, LLC | 8 396 | −20,76 | 395 | −15,63 | ||||
| 2025-07-21 | 13F | DHJJ Financial Advisors, Ltd. | 6 799 | −7,05 | 320 | −0,93 | ||||
| 2025-07-03 | 13F | City Center Advisors, LLC | 18 884 | −13,87 | 888 | −8,18 | ||||
| 2025-07-28 | 13F | Mutual Advisors, LLC | 199 053 | 2,25 | 9 499 | 11,60 | ||||
| 2025-08-25 | 13F | BLVD Private Wealth, LLC | 6 590 | 310 | ||||||
| 2025-08-14 | 13F | Susquehanna International Group, Llp | 35 418 | −69,30 | 1 665 | −67,28 | ||||
| 2025-08-14 | 13F | Mml Investors Services, Llc | 91 966 | 2,66 | 4 | 33,33 | ||||
| 2025-08-13 | 13F | Colonial Trust Co / SC | 629 | 0,00 | 30 | 7,41 | ||||
| 2025-07-25 | 13F | Concurrent Investment Advisors, LLC | 12 599 | 592 | ||||||
| 2025-08-14 | 13F | Jane Street Group, Llc | 109 591 | 402,46 | 5 151 | 435,90 | ||||
| 2025-08-13 | 13F | VestGen Advisors, LLC | 8 384 | 399 | ||||||
| 2025-08-04 | 13F | JDM Financial Group LLC | 40 843 | 0,30 | 1 920 | 6,91 | ||||
| 2025-07-28 | 13F | BRYN MAWR TRUST Co | 758 | 0,00 | 36 | 6,06 | ||||
| 2025-07-08 | 13F | Nbc Securities, Inc. | 934 | 0,00 | 0 | |||||
| 2025-07-16 | 13F | Southern Capital Advisors, Llc | 12 675 | −9,88 | 596 | −4,03 | ||||
| 2025-07-01 | 13F | Harbor Investment Advisory, Llc | 3 230 | 0,00 | 152 | 6,34 | ||||
| 2025-08-14 | 13F | Mpwm Advisory Solutions, Llc | 15 360 | 0,00 | 722 | 6,50 | ||||
| 2025-08-04 | 13F | Assetmark, Inc | 0 | −100,00 | 0 | |||||
| 2025-07-10 | 13F | Signal Advisors Wealth, LLC | 6 742 | 317 | ||||||
| 2025-08-14 | 13F | CoreCap Advisors, LLC | 11 446 | 18,07 | 538 | 25,76 | ||||
| 2025-04-24 | 13F | Philip James Wealth Mangement, LLC | 0 | −100,00 | 0 | |||||
| 2025-08-14 | 13F | Old Mission Capital Llc | 12 603 | 592 | ||||||
| 2025-08-12 | 13F | Steward Partners Investment Advisory, Llc | 19 208 | 2,92 | 903 | 9,73 | ||||
| 2025-07-31 | 13F | Stegent Equity Advisors, Inc. | 10 326 | 0,00 | 485 | 6,59 | ||||
| 2025-08-12 | 13F | Maripau Wealth Management Llc | 5 616 | 264 | ||||||
| 2025-08-14 | 13F | Harvest Investment Services, LLC | 6 900 | 0,00 | 324 | 6,58 | ||||
| 2025-07-14 | 13F | Kfg Wealth Management, Llc | 422 151 | 3,76 | 19 841 | 10,61 | ||||
| 2025-08-12 | 13F | Weaver Consulting Group | 16 718 | 9,94 | 786 | 17,16 | ||||
| 2025-08-04 | 13F | Creative Financial Designs Inc /adv | 0 | −100,00 | 0 | |||||
| 2025-07-31 | 13F | Guardian Financial Partners, LLC | 0 | −100,00 | 0 | |||||
| 2025-07-21 | 13F | Andina Capital Management, LLC | 55 161 | 35,08 | 2 593 | 44,00 | ||||
| 2025-07-16 | 13F | Arlington Capital Management, Inc. | 0 | −100,00 | 0 | |||||
| 2025-08-11 | 13F | Private Advisor Group, LLC | 29 280 | 13,40 | 1 376 | 20,91 | ||||
| 2025-07-30 | 13F | Red Crane Wealth Management, Llc | 6 020 | −4,28 | 283 | 1,81 | ||||
| 2025-08-05 | 13F | Milestone Asset Management, Llc | 48 599 | −1,46 | 2 284 | 5,06 | ||||
| 2025-08-14 | 13F | Diversify Wealth Management, Llc | 33 248 | 11,93 | 1 595 | 22,41 | ||||
| 2025-05-15 | 13F | Integrated Wealth Concepts LLC | 0 | −100,00 | 0 | |||||
| 2025-05-15 | 13F | Citadel Advisors Llc | 0 | −100,00 | 0 | |||||
| 2025-08-14 | 13F | Visionary Wealth Advisors | 89 776 | −2,94 | 4 219 | 3,46 | ||||
| 2025-07-14 | 13F | AdvisorNet Financial, Inc | 9 837 | −11,19 | 462 | −5,33 | ||||
| 2025-07-22 | 13F | Comprehensive Financial Consultants Institutional, Inc. | 36 574 | −0,67 | 1 719 | 5,85 | ||||
| 2025-08-08 | 13F | Kingsview Wealth Management, LLC | 497 538 | −8,27 | 23 384 | −2,22 | ||||
| 2025-07-14 | 13F | Southland Equity Partners LLC | 52 378 | −0,58 | 2 462 | 5,99 | ||||
| 2025-07-17 | 13F | Janney Montgomery Scott LLC | 5 339 | 0,00 | 0 | |||||
| 2025-07-10 | 13F | Focus Financial Network, Inc. | 53 810 | −10,50 | 2 529 | −4,57 | ||||
| 2025-07-28 | 13F | Harbour Investments, Inc. | 164 210 | 1,07 | 7 718 | 7,73 | ||||
| 2025-07-29 | 13F | Stratos Wealth Partners, LTD. | 59 156 | 100,22 | 2 780 | 113,52 | ||||
| 2025-08-12 | 13F | Bedel Financial Consulting, Inc. | 4 568 | −20,03 | 215 | −15,08 | ||||
| 2025-07-23 | 13F | Prasad Wealth Partners, LLC | 371 690 | −5,58 | 17 469 | 0,65 | ||||
| 2025-08-04 | 13F | AlphaStar Capital Management, LLC | 10 330 | 24,91 | 486 | 33,24 | ||||
| 2025-08-06 | 13F | Soltis Investment Advisors LLC | 29 819 | 0,23 | 1 401 | 6,86 | ||||
| 2025-08-05 | 13F | GPS Wealth Strategies Group, LLC | 11 994 | 7,39 | 564 | 14,43 | ||||
| 2025-08-11 | 13F | Capital Square, LLC | 8 768 | 13,96 | 413 | 21,83 | ||||
| 2025-08-15 | 13F | Morgan Stanley | 3 295 | 0,00 | 155 | 6,21 | ||||
| 2025-08-04 | 13F | IFG Advisory, LLC | 59 285 | 0,73 | 2 786 | 7,40 | ||||
| 2025-08-12 | 13F | Proequities, Inc. | 0 | 0 | ||||||
| 2025-08-06 | 13F | Commonwealth Equity Services, Llc | 229 662 | −1,24 | 11 | 0,00 | ||||
| 2025-09-04 | 13F/A | Advisor Group Holdings, Inc. | 506 268 | −13,56 | 23 795 | −7,85 | ||||
| 2025-08-13 | 13F | Ofc Financial Planning, Llc | 22 396 | 1,32 | 1 053 | 8,01 | ||||
| 2025-08-08 | 13F | Davies Financial Advisors, Inc. | 5 269 | 0,00 | 248 | 6,47 | ||||
| 2025-07-09 | 13F | Channel Wealth Llc | 42 954 | −55,37 | 2 019 | −52,44 | ||||
| 2025-07-22 | 13F | Diligent Investors, LLC | 42 895 | 0,01 | 2 016 | 6,61 | ||||
| 2025-07-07 | 13F | Thurston, Springer, Miller, Herd & Titak, Inc. | 1 025 | 48 | ||||||
| 2025-08-14 | 13F | Financial Network Wealth Advisors LLC | 46 767 | −6,50 | 2 198 | −0,32 | ||||
| 2025-07-29 | 13F | BKD Wealth Advisors, LLC | 142 715 | 46,16 | 6 708 | 55,80 | ||||
| 2025-08-06 | 13F | Founders Financial Securities Llc | 10 949 | −1,04 | 515 | 5,98 | ||||
| 2025-08-08 | 13F | Pnc Financial Services Group, Inc. | 0 | −100,00 | 0 | |||||
| 2025-07-22 | 13F | Beacon Financial Advisory LLC | 13 832 | 650 | ||||||
| 2025-08-01 | 13F | Integral Investment Advisors, Inc. | 8 229 | −2,20 | 387 | 4,32 | ||||
| 2025-08-11 | 13F | Blue Bell Private Wealth Management, Llc | 820 | 0,00 | 39 | 5,56 | ||||
| 2025-04-29 | 13F | 4J Wealth Management LLC | 0 | −100,00 | 0 | |||||
| 2025-07-21 | 13F | Ameritas Advisory Services, LLC | 1 005 | 47 | ||||||
| 2025-07-18 | 13F | Truist Financial Corp | 10 228 | 6,66 | 481 | 13,74 | ||||
| 2025-08-13 | 13F | Cheviot Value Management, LLC | 244 | 0,00 | 12 | 10,00 | ||||
| 2025-08-14 | 13F | Acas, Llc | 28 821 | −1,94 | 1 387 | 6,70 | ||||
| 2025-07-24 | 13F | Capital Advisors, Ltd. LLC | 285 | 0,00 | 0 | |||||
| 2025-08-07 | 13F | Resources Investment Advisors, LLC. | 13 656 | 642 | ||||||
| 2025-08-08 | 13F | Capital Investment Advisory Services, LLC | 3 385 | −43,00 | 159 | −39,08 | ||||
| 2025-08-11 | 13F | Advisor Resource Council | 14 008 | 18,88 | 658 | 26,78 | ||||
| 2025-07-24 | 13F | Columbia Advisory Partners Llc | 12 104 | 569 | ||||||
| 2025-08-01 | 13F | Gwn Securities Inc. | 107 795 | 11,21 | 5 066 | 18,56 | ||||
| 2025-08-12 | 13F | Global Retirement Partners, LLC | 719 | −25,80 | 34 | −23,26 | ||||
| 2025-08-19 | 13F | Advisory Services Network, LLC | 43 430 | 8,36 | 2 068 | 17,03 | ||||
| 2025-08-14 | 13F | Raymond James Financial Inc | 240 737 | −3,02 | 11 315 | 3,38 | ||||
| 2025-08-14 | 13F | GWM Advisors LLC | 9 091 | −8,78 | 427 | −2,73 | ||||
| 2025-07-28 | 13F | Axxcess Wealth Management, Llc | 33 868 | 197,19 | 1 592 | 216,93 | ||||
| 2025-07-29 | 13F | Private Trust Co Na | 0 | −100,00 | 0 | |||||
| 2025-08-12 | 13F | Jpmorgan Chase & Co | 1 473 | −0,81 | 69 | 6,15 | ||||
| 2025-07-21 | 13F | Patriot Financial Group Insurance Agency, LLC | 29 300 | 6,45 | 1 377 | 13,52 | ||||
| 2025-07-24 | 13F | IFP Advisors, Inc | 6 788 | 15,46 | 319 | 23,17 | ||||
| 2025-08-14 | 13F | Glen Eagle Advisors, LLC | 54 173 | −3,24 | 2 546 | 3,16 | ||||
| 2025-08-06 | 13F | Golden State Wealth Management, LLC | 555 | 0,00 | 26 | 8,33 | ||||
| 2025-08-15 | 13F | Captrust Financial Advisors | 18 126 | 16,86 | 852 | 24,60 | ||||
| 2025-07-10 | 13F | Wealth Enhancement Advisory Services, Llc | 50 275 | 5,86 | 2 375 | 13,43 | ||||
| 2025-04-10 | 13F | Sugar Maple Asset Management, LLC | 0 | −100,00 | 0 | |||||
| 2025-07-09 | 13F | Lineweaver Wealth Advisors, LLC | 40 821 | 6,69 | 1 919 | 13,76 | ||||
| 2025-08-01 | 13F | Envestnet Asset Management Inc | 1 048 774 | −1,85 | 49 292 | 4,63 | ||||
| 2025-08-13 | 13F | SageView Advisory Group, LLC | 86 937 | −28,24 | 4 151 | −22,28 | ||||
| 2025-08-15 | 13F | Chapman Financial Group, Llc | 8 371 | 204,84 | 393 | 219,51 | ||||
| 2025-08-18 | 13F | Geneos Wealth Management Inc. | 1 058 | 39,21 | 50 | 48,48 |