Grundläggande statistik
| Institutionella ägare | 186 total, 186 long only, 0 short only, 0 long/short - change of 0,00% MRQ |
| Genomsnittlig portföljallokering | 0.2903 % - change of −6,40% MRQ |
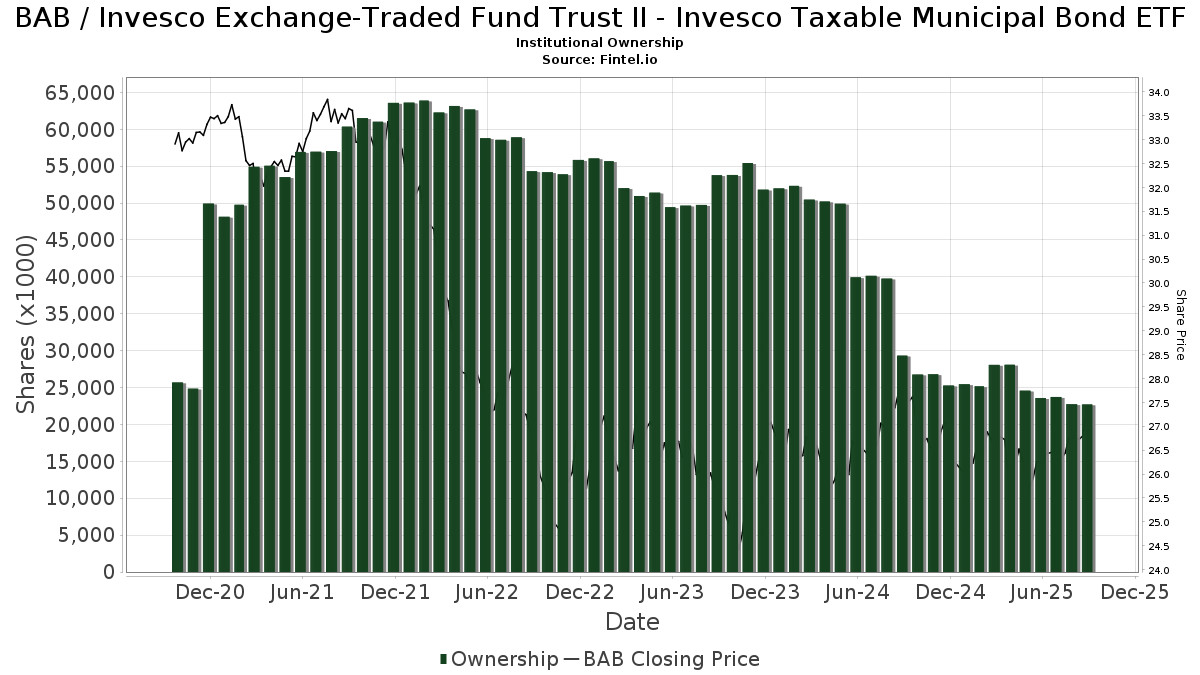
| Institutionella aktier (lång) | 22 707 449 (ex 13D/G) - change of −0,87MM shares −3,71% MRQ |
| Institutionellt värde (lång) | $ 590 865 USD ($1000) |
Institutionellt ägande och aktieägare
Invesco Exchange-Traded Fund Trust II - Invesco Taxable Municipal Bond ETF (US:BAB) har 186 Institutionella ägare och aktieägare som har lämnat in 13D/G- eller 13F-formulär till Securities Exchange Commission (SEC). Dessa institut innehar totalt 22,707,449 aktier. Största aktieägare inkluderar Raymond James Financial Inc, HighTower Advisors, LLC, State Of Wisconsin Investment Board, Ameriprise Financial Inc, Bank Of America Corp /de/, UBS Group AG, Envestnet Asset Management Inc, Bank Of Montreal /can/, Pnc Financial Services Group, Inc., and Sumitomo Mitsui Financial Group, Inc. .
Invesco Exchange-Traded Fund Trust II - Invesco Taxable Municipal Bond ETF (ARCA:BAB) Institutionell ägarstruktur visar institutioners och fonders nuvarande positioner i företaget, samt de senaste förändringarna i positionernas storlek. Större aktieägare kan vara enskilda investerare, fonder, hedgefonder eller institutioner. Bilaga 13D visar att investeraren äger (eller ägde) mer än 5% av företaget och avser (eller avsåg) att aktivt eftersträva en förändring av affärsstrategin. Schedule 13G indikerar en passiv investering på över 5%.
The share price as of September 10, 2025 is 27,32 / share. Previously, on September 11, 2024, the share price was 27,97 / share. This represents a decline of 2,32% over that period.
Fondsentimentets poäng
Fondsentimentet poängen(fka Ägarackumulation-poäng) visar vilka aktier som är mest köpta av fonder. Det är resultatet av en sofistikerad kvantitativ flerfaktormodell som identifierar företag med de högsta nivåerna av institutionell ackumulering. Poängsättningsmodellen använder en kombination av den totala ökningen av redovisade ägare, förändringarna i portföljallokeringarna för dessa ägare och andra mått. Siffran sträcker sig från 0 till 100, där högre siffror indikerar en högre nivå av ackumulering i förhållande till sina konkurrenter, och 50 är genomsnittet.
Uppdateringsfrekvens: Dagligen
Se Ownership Explorer, som innehåller en lista över de högst rankade företagen.
Institutionell sälj/köp-kvot
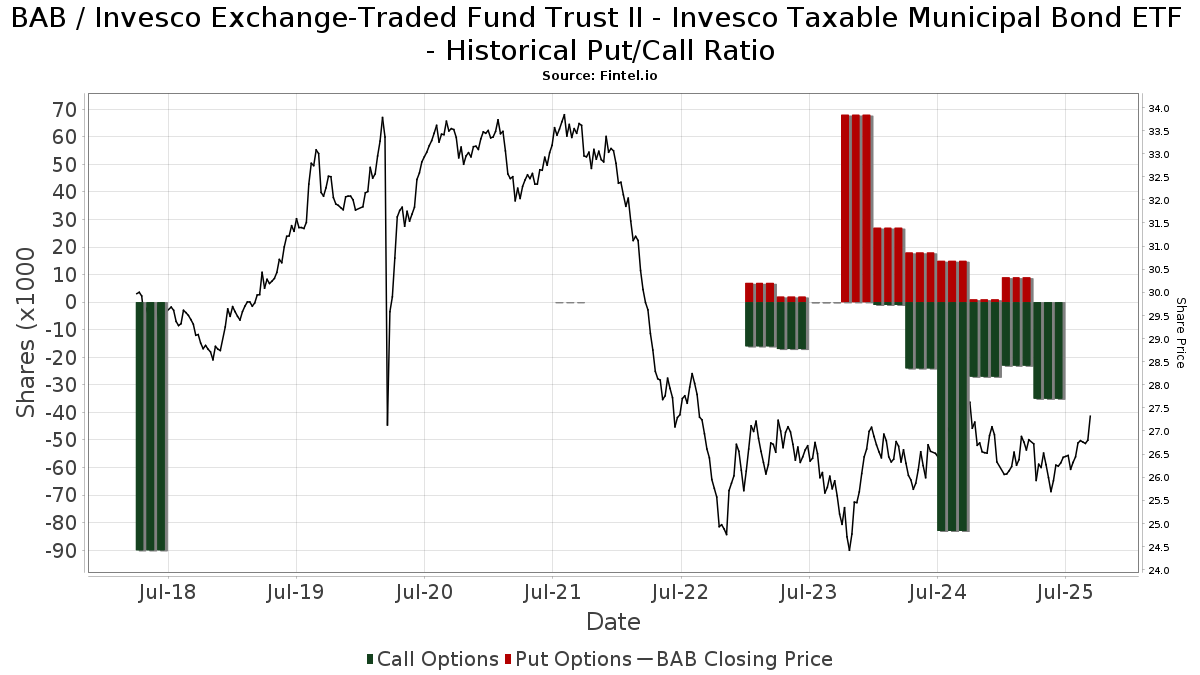
Förutom att rapportera vanliga eget kapital- och skuldemissioner måste institutioner med mer än 100MM tillgångar under förvaltning också avslöja sina innehav av sälj- och köpoptioner. Eftersom säljoptioner i allmänhet indikerar ett negativt sentiment och köpoptioner indikerar ett positivt sentiment, kan vi få en uppfattning om det övergripande institutionella sentimentet genom att plotta förhållandet mellan säljoptioner och köpoptioner. Diagrammet till höger visar det historiska förhållandet mellan sälj- och köpoptioner för detta instrument.
Genom att använda sälj/köp-kvoten som en indikator på aktieägarnas sentiment undviker man en av de största bristerna med att använda det totala institutionella ägandet, nämligen att en betydande del av de förvaltade tillgångarna investeras passivt för att följa index. Passivt förvaltade fonder köper vanligtvis inte optioner, så indikatorn för sälj/köp-kvoten ger en bättre bild av stämningen i aktivt förvaltade fonder.
13F- och NPORT-arkiveringar
Detaljer om 13F-arkiveringar är gratis. Detaljer om NP-arkiveringar kräver ett premiummedlemskap. Gröna rader indikerar nya positioner. Röda rader indikerar stängda positioner. Klicka på länk symbolen för att se hela transaktionshistoriken.
Uppgradera
för att låsa upp premiumdata och exportera till Excel ![]() .
.
| Fil Datum | Källa | Investerare | Typ | Genomsnittligt pris (beräknat) |
Aktier | Δ Aktier (%) |
Rapporterat värde (1000 USD) |
Δ Värde (%) |
Portföljallokering (%) |
|
|---|---|---|---|---|---|---|---|---|---|---|
| 2025-07-28 | 13F | Harbour Investments, Inc. | 5 824 | 25,65 | 155 | 25,20 | ||||
| 2025-08-06 | 13F | Moors & Cabot, Inc. | 14 417 | 382 | ||||||
| 2025-07-21 | 13F | Ameritas Advisory Services, LLC | 380 | 10 | ||||||
| 2025-08-12 | 13F | Change Path, LLC | 8 768 | −5,23 | 233 | −5,69 | ||||
| 2025-08-08 | 13F | Wrapmanager Inc | 114 938 | 13,50 | 3 049 | 12,88 | ||||
| 2025-08-14 | 13F | Wiley Bros.-aintree Capital, Llc | 40 072 | 345,29 | 1 063 | 344,77 | ||||
| 2025-08-12 | 13F | Franklin Resources Inc | 40 | 1 | ||||||
| 2025-08-12 | 13F | Archer Investment Corp | 400 | 0,00 | 11 | 0,00 | ||||
| 2025-08-08 | 13F | Hartland & Co., LLC | 0 | −100,00 | 0 | |||||
| 2025-08-08 | 13F | United Asset Strategies, Inc. | 22 330 | −68,45 | 592 | −68,64 | ||||
| 2025-08-07 | 13F | Donaldson Capital Management, Llc | 43 888 | −0,58 | 1 164 | −1,10 | ||||
| 2025-08-11 | 13F | Principal Securities, Inc. | 0 | −100,00 | 0 | |||||
| 2025-07-24 | 13F | Blair William & Co/il | 2 905 | −54,37 | 77 | −54,44 | ||||
| 2025-04-15 | 13F | First United Bank Trust/ | 0 | −100,00 | 0 | |||||
| 2025-07-14 | 13F | Opal Wealth Advisors, LLC | 3 093 | 116,60 | 82 | 115,79 | ||||
| 2025-07-23 | 13F | Family Legacy, Inc. | 43 216 | 1,07 | 1 147 | 0,53 | ||||
| 2025-07-17 | 13F | Janney Montgomery Scott LLC | 29 641 | 2,22 | 1 | |||||
| 2025-08-11 | 13F | Aptus Capital Advisors, LLC | 1 050 | 0,00 | 28 | −3,57 | ||||
| 2025-05-14 | 13F | Caitlin John, LLC | 0 | −100,00 | 0 | |||||
| 2025-08-11 | 13F | HighTower Advisors, LLC | 1 319 358 | 3,83 | 35 003 | 3,24 | ||||
| 2025-09-04 | 13F/A | Advisor Group Holdings, Inc. | 106 096 | 18,32 | 2 815 | 17,64 | ||||
| 2025-07-23 | 13F | Prime Capital Investment Advisors, LLC | 9 890 | −27,09 | 262 | −27,42 | ||||
| 2025-08-04 | 13F | Atria Investments Llc | 7 980 | −39,51 | 212 | −83,95 | ||||
| 2025-08-08 | 13F | Cetera Investment Advisers | 81 990 | −0,03 | 2 175 | −0,59 | ||||
| 2025-08-15 | 13F | CI Private Wealth, LLC | 120 685 | −4,69 | 3 202 | −5,24 | ||||
| 2025-07-25 | 13F | Apollon Wealth Management, LLC | 7 926 | 210 | ||||||
| 2025-07-25 | 13F | Cwm, Llc | 805 | 73,87 | 0 | |||||
| 2025-08-08 | 13F | Tortoise Investment Management, LLC | 386 850 | −0,75 | 10 263 | −1,31 | ||||
| 2025-08-15 | 13F | Morgan Stanley | 497 211 | −2,69 | 13 191 | −3,24 | ||||
| 2025-05-15 | 13F | Vermillion & White Wealth Management Group, LLC | 0 | −100,00 | 0 | |||||
| 2025-08-11 | 13F | Wealthspire Advisors, LLC | 216 111 | −11,54 | 5 733 | −12,04 | ||||
| 2025-08-14 | 13F | Money Concepts Capital Corp | 117 281 | 1,08 | 3 111 | 0,52 | ||||
| 2025-08-13 | 13F | Cerity Partners LLC | 30 161 | −1,51 | 800 | −1,96 | ||||
| 2025-05-13 | 13F | Sequent Planning LLC | 0 | −100,00 | 0 | |||||
| 2025-05-08 | 13F | Us Bancorp \de\ | 0 | −100,00 | 0 | |||||
| 2025-07-22 | 13F | Glassy Mountain Advisors, Inc. | 36 260 | 2,14 | 962 | 1,48 | ||||
| 2025-08-14 | 13F | Susquehanna International Group, Llp | 9 255 | −8,48 | 246 | −8,92 | ||||
| 2025-08-04 | 13F | Keybank National Association/oh | 180 630 | −0,47 | 4 792 | −1,03 | ||||
| 2025-07-31 | 13F | Rational Advisors Llc | 157 852 | −67,38 | 4 188 | −67,57 | ||||
| 2025-07-29 | 13F | Shelter Mutual Insurance Co | 198 589 | 0,00 | 5 269 | −0,57 | ||||
| 2025-08-15 | 13F | Kestra Advisory Services, LLC | 49 097 | 12,32 | 1 303 | 11,66 | ||||
| 2025-08-14 | 13F/A | Barclays Plc | 200 000 | 0,00 | 5 | 0,00 | ||||
| 2025-08-12 | 13F | Jpmorgan Chase & Co | 58 335 | −10,42 | 1 548 | −10,94 | ||||
| 2025-07-24 | 13F | Conning Inc. | 490 000 | 0,00 | 13 000 | −0,57 | ||||
| 2025-08-14 | 13F | Quartz Partners, LLC | 0 | −100,00 | 0 | |||||
| 2025-08-14 | 13F | Cibc World Markets Corp | 13 936 | −65,83 | 370 | −66,08 | ||||
| 2025-08-14 | 13F | Comerica Bank | 11 220 | 0,20 | 298 | −0,34 | ||||
| 2025-07-28 | 13F | Hudson Capital Management LLC | 110 915 | −2,67 | 2 943 | −3,22 | ||||
| 2025-08-01 | 13F | Advisory Alpha, LLC | 70 669 | 33,76 | 1 875 | 33,00 | ||||
| 2025-07-18 | 13F | PFG Investments, LLC | 61 260 | 0,78 | 1 625 | 0,25 | ||||
| 2025-08-14 | 13F | Garden State Investment Advisory Services LLC | 8 674 | 0,00 | 230 | −0,43 | ||||
| 2025-08-14 | 13F | Citadel Advisors Llc | Put | 0 | −100,00 | 0 | ||||
| 2025-07-21 | 13F | Mirae Asset Global Investments Co., Ltd. | 96 940 | 18,25 | 2 572 | 18,10 | ||||
| 2025-07-25 | 13F | Atria Wealth Solutions, Inc. | 14 355 | 3,98 | 381 | 3,26 | ||||
| 2025-07-10 | 13F | Tompkins Financial Corp | 221 | 0,00 | 6 | 0,00 | ||||
| 2025-07-23 | 13F | Ti-trust, Inc | 73 462 | 30,12 | 1 949 | 29,35 | ||||
| 2025-07-14 | 13F | Park Avenue Securities Llc | 18 829 | −0,44 | 0 | |||||
| 2025-08-14 | 13F | Lazard Asset Management Llc | 0 | |||||||
| 2025-08-08 | 13F | Pnc Financial Services Group, Inc. | 735 073 | −13,74 | 19 501 | −14,22 | ||||
| 2025-08-05 | 13F | Gould Asset Management Llc /ca/ | 600 486 | 7,25 | 15 931 | 6,64 | ||||
| 2025-08-14 | 13F | Smartleaf Asset Management LLC | 47 027 | −0,99 | 1 243 | −1,51 | ||||
| 2025-05-06 | 13F | Kovack Advisors, Inc. | 0 | −100,00 | 0 | |||||
| 2025-08-06 | 13F | Stokes Family Office, LLC | 12 800 | 0,00 | 340 | −0,59 | ||||
| 2025-07-24 | 13F | Trust Co Of Toledo Na /oh/ | 849 | 23 | ||||||
| 2025-07-29 | NP | MAMB - Monarch Ambassador Income ETF | 298 728 | 4,27 | 7 809 | 1,21 | ||||
| 2025-08-11 | 13F | Citigroup Inc | 4 | 0 | ||||||
| 2025-08-14 | 13F | Wells Fargo & Company/mn | 665 889 | 2,43 | 17 666 | 1,86 | ||||
| 2025-08-05 | 13F | Tsfg, Llc | 306 | 2,00 | 0 | |||||
| 2025-04-30 | 13F | Allworth Financial LP | 0 | −100,00 | 0 | |||||
| 2025-07-24 | 13F | IFP Advisors, Inc | 2 862 | −1,58 | 76 | −2,60 | ||||
| 2025-07-10 | 13F | Anderson Hoagland & Co | 64 267 | −1,65 | 1 705 | 0,06 | ||||
| 2025-08-13 | 13F | Flow Traders U.s. Llc | 0 | −100,00 | 0 | |||||
| 2025-08-13 | 13F | StoneX Group Inc. | 0 | −100,00 | 0 | −100,00 | ||||
| 2025-05-01 | 13F | Quest 10 Wealth Builders, Inc. | 210 | 0,00 | 6 | 0,00 | ||||
| 2025-07-11 | 13F | Farther Finance Advisors, LLC | 15 | 0,00 | 0 | |||||
| 2025-08-14 | 13F | Jane Street Group, Llc | 565 488 | 44,42 | 15 002 | 43,61 | ||||
| 2025-07-07 | 13F | Bangor Savings Bank | 27 533 | −19,78 | 730 | −20,22 | ||||
| 2025-04-23 | 13F | Creative Financial Designs Inc /adv | 0 | −100,00 | 0 | |||||
| 2025-08-11 | 13F | Nations Financial Group Inc, /ia/ /adv | 12 374 | 3,60 | 328 | 3,14 | ||||
| 2025-08-12 | 13F | CIBC Private Wealth Group, LLC | 2 155 | 0,00 | 57 | 1,79 | ||||
| 2025-08-14 | 13F | Qube Research & Technologies Ltd | 0 | −100,00 | 0 | |||||
| 2025-08-13 | 13F | Jones Financial Companies Lllp | 104 132 | −7,27 | 2 752 | −7,71 | ||||
| 2025-07-08 | 13F | Nbc Securities, Inc. | 13 907 | −4,48 | 0 | |||||
| 2025-08-07 | 13F | Samalin Investment Counsel, LLC | 9 336 | 0,09 | 248 | −0,40 | ||||
| 2025-07-29 | 13F | Stephens Inc /ar/ | 13 435 | 1,25 | 356 | 0,56 | ||||
| 2025-08-14 | 13F | Millennium Management Llc | 9 945 | 264 | ||||||
| 2025-08-07 | 13F | CENTRAL TRUST Co | 250 | 0,00 | 7 | 0,00 | ||||
| 2025-08-13 | 13F | D L Carlson Investment Group Inc | 56 559 | −41,77 | 1 501 | −42,11 | ||||
| 2025-08-04 | 13F | Savvy Advisors, Inc. | 35 943 | 5,03 | 954 | 4,38 | ||||
| 2025-07-17 | 13F | Oceanside Advisors LLC | 107 036 | 4,01 | 2 840 | 3,42 | ||||
| 2025-08-11 | 13F | Private Advisor Group, LLC | 54 861 | −0,84 | 1 455 | −1,42 | ||||
| 2025-06-26 | NP | HNDL - Strategy Shares Nasdaq 7 HANDL(TM) Index ETF | 466 004 | 35,66 | 12 358 | 36,60 | ||||
| 2025-07-15 | 13F | Farrell Financial LLC | 8 267 | 0,92 | 219 | 0,46 | ||||
| 2025-07-17 | 13F | Wolff Wiese Magana Llc | 350 | 0,00 | 9 | 0,00 | ||||
| 2025-07-17 | 13F | City Holding Co | 180 | −51,22 | 5 | −55,56 | ||||
| 2025-08-07 | 13F | Roberts Glore & Co Inc /il/ | 48 002 | 0,00 | 1 273 | −0,55 | ||||
| 2025-07-07 | 13F | Thurston, Springer, Miller, Herd & Titak, Inc. | 1 461 | 0,00 | 39 | 0,00 | ||||
| 2025-07-15 | 13F | Capstone Capital Wealth Advisors | 26 257 | 0,00 | 697 | −0,57 | ||||
| 2025-06-30 | NP | Northern Lights Fund Trust - PFG Fidelity Institutional AM(R) Bond ESG Strategy Class R Shares | 222 053 | 6,54 | 5 889 | 7,27 | ||||
| 2025-07-31 | 13F/A | Avion Wealth | 230 | 0,00 | 0 | |||||
| 2025-08-18 | 13F/A | National Bank Of Canada /fi/ | 1 450 | 11,97 | 38 | 11,76 | ||||
| 2025-08-14 | 13F | UBS Group AG | 774 495 | 1,94 | 20 547 | 1,37 | ||||
| 2025-07-29 | 13F | Private Trust Co Na | 10 299 | 2,12 | 273 | 1,49 | ||||
| 2025-08-12 | 13F | Centric Wealth Management | 23 222 | −0,54 | 619 | −0,64 | ||||
| 2025-08-11 | 13F | Rothschild Investment Llc | 17 625 | 0,00 | 468 | −0,64 | ||||
| 2025-07-29 | 13F | Koshinski Asset Management, Inc. | 15 213 | 0,00 | 404 | −0,49 | ||||
| 2025-08-07 | 13F | Winthrop Capital Management, LLC | 360 | 0,00 | 0 | |||||
| 2025-08-11 | 13F | Traub Capital Management LLC | 12 440 | 330 | ||||||
| 2025-08-14 | 13F | Engineers Gate Manager LP | 13 554 | 360 | ||||||
| 2025-07-25 | 13F | We Are One Seven, LLC | 27 244 | −7,33 | 723 | −7,91 | ||||
| 2025-04-21 | 13F | Envestnet Portfolio Solutions, Inc. | 0 | −100,00 | 0 | |||||
| 2025-05-15 | 13F/A | Orion Portfolio Solutions, LLC | 15 299 | 408 | ||||||
| 2025-05-08 | 13F | Hoxton Planning & Management, LLC | 0 | −100,00 | 0 | −100,00 | ||||
| 2025-05-08 | 13F | Great Valley Advisor Group, Inc. | 0 | −100,00 | 0 | −100,00 | ||||
| 2025-08-06 | 13F | Commonwealth Equity Services, Llc | 32 119 | −3,78 | 1 | |||||
| 2025-08-05 | 13F | Simplex Trading, Llc | 0 | −100,00 | 0 | |||||
| 2025-08-13 | 13F | Cresset Asset Management, LLC | 10 032 | 0,02 | 266 | −0,37 | ||||
| 2025-08-14 | 13F | Citadel Advisors Llc | Call | 35 800 | 55,65 | 950 | 54,81 | |||
| 2025-08-14 | 13F | Citadel Advisors Llc | 31 150 | 119,64 | 826 | 118,52 | ||||
| 2025-08-08 | 13F | Capital Investment Advisory Services, LLC | 3 028 | 0,00 | 80 | 0,00 | ||||
| 2025-08-14 | 13F | Bnp Paribas Arbitrage, Sa | 44 517 | −69,44 | 1 181 | −69,61 | ||||
| 2025-08-13 | 13F | Sumitomo Mitsui Financial Group, Inc. | 681 581 | −8,01 | 18 082 | −8,53 | ||||
| 2025-08-14 | 13F | Mml Investors Services, Llc | 66 606 | −50,51 | 2 | −66,67 | ||||
| 2025-08-14 | 13F | Raymond James Financial Inc | 1 537 781 | 0,31 | 40 797 | −0,26 | ||||
| 2025-08-14 | 13F | Modern Wealth Management, LLC | 40 618 | 1 078 | ||||||
| 2025-07-30 | 13F | Onyx Bridge Wealth Group LLC | 38 841 | −89,86 | 1 030 | −89,92 | ||||
| 2025-08-04 | 13F | Pensionmark Financial Group, Llc | 27 026 | 5,62 | 717 | 5,13 | ||||
| 2025-07-18 | 13F | Truist Financial Corp | 193 361 | −6,29 | 5 130 | −6,81 | ||||
| 2025-08-12 | 13F | Proequities, Inc. | 0 | 0 | ||||||
| 2025-08-12 | 13F | AlphaCore Capital LLC | 1 250 | 33 | ||||||
| 2025-05-15 | 13F | Gwn Securities Inc. | 0 | −100,00 | 0 | |||||
| 2025-07-10 | 13F | Peoples Bank/KS | 0 | −100,00 | 0 | |||||
| 2025-08-14 | 13F | State Of Wisconsin Investment Board | 1 318 800 | 0,00 | 34 988 | −0,56 | ||||
| 2025-08-01 | 13F | Schmidt P J Investment Management Inc | 0 | −100,00 | 0 | |||||
| 2025-07-31 | 13F | Oppenheimer & Co Inc | 19 974 | −1,96 | 530 | −2,58 | ||||
| 2025-05-09 | 13F | GeoWealth Management, LLC | 0 | −100,00 | 0 | |||||
| 2025-05-12 | 13F | Commons Capital, Llc | 0 | −100,00 | 0 | |||||
| 2025-08-12 | 13F | SRS Capital Advisors, Inc. | 2 376 | 0,00 | 63 | 0,00 | ||||
| 2025-06-26 | NP | FIRS - FIRE Funds(TM) Wealth Builder ETF | 4 917 | 200,00 | 130 | 202,33 | ||||
| 2025-08-07 | 13F | 1620 Investment Advisors, Inc. | 1 165 | 0,00 | 31 | −3,23 | ||||
| 2025-08-14 | 13F | GWM Advisors LLC | 57 685 | 6,52 | 1 530 | 5,96 | ||||
| 2025-08-12 | 13F | Global Retirement Partners, LLC | 4 334 | 634,58 | 115 | 660,00 | ||||
| 2025-07-30 | 13F | Whittier Trust Co Of Nevada Inc | 9 089 | −19,88 | 241 | −20,20 | ||||
| 2025-08-14 | 13F | STAR Financial Bank | 59 909 | 39,19 | 1 589 | 38,41 | ||||
| 2025-08-05 | 13F | Bank of New York Mellon Corp | 367 643 | 2,71 | 9 754 | 2,13 | ||||
| 2025-08-13 | 13F | Baker Avenue Asset Management, LP | 0 | −100,00 | 0 | |||||
| 2025-07-30 | 13F | Whittier Trust Co | 4 033 | 0,00 | 107 | −0,93 | ||||
| 2025-07-11 | 13F | Caldwell Securities, Inc | 450 | 0,00 | 12 | −8,33 | ||||
| 2025-07-30 | 13F | Patten Group, Inc. | 86 140 | −4,68 | 2 285 | −5,23 | ||||
| 2025-08-14 | 13F | Brinker Capital Investments, LLC | 0 | −100,00 | 0 | |||||
| 2025-08-18 | 13F | Hershey Financial Advisers, LLC | 133 502 | 3 542 | ||||||
| 2025-08-12 | 13F | Country Trust Bank | 140 000 | 0,00 | 3 714 | −0,56 | ||||
| 2025-07-31 | 13F | Ssa Swiss Advisors Ag | 45 186 | −8,47 | 1 190 | −9,51 | ||||
| 2025-08-14 | 13F/A | Rockefeller Capital Management L.P. | 16 340 | 0,88 | 434 | 0,23 | ||||
| 2025-07-17 | 13F | Wagner Wealth Management, Llc | 68 | 1,49 | 2 | 0,00 | ||||
| 2025-08-12 | 13F | Atlas Capital Advisors Llc | 21 176 | 196,42 | 562 | 195,26 | ||||
| 2025-07-07 | 13F | Versant Capital Management, Inc | 1 090 | 1,02 | 29 | 0,00 | ||||
| 2025-08-04 | 13F | Spire Wealth Management | 1 375 | −16,62 | 36 | −16,28 | ||||
| 2025-08-07 | 13F | Fagan Associates, Inc. | 18 821 | −1,30 | 499 | −1,77 | ||||
| 2025-08-12 | 13F | Steward Partners Investment Advisory, Llc | 2 300 | 0,00 | 61 | 0,00 | ||||
| 2025-07-31 | 13F | Whipplewood Advisors, LLC | 29 483 | 524,51 | 782 | 2,49 | ||||
| 2025-08-14 | 13F | Goldman Sachs Group Inc | 47 334 | 142,39 | 1 256 | 140,88 | ||||
| 2025-08-19 | 13F | Cape Investment Advisory, Inc. | 40 | 0,00 | 1 | 0,00 | ||||
| 2025-08-14 | 13F | Royal Bank Of Canada | 228 542 | −9,16 | 6 063 | −9,67 | ||||
| 2025-05-14 | 13F | Renaissance Technologies Llc | 0 | −100,00 | 0 | |||||
| 2025-07-25 | 13F | Hobbs Group Advisors, LLC | 170 650 | 34,18 | 4 527 | 33,42 | ||||
| 2025-07-21 | 13F | Exchange Capital Management, Inc. | 0 | −100,00 | 0 | |||||
| 2025-07-25 | 13F | Richardson Financial Services Inc. | 261 | −32,38 | 7 | −40,00 | ||||
| 2025-08-13 | 13F | Guggenheim Capital Llc | 246 847 | 10,97 | 6 549 | 10,35 | ||||
| 2025-08-01 | 13F | Signature Wealth Management Group | 78 800 | 4,42 | 2 091 | 3,83 | ||||
| 2025-07-31 | 13F | Cambridge Investment Research Advisors, Inc. | 65 137 | 13,08 | 2 | 0,00 | ||||
| 2025-08-14 | 13F | Hilltop Holdings Inc. | 28 181 | 22,84 | 748 | 22,06 | ||||
| 2025-07-29 | 13F | Ballast, Inc. | 14 840 | 394 | ||||||
| 2025-05-12 | 13F | SOUTH STATE Corp | 0 | −100,00 | 0 | |||||
| 2025-08-14 | 13F | Toroso Investments, LLC | 42 818 | 1 136 | ||||||
| 2025-07-17 | 13F | Eagle Bluffs Wealth Management LLC | 44 611 | −12,06 | 1 184 | −12,56 | ||||
| 2025-05-12 | 13F | Waterloo Capital, L.P. | 0 | −100,00 | 0 | |||||
| 2025-08-05 | 13F | Sigma Planning Corp | 0 | −100,00 | 0 | |||||
| 2025-08-14 | 13F | New England Asset Management Inc | 200 | 0,00 | 5 | 0,00 | ||||
| 2025-08-06 | 13F | First Horizon Advisors, Inc. | 0 | −100,00 | 0 | |||||
| 2025-08-13 | 13F | Millington Financial Advisors, LLC | 15 413 | 17,29 | 406 | 19,47 | ||||
| 2025-08-14 | 13F | Ancora Advisors, LLC | 1 500 | 0,00 | 40 | −2,50 | ||||
| 2025-08-14 | 13F | Stifel Financial Corp | 196 609 | −2,25 | 5 216 | −2,80 | ||||
| 2025-07-22 | 13F | DAVENPORT & Co LLC | 16 485 | 437 | ||||||
| 2025-08-06 | 13F | AE Wealth Management LLC | 141 | −79,91 | 4 | −83,33 | ||||
| 2025-08-14 | 13F | Bank Of America Corp /de/ | 1 101 433 | 1,33 | 29 221 | 0,77 | ||||
| 2025-08-12 | 13F | Lionshead Wealth Management, LLC | 8 193 | −1,99 | 217 | −2,69 | ||||
| 2025-04-22 | 13F/A | NorthRock Partners, LLC | 0 | −100,00 | 0 | −100,00 | ||||
| 2025-08-13 | 13F | Northwestern Mutual Wealth Management Co | 274 268 | 3,04 | 7 276 | 2,46 | ||||
| 2025-08-05 | 13F | Bank Of Montreal /can/ | 735 554 | 4,95 | 19 514 | 4,36 | ||||
| 2025-08-05 | 13F | Strategic Financial Concepts, LLC | 0 | −100,00 | 0 | |||||
| 2025-08-04 | 13F | Joseph P. Lucia & Associates, LLC | 14 840 | −6,71 | 394 | −7,31 | ||||
| 2025-08-14 | 13F | Ameriprise Financial Inc | 1 210 388 | 3,53 | 32 114 | 2,94 | ||||
| 2025-08-08 | 13F | Creative Planning | 8 093 | 215 | ||||||
| 2025-07-11 | 13F | Grove Bank & Trust | 700 | 0,00 | 19 | 0,00 | ||||
| 2025-07-18 | 13F | Consolidated Portfolio Review Corp | 10 967 | −2,23 | 291 | −3,01 | ||||
| 2025-08-15 | 13F | Chapman Financial Group, Llc | 1 600 | −40,74 | 42 | −40,00 | ||||
| 2025-08-12 | 13F | Horizon Financial Services, Llc | 7 009 | 64,45 | 186 | 63,72 | ||||
| 2025-07-23 | 13F | Lakeshore Capital Group, Inc. | 123 505 | −0,26 | 3 277 | −0,82 | ||||
| 2025-08-13 | 13F | Summit Financial, LLC | 8 474 | 225 | ||||||
| 2025-08-14 | 13F | Mercer Global Advisors Inc /adv | 22 545 | 598 | ||||||
| 2025-07-28 | 13F | Axxcess Wealth Management, Llc | 14 679 | 0,60 | 389 | 0,00 | ||||
| 2025-08-06 | 13F | Maltin Wealth Management, Inc. | 259 337 | 10,15 | 6 880 | 9,54 | ||||
| 2025-08-15 | 13F | Tower Research Capital LLC (TRC) | 46 | 283,33 | 1 | |||||
| 2025-08-01 | 13F | Envestnet Asset Management Inc | 765 010 | −8,66 | 20 296 | −9,17 | ||||
| 2025-08-05 | 13F | Huntington National Bank | 334 | −0,30 | ||||||
| 2025-08-13 | 13F | Invesco Ltd. | 244 987 | −1,12 | 6 500 | −1,68 | ||||
| 2025-08-14 | 13F | Fmr Llc | 429 | 464,47 | 11 | 450,00 | ||||
| 2025-07-24 | 13F | Gilliland Jeter Wealth Management LLC | 9 604 | −0,60 | 255 | −1,17 | ||||
| 2025-07-11 | 13F/A | Umb Bank N A/mo | 11 574 | 0,71 | 307 | 0,33 | ||||
| 2025-07-30 | 13F | Cullen/frost Bankers, Inc. | 17 071 | 8,06 | 453 | 7,36 | ||||
| 2025-07-17 | 13F | KG&L Capital Management,LLC | 70 765 | 2,88 | 1 877 | 2,29 | ||||
| 2025-07-17 | 13F | White Pine Investment CO | 0 | −100,00 | 0 | |||||
| 2025-07-09 | 13F | Massmutual Trust Co Fsb/adv | 17 751 | −33,12 | 471 | −33,62 | ||||
| 2025-08-01 | 13F | Petra Financial Advisors Inc | 54 503 | −2,23 | 1 446 | −2,82 | ||||
| 2025-08-12 | 13F | MAI Capital Management | 1 370 | 0,00 | 36 | 0,00 | ||||
| 2025-07-29 | 13F | Progressive Investment Management Corp | 13 796 | 2,15 | 366 | 1,67 | ||||
| 2025-07-16 | 13F | FORM Wealth Advisors, LLC | 9 752 | 1,03 | 259 | 0,39 | ||||
| 2025-08-18 | 13F | Front Row Advisors LLC | 950 | 0,00 | 25 | 0,00 | ||||
| 2025-07-25 | 13F | Astoria Portfolio Advisors LLC. | 98 626 | 4,70 | 2 594 | 5,06 | ||||
| 2025-08-11 | 13F | NewEdge Wealth, LLC | 203 271 | 7,08 | 5 427 | 7,17 | ||||
| 2025-07-30 | 13F | Eqis Capital Management, Inc. | 171 698 | −6,57 | 4 555 | −7,08 | ||||
| 2025-08-08 | 13F | Kingsview Wealth Management, LLC | 340 868 | 4,06 | 9 043 | 3,48 | ||||
| 2025-08-12 | 13F | LPL Financial LLC | 388 146 | −28,28 | 10 298 | −28,68 | ||||
| 2025-07-18 | 13F | QTR Family Wealth, LLC | 14 192 | −0,58 | 377 | −1,05 |