Grundläggande statistik
| Institutionella ägare | 102 total, 102 long only, 0 short only, 0 long/short - change of 3,03% MRQ |
| Genomsnittlig portföljallokering | 0.3877 % - change of 3,00% MRQ |
| Institutionella aktier (lång) | 1 916 637 (ex 13D/G) - change of 0,10MM shares 5,50% MRQ |
| Institutionellt värde (lång) | $ 138 258 USD ($1000) |
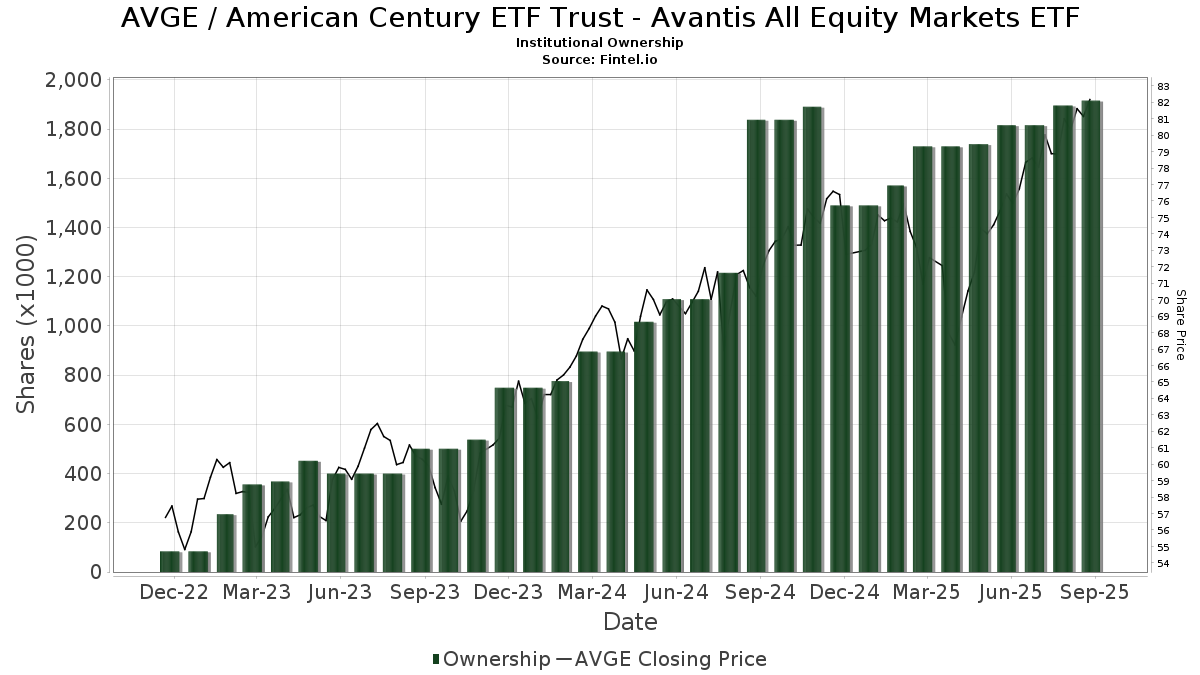
Institutionellt ägande och aktieägare
American Century ETF Trust - Avantis All Equity Markets ETF (US:AVGE) har 102 Institutionella ägare och aktieägare som har lämnat in 13D/G- eller 13F-formulär till Securities Exchange Commission (SEC). Dessa institut innehar totalt 1,916,637 aktier. Största aktieägare inkluderar Wealthstream Advisors, Inc., Meredith Wealth Planning, Nova R Wealth, Inc., Paragon Advisors, LLC, LPL Financial LLC, Compass Ion Advisors, LLC, BIP Wealth, LLC, Index Fund Advisors, Inc., Intelligent Financial Strategies, and Fmb Wealth Management .
American Century ETF Trust - Avantis All Equity Markets ETF (ARCA:AVGE) Institutionell ägarstruktur visar institutioners och fonders nuvarande positioner i företaget, samt de senaste förändringarna i positionernas storlek. Större aktieägare kan vara enskilda investerare, fonder, hedgefonder eller institutioner. Bilaga 13D visar att investeraren äger (eller ägde) mer än 5% av företaget och avser (eller avsåg) att aktivt eftersträva en förändring av affärsstrategin. Schedule 13G indikerar en passiv investering på över 5%.
The share price as of September 10, 2025 is 82,17 / share. Previously, on September 11, 2024, the share price was 70,21 / share. This represents an increase of 17,03% over that period.
Fondsentimentets poäng
Fondsentimentet poängen(fka Ägarackumulation-poäng) visar vilka aktier som är mest köpta av fonder. Det är resultatet av en sofistikerad kvantitativ flerfaktormodell som identifierar företag med de högsta nivåerna av institutionell ackumulering. Poängsättningsmodellen använder en kombination av den totala ökningen av redovisade ägare, förändringarna i portföljallokeringarna för dessa ägare och andra mått. Siffran sträcker sig från 0 till 100, där högre siffror indikerar en högre nivå av ackumulering i förhållande till sina konkurrenter, och 50 är genomsnittet.
Uppdateringsfrekvens: Dagligen
Se Ownership Explorer, som innehåller en lista över de högst rankade företagen.
Institutionell sälj/köp-kvot
Förutom att rapportera vanliga eget kapital- och skuldemissioner måste institutioner med mer än 100MM tillgångar under förvaltning också avslöja sina innehav av sälj- och köpoptioner. Eftersom säljoptioner i allmänhet indikerar ett negativt sentiment och köpoptioner indikerar ett positivt sentiment, kan vi få en uppfattning om det övergripande institutionella sentimentet genom att plotta förhållandet mellan säljoptioner och köpoptioner. Diagrammet till höger visar det historiska förhållandet mellan sälj- och köpoptioner för detta instrument.
Genom att använda sälj/köp-kvoten som en indikator på aktieägarnas sentiment undviker man en av de största bristerna med att använda det totala institutionella ägandet, nämligen att en betydande del av de förvaltade tillgångarna investeras passivt för att följa index. Passivt förvaltade fonder köper vanligtvis inte optioner, så indikatorn för sälj/köp-kvoten ger en bättre bild av stämningen i aktivt förvaltade fonder.
13F- och NPORT-arkiveringar
Detaljer om 13F-arkiveringar är gratis. Detaljer om NP-arkiveringar kräver ett premiummedlemskap. Gröna rader indikerar nya positioner. Röda rader indikerar stängda positioner. Klicka på länk symbolen för att se hela transaktionshistoriken.
Uppgradera
för att låsa upp premiumdata och exportera till Excel ![]() .
.
| Fil Datum | Källa | Investerare | Typ | Genomsnittligt pris (beräknat) |
Aktier | Δ Aktier (%) |
Rapporterat värde (1000 USD) |
Δ Värde (%) |
Portföljallokering (%) |
|
|---|---|---|---|---|---|---|---|---|---|---|
| 2025-07-23 | 13F | Sax Wealth Advisors, Llc | 5 736 | −38,46 | 444 | −33,03 | ||||
| 2025-07-08 | 13F | Holcombe Financial, Inc. | 4 973 | −11,56 | 385 | −3,75 | ||||
| 2025-07-15 | 13F | Oak Wealth Advisors LLC | 3 268 | −33,95 | 253 | −28,12 | ||||
| 2025-07-25 | 13F | BCR Wealth Strategies, LLC | 3 504 | 17,54 | 0 | |||||
| 2025-08-13 | 13F | WCG Wealth Advisors LLC | 24 003 | −5,66 | 1 860 | 2,65 | ||||
| 2025-08-06 | 13F | Valued Wealth Advisors LLC | 1 025 | 12,89 | 79 | 23,44 | ||||
| 2025-08-14 | 13F | McIlrath & Eck, LLC | 93 | 9,41 | 7 | 16,67 | ||||
| 2025-08-14 | 13F | Vista Capital Partners, Inc. | 2 644 | 205 | ||||||
| 2025-07-29 | 13F | Foster & Motley Inc | 3 645 | −20,61 | 0 | |||||
| 2025-07-30 | 13F | WESPAC Advisors SoCal, LLC | 3 009 | −23,61 | 233 | −16,79 | ||||
| 2025-08-14 | 13F | Susquehanna International Group, Llp | 0 | −100,00 | 0 | |||||
| 2025-07-15 | 13F | SJS Investment Consulting Inc. | 19 | 0,00 | 1 | 0,00 | ||||
| 2025-08-06 | 13F | Modera Wealth Management, LLC | 9 286 | −30,71 | 719 | −24,63 | ||||
| 2025-07-11 | 13F | Ridgeline Wealth, LLC | 24 659 | 4,30 | 1 911 | 13,49 | ||||
| 2025-07-29 | 13F | Wealthstream Advisors, Inc. | 163 928 | 4,80 | 12 701 | 14,06 | ||||
| 2025-08-15 | 13F | Kestra Advisory Services, LLC | 6 233 | 483 | ||||||
| 2025-07-18 | 13F | Magnolia Private Wealth, LLC | 35 693 | 59,19 | 2 765 | 73,25 | ||||
| 2025-07-22 | 13F | Yardley Wealth Management LLC | 25 483 | 10,03 | 2 | 0,00 | ||||
| 2025-08-19 | 13F | Advisory Services Network, LLC | 9 777 | −10,15 | 768 | −0,90 | ||||
| 2025-08-01 | 13F | SYM FINANCIAL Corp | 6 233 | 483 | ||||||
| 2025-05-14 | 13F | Arista Wealth Management, LLC | 0 | −100,00 | 0 | |||||
| 2025-08-14 | 13F | Modern Wealth Management, LLC | 20 133 | −2,32 | 1 560 | 6,27 | ||||
| 2025-07-15 | 13F | Evanson Asset Management, LLC | 25 722 | 7,64 | 1 993 | 17,11 | ||||
| 2025-07-16 | 13F | Plancorp, LLC | 9 192 | 14,44 | 712 | 24,69 | ||||
| 2025-07-17 | 13F | Sage Rhino Capital Llc | 4 840 | 1,87 | 375 | 10,65 | ||||
| 2025-09-04 | 13F/A | Advisor Group Holdings, Inc. | 228 | −56,24 | 18 | −54,05 | ||||
| 2025-07-17 | 13F | Global Trust Asset Management, LLC | 340 | −12,82 | 26 | −3,70 | ||||
| 2025-07-25 | 13F | Index Fund Advisors, Inc. | 68 166 | 7,03 | 5 281 | 16,50 | ||||
| 2025-07-31 | 13F | Brinker Capital Investments, LLC | 0 | −100,00 | 0 | −100,00 | ||||
| 2025-08-12 | 13F | Global Retirement Partners, LLC | 140 | 174,51 | 11 | 233,33 | ||||
| 2025-07-31 | 13F | CVA Family Office, LLC | 189 | 0,00 | 15 | 7,69 | ||||
| 2025-08-12 | 13F | Jpmorgan Chase & Co | 663 | 309,26 | 51 | 363,64 | ||||
| 2025-08-05 | 13F | Strategic Financial Concepts, LLC | 25 424 | 58,87 | 1 970 | 72,87 | ||||
| 2025-08-06 | 13F | Rialto Wealth Management, LLC | 100 | 63,93 | 8 | 75,00 | ||||
| 2025-07-08 | 13F | Apella Capital, LLC | 11 137 | −11,48 | 868 | 1,64 | ||||
| 2025-07-16 | 13F | TCI Wealth Advisors, Inc. | 5 995 | 5,62 | 464 | 14,85 | ||||
| 2025-08-14 | 13F | Navigoe, LLC | 155 | 0,00 | 0 | |||||
| 2025-07-09 | 13F | GEM Asset Management, LLC | 5 793 | 3,39 | 452 | 12,75 | ||||
| 2025-07-25 | 13F | Cwm, Llc | 59 | 0 | ||||||
| 2025-08-14 | 13F | Jane Street Group, Llc | 21 859 | 1 694 | ||||||
| 2025-07-31 | 13F | Buckingham Strategic Partners | 8 582 | 12,80 | 665 | 22,74 | ||||
| 2025-08-08 | 13F | Hartland & Co., LLC | 0 | −100,00 | 0 | |||||
| 2025-04-28 | 13F | Great Point Wealth Advisors, LLC | 3 552 | 5,24 | 253 | 3,28 | ||||
| 2025-07-30 | 13F | Canvas Wealth Advisors, LLC | 3 510 | 11,57 | 279 | 30,37 | ||||
| 2025-07-31 | 13F | Intelligent Financial Strategies | 65 321 | −5,12 | 5 061 | 3,29 | ||||
| 2025-07-21 | 13F | Creative Capital Management Investments LLC | 4 535 | 0,00 | 351 | 9,01 | ||||
| 2025-08-13 | 13F | EverSource Wealth Advisors, LLC | 2 536 | 2,96 | 197 | 12,00 | ||||
| 2025-08-07 | 13F | Fonville Wealth Management LLC | 2 723 | 211 | ||||||
| 2025-07-18 | 13F | Fmb Wealth Management | 62 581 | 2,96 | 4 849 | 12,04 | ||||
| 2025-08-07 | 13F | Prudent Man Investment Management, Inc. | 516 | 0,00 | 37 | 0,00 | ||||
| 2025-07-31 | 13F | Curio Wealth, Llc | 16 598 | 23 955,07 | 1 286 | 23,54 | ||||
| 2025-08-21 | 13F | Aveo Capital Partners, LLC | 0 | −100,00 | 0 | |||||
| 2025-08-14 | 13F | Beaird Harris Wealth Management, LLC | 723 | 0,28 | 56 | 9,80 | ||||
| 2025-07-24 | 13F | Ronald Blue Trust, Inc. | 1 | −99,64 | 0 | −100,00 | ||||
| 2025-07-28 | 13F | Arlington Financial Advisors, LLC | 3 659 | −3,23 | 284 | 5,20 | ||||
| 2025-07-10 | 13F | Pacific Asset Management, LLC | 46 083 | 27,87 | 3 571 | 39,18 | ||||
| 2025-07-31 | 13F | Cambridge Investment Research Advisors, Inc. | 10 991 | −5,33 | 1 | |||||
| 2025-07-29 | 13F | Werba Rubin Papier Wealth Management | 30 390 | 8,57 | 2 355 | 18,17 | ||||
| 2025-08-07 | 13F | Allworth Financial LP | 1 600 | 79,57 | 124 | 98,39 | ||||
| 2025-08-14 | 13F | Mercer Global Advisors Inc /adv | 16 148 | −49,74 | 1 251 | −45,30 | ||||
| 2025-07-16 | 13F | Meredith Wealth Planning | 146 880 | 45,11 | 11 380 | 57,95 | ||||
| 2025-07-10 | 13F | Waypoint Wealth Partners Inc. | 8 901 | 0,82 | 690 | 9,71 | ||||
| 2025-07-21 | 13F | Ameritas Advisory Services, LLC | 792 | −79,08 | 61 | −77,32 | ||||
| 2025-08-05 | 13F | Hutchens & Kramer Investment Management Group, LLC | 22 621 | 1 761 | ||||||
| 2025-08-13 | 13F | Annandale Capital, LLC | 2 700 | 0 | ||||||
| 2025-07-31 | 13F | BIP Wealth, LLC | 70 462 | 49,51 | 5 459 | 62,71 | ||||
| 2025-08-12 | 13F | Proequities, Inc. | 0 | 0 | ||||||
| 2025-07-03 | 13F | Lam Group, Inc. | 11 751 | 6,30 | 910 | 15,78 | ||||
| 2025-08-01 | 13F | Red Lighthouse Investment Management, Llc | 2 223 | 103,01 | 172 | 126,32 | ||||
| 2025-08-11 | 13F | Avantax Planning Partners, Inc. | 8 453 | 0,65 | 655 | 9,55 | ||||
| 2025-07-29 | 13F | Barlow Wealth Partners, Inc. | 4 472 | 0,00 | 350 | 11,82 | ||||
| 2025-07-16 | 13F | Moisand Fitzgerald Tamayo, LLC | 711 | 0,85 | 55 | 10,00 | ||||
| 2025-07-30 | 13F | Paragon Advisors, LLC | 90 854 | −36,76 | 7 039 | −31,18 | ||||
| 2025-07-11 | 13F | Compass Ion Advisors, LLC | 71 539 | 2,43 | 5 543 | 11,46 | ||||
| 2025-07-25 | 13F | LRI Investments, LLC | 1 429 | 0,00 | 111 | 8,91 | ||||
| 2025-08-12 | 13F | LPL Financial LLC | 77 634 | 7,36 | 6 015 | 16,86 | ||||
| 2025-08-13 | 13F | Cresset Asset Management, LLC | 13 153 | 31,28 | 1 019 | 42,92 | ||||
| 2025-08-06 | 13F | Entrewealth, Llc | 21 793 | 57,70 | 1 689 | 71,72 | ||||
| 2025-07-17 | 13F | Oceanside Advisors LLC | 15 919 | 3,34 | 1 233 | 12,50 | ||||
| 2025-05-14 | 13F | Northwestern Mutual Wealth Management Co | 0 | −100,00 | 0 | |||||
| 2025-08-14 | 13F | GWM Advisors LLC | 202 | 0,00 | 16 | 7,14 | ||||
| 2025-07-11 | 13F | Sprinkle Financial Consultants LLC | 55 739 | −2,36 | 4 319 | 6,28 | ||||
| 2025-08-13 | 13F | Continuum Advisory, LLC | 0 | −100,00 | 0 | |||||
| 2025-08-14 | 13F | TCG Advisory Services, LLC | 10 459 | 1,22 | 810 | 10,20 | ||||
| 2025-08-14 | 13F | Betterment LLC | 24 772 | −11,68 | 2 | 0,00 | ||||
| 2025-07-30 | 13F | Strategic Blueprint, LLC | 8 250 | 0,11 | 639 | 9,04 | ||||
| 2025-08-08 | 13F | Austin Wealth Management, LLC | 39 144 | 29,13 | 3 074 | 44,14 | ||||
| 2025-07-09 | 13F | Fermata Advisors, LLC | 35 191 | 13,49 | 2 727 | 23,52 | ||||
| 2025-08-13 | 13F | Parkworth Wealth Management, Inc. | 385 | 0,79 | 30 | 7,41 | ||||
| 2025-07-17 | 13F | Northwest Wealth Management, Llc | 2 719 | −7,04 | 211 | 0,96 | ||||
| 2025-08-14 | 13F | Wells Fargo & Company/mn | 340 | 0,00 | 26 | 8,33 | ||||
| 2025-07-14 | 13F | UMA Financial Services, Inc. | 3 599 | −4,76 | 279 | 3,35 | ||||
| 2025-07-24 | 13F | WMG Financial Advisors, LLC | 18 504 | 3,14 | 1 434 | 12,22 | ||||
| 2025-08-15 | 13F | Morgan Stanley | 2 | 100,00 | 0 | |||||
| 2025-07-17 | 13F | SC&H Financial Advisors, Inc. | 28 122 | 15,74 | 2 179 | 25,97 | ||||
| 2025-07-07 | 13F | Versant Capital Management, Inc | 6 660 | −3,98 | 516 | 4,67 | ||||
| 2025-07-23 | 13F | Elevate Wealth Advisory, Inc | 26 | −3,70 | 2 | 100,00 | ||||
| 2025-08-08 | 13F | Collaborative Wealth Managment Inc. | 33 073 | 4,99 | 2 563 | 14,27 | ||||
| 2025-08-06 | 13F | Commonwealth Equity Services, Llc | 61 069 | −2,57 | 5 | 0,00 | ||||
| 2025-08-14 | 13F | Eaton-Cambridge Inc. | 8 631 | −4,43 | 669 | 4,05 | ||||
| 2025-08-12 | 13F | Vawter Financial, Ltd. | 0 | −100,00 | 0 | |||||
| 2025-08-15 | 13F | CI Private Wealth, LLC | 34 775 | −12,87 | 2 694 | −5,17 | ||||
| 2025-08-08 | 13F | Creative Planning | 8 239 | 0,73 | 638 | 9,62 | ||||
| 2025-08-12 | 13F | Nemes Rush Group LLC | 8 193 | 20,49 | 635 | 30,99 | ||||
| 2025-08-01 | 13F | Envestnet Asset Management Inc | 5 193 | 7,69 | 402 | 17,20 | ||||
| 2025-08-15 | 13F | North Ridge Wealth Advisors, Inc. | 70 | 0,00 | 5 | 25,00 | ||||
| 2025-07-17 | 13F | Nova R Wealth, Inc. | 103 594 | −1,47 | 8 026 | 7,23 | ||||
| 2025-07-29 | 13F | Private Wealth Management Group, LLC | 718 | 50,52 | 56 | 66,67 | ||||
| 2025-08-05 | 13F | Integrity Wealth Solutions LLC | 9 591 | −1,41 | 743 | 7,37 | ||||
| 2025-07-31 | 13F | Orion Capital Management LLC | 1 149 | 2,41 | 89 | 12,66 | ||||
| 2025-08-13 | 13F | B&D White Capital Company, LLC | 22 546 | 1 747 |