Grundläggande statistik
| Institutionella ägare | 97 total, 97 long only, 0 short only, 0 long/short - change of −3,00% MRQ |
| Genomsnittlig portföljallokering | 0.3131 % - change of 28,97% MRQ |
| Institutionella aktier (lång) | 17 928 849 (ex 13D/G) - change of 2,99MM shares 20,02% MRQ |
| Institutionellt värde (lång) | $ 395 969 USD ($1000) |
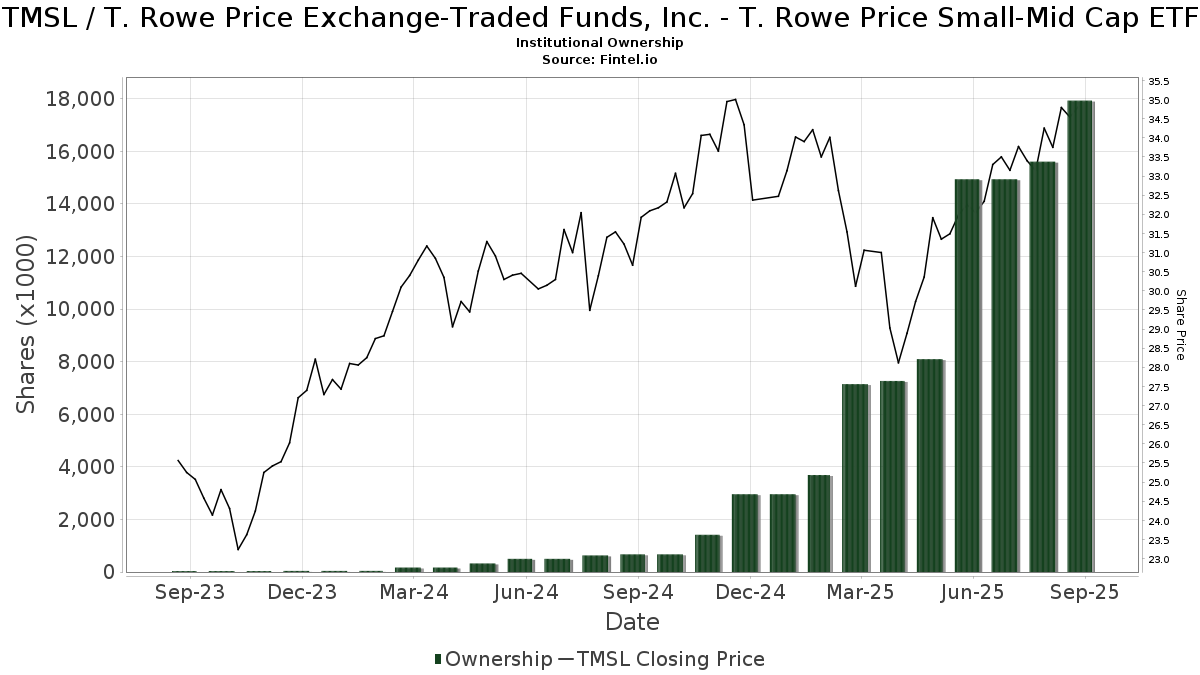
Institutionellt ägande och aktieägare
T. Rowe Price Exchange-Traded Funds, Inc. - T. Rowe Price Small-Mid Cap ETF (US:TMSL) har 97 Institutionella ägare och aktieägare som har lämnat in 13D/G- eller 13F-formulär till Securities Exchange Commission (SEC). Dessa institut innehar totalt 17,928,849 aktier. Största aktieägare inkluderar Price T Rowe Associates Inc /md/, LPL Financial LLC, Raymond James Financial Inc, Captrust Financial Advisors, Watchman Group, Inc., Wealth Enhancement Advisory Services, Llc, Souders Financial Advisors, CMH Wealth Management LLC, UBS Group AG, and Advisor Group Holdings, Inc. .
T. Rowe Price Exchange-Traded Funds, Inc. - T. Rowe Price Small-Mid Cap ETF (ARCA:TMSL) Institutionell ägarstruktur visar institutioners och fonders nuvarande positioner i företaget, samt de senaste förändringarna i positionernas storlek. Större aktieägare kan vara enskilda investerare, fonder, hedgefonder eller institutioner. Bilaga 13D visar att investeraren äger (eller ägde) mer än 5% av företaget och avser (eller avsåg) att aktivt eftersträva en förändring av affärsstrategin. Schedule 13G indikerar en passiv investering på över 5%.
The share price as of September 12, 2025 is 35,05 / share. Previously, on September 16, 2024, the share price was 31,70 / share. This represents an increase of 10,57% over that period.
Fondsentimentets poäng
Fondsentimentet poängen(fka Ägarackumulation-poäng) visar vilka aktier som är mest köpta av fonder. Det är resultatet av en sofistikerad kvantitativ flerfaktormodell som identifierar företag med de högsta nivåerna av institutionell ackumulering. Poängsättningsmodellen använder en kombination av den totala ökningen av redovisade ägare, förändringarna i portföljallokeringarna för dessa ägare och andra mått. Siffran sträcker sig från 0 till 100, där högre siffror indikerar en högre nivå av ackumulering i förhållande till sina konkurrenter, och 50 är genomsnittet.
Uppdateringsfrekvens: Dagligen
Se Ownership Explorer, som innehåller en lista över de högst rankade företagen.
Institutionell sälj/köp-kvot
Förutom att rapportera vanliga eget kapital- och skuldemissioner måste institutioner med mer än 100MM tillgångar under förvaltning också avslöja sina innehav av sälj- och köpoptioner. Eftersom säljoptioner i allmänhet indikerar ett negativt sentiment och köpoptioner indikerar ett positivt sentiment, kan vi få en uppfattning om det övergripande institutionella sentimentet genom att plotta förhållandet mellan säljoptioner och köpoptioner. Diagrammet till höger visar det historiska förhållandet mellan sälj- och köpoptioner för detta instrument.
Genom att använda sälj/köp-kvoten som en indikator på aktieägarnas sentiment undviker man en av de största bristerna med att använda det totala institutionella ägandet, nämligen att en betydande del av de förvaltade tillgångarna investeras passivt för att följa index. Passivt förvaltade fonder köper vanligtvis inte optioner, så indikatorn för sälj/köp-kvoten ger en bättre bild av stämningen i aktivt förvaltade fonder.
13F- och NPORT-arkiveringar
Detaljer om 13F-arkiveringar är gratis. Detaljer om NP-arkiveringar kräver ett premiummedlemskap. Gröna rader indikerar nya positioner. Röda rader indikerar stängda positioner. Klicka på länk symbolen för att se hela transaktionshistoriken.
Uppgradera
för att låsa upp premiumdata och exportera till Excel ![]() .
.
| Fil Datum | Källa | Investerare | Typ | Genomsnittligt pris (beräknat) |
Aktier | Δ Aktier (%) |
Rapporterat värde (1000 USD) |
Δ Värde (%) |
Portföljallokering (%) |
|
|---|---|---|---|---|---|---|---|---|---|---|
| 2025-08-08 | 13F | Cetera Investment Advisers | 336 743 | 21,90 | 11 045 | 31,19 | ||||
| 2025-08-05 | 13F | Dahring | Cusmano Llc | 41 760 | 12,16 | 1 370 | 20,72 | ||||
| 2025-08-08 | 13F | Thoroughbred Financial Services, Llc | 8 860 | −25,76 | 0 | |||||
| 2025-07-29 | 13F | Stratos Wealth Advisors, LLC | 12 419 | −35,80 | 407 | −30,90 | ||||
| 2025-08-18 | 13F | Tyler-Stone Wealth Management | 67 259 | −4,29 | 2 206 | 2,99 | ||||
| 2025-04-25 | 13F | New Wave Wealth Advisors Llc | 0 | −100,00 | 0 | |||||
| 2025-08-14 | 13F | GWM Advisors LLC | 1 004 | 0,00 | 33 | 6,67 | ||||
| 2025-08-15 | 13F | First Heartland Consultants, Inc. | 13 875 | 93,70 | 455 | 108,72 | ||||
| 2025-07-02 | 13F | HBW Advisory Services LLC | 24 090 | 4,27 | 790 | 12,22 | ||||
| 2025-08-11 | 13F | TD Waterhouse Canada Inc. | 4 799 | 0,00 | 158 | 8,28 | ||||
| 2025-08-14 | 13F | Raymond James Financial Inc | 915 343 | −7,80 | 30 023 | −0,78 | ||||
| 2025-05-01 | 13F | Quest 10 Wealth Builders, Inc. | 447 | 0,00 | 14 | −7,14 | ||||
| 2025-07-29 | 13F | Stratos Wealth Partners, LTD. | 145 415 | 1,61 | 4 770 | 9,33 | ||||
| 2025-08-14 | 13F | Mariner, LLC | 10 326 | −7,13 | 339 | 0,00 | ||||
| 2025-08-11 | 13F | Private Advisor Group, LLC | 254 548 | 12,00 | 8 349 | 20,53 | ||||
| 2025-05-15 | 13F | National Wealth Management Group, LLC | 17 465 | 532 | ||||||
| 2025-08-13 | 13F | National Bank Of Canada /fi/ | 0 | −100,00 | 0 | |||||
| 2025-08-12 | 13F | SRS Capital Advisors, Inc. | 751 | 5,33 | 25 | 14,29 | ||||
| 2025-08-14 | 13F | UBS Group AG | 473 051 | 35,28 | 15 516 | 45,58 | ||||
| 2025-07-28 | 13F | SFG Wealth Management, LLC. | 0 | −100,00 | 0 | |||||
| 2025-08-15 | 13F | CI Private Wealth, LLC | 236 612 | 3,60 | 7 761 | 11,48 | ||||
| 2025-07-17 | 13F | Raleigh Capital Management Inc. | 2 818 | −8,54 | 92 | −1,08 | ||||
| 2025-08-08 | 13F | Capital Investment Advisory Services, LLC | 11 165 | −0,79 | 366 | 6,71 | ||||
| 2025-08-12 | 13F | Global Retirement Partners, LLC | 92 806 | 133,90 | 3 044 | 138,00 | ||||
| 2025-08-13 | 13F | Per Stirling Capital Management, LLC. | 0 | −100,00 | 0 | |||||
| 2025-08-06 | 13F | Souders Financial Advisors | 495 161 | 8,75 | 16 241 | 17,04 | ||||
| 2025-07-16 | 13F | Novem Group | 0 | −100,00 | 0 | |||||
| 2025-07-24 | 13F | Financial Security Advisor, Inc. | 18 027 | 43,36 | 591 | 54,31 | ||||
| 2025-08-14 | 13F | Garden State Investment Advisory Services LLC | 65 470 | 11,10 | 2 147 | 19,54 | ||||
| 2025-08-14 | 13F | Jane Street Group, Llc | 0 | −100,00 | 0 | |||||
| 2025-08-14 | 13F | IHT Wealth Management, LLC | 10 192 | 334 | ||||||
| 2025-08-13 | 13F | Brown Advisory Inc | 32 816 | 0,00 | 1 076 | 7,60 | ||||
| 2025-08-14 | 13F | Bank Of America Corp /de/ | 400 | 13 | ||||||
| 2025-08-14 | 13F | Stifel Financial Corp | 6 587 | −94,92 | 216 | −94,53 | ||||
| 2025-07-14 | 13F | Legacy Capital Group California, Inc. | 36 774 | 2,03 | 1 206 | 9,84 | ||||
| 2025-08-04 | 13F | Flagship Harbor Advisors, Llc | 215 069 | 39,34 | 7 054 | 49,96 | ||||
| 2025-07-10 | 13F | Wealth Enhancement Advisory Services, Llc | 781 458 | 7,87 | 26 179 | 18,56 | ||||
| 2025-08-05 | 13F | Atlas Wealth LLC | 50 574 | 1 672 | ||||||
| 2025-08-14 | 13F | Advisor OS, LLC | 27 002 | 7,23 | 886 | 15,38 | ||||
| 2025-07-24 | 13F | Jfs Wealth Advisors, Llc | 1 665 | 0,00 | 55 | 8,00 | ||||
| 2025-07-11 | 13F | Farther Finance Advisors, LLC | 115 978 | −33,81 | 3 804 | −28,97 | ||||
| 2025-08-15 | 13F | Captrust Financial Advisors | 848 317 | 54,99 | 27 825 | 66,78 | ||||
| 2025-08-12 | 13F | LPL Financial LLC | 1 590 566 | 35,46 | 52 171 | 45,77 | ||||
| 2025-07-28 | 13F | Harbour Investments, Inc. | 291 | 0,00 | 10 | 12,50 | ||||
| 2025-08-05 | 13F | Westside Investment Management, Inc. | 1 965 | 33,22 | 64 | 45,45 | ||||
| 2025-08-12 | 13F | Steward Partners Investment Advisory, Llc | 55 456 | 2,95 | 1 819 | 10,79 | ||||
| 2025-08-12 | 13F | Founders Financial Alliance, LLC | 350 | 0,00 | 11 | 10,00 | ||||
| 2025-07-24 | 13F | MSH Capital Advisors LLC | 6 765 | −34,51 | 222 | −29,62 | ||||
| 2025-08-13 | 13F | Capital Analysts, Inc. | 1 085 | −34,99 | 0 | |||||
| 2025-08-15 | 13F | Morgan Stanley | 541 | 18 | ||||||
| 2025-06-30 | NP | ASTIX - Astor Dynamic Allocation Fund Class I shares | 62 528 | 0,00 | 1 858 | −12,56 | ||||
| 2025-08-13 | 13F | Cary Street Partners Financial Llc | 0 | −100,00 | 0 | |||||
| 2025-08-14 | 13F | Wells Fargo & Company/mn | 309 023 | −0,46 | 10 136 | 7,11 | ||||
| 2025-08-05 | 13F | GPS Wealth Strategies Group, LLC | 550 | 0,00 | 18 | 12,50 | ||||
| 2025-08-14 | 13F | Heritage Wealth Management, Inc. | 23 945 | 61,02 | 785 | 73,29 | ||||
| 2025-08-14 | 13F | Citadel Advisors Llc | 0 | −100,00 | 0 | |||||
| 2025-08-06 | 13F | OneAscent Family Office, LLC | 27 783 | 0,00 | 1 | |||||
| 2025-08-14 | 13F | Price T Rowe Associates Inc /md/ | 5 288 937 | 26,86 | 173 | 36,22 | ||||
| 2025-08-14 | 13F | Comerica Bank | 3 060 | 100 | ||||||
| 2025-07-30 | 13F | Blume Capital Management, Inc. | 5 000 | 11,11 | 164 | 19,71 | ||||
| 2025-08-06 | 13F | AE Wealth Management LLC | 15 227 | 3,97 | 499 | 11,88 | ||||
| 2025-08-14 | 13F | Royal Bank Of Canada | 0 | −100,00 | 0 | |||||
| 2025-08-14 | 13F | Goldman Sachs Group Inc | 0 | −100,00 | 0 | |||||
| 2025-07-24 | 13F | Eastern Bank | 0 | −100,00 | 0 | |||||
| 2025-08-12 | 13F | Watchman Group, Inc. | 805 178 | 4,90 | 26 410 | 12,89 | ||||
| 2025-07-23 | 13F | Seamount Financial Group Inc | 14 939 | 1,61 | 490 | 9,15 | ||||
| 2025-08-06 | 13F | Walkner Condon Financial Advisors LLC | 0 | −100,00 | 0 | |||||
| 2025-08-08 | 13F | Sittner & Nelson, Llc | 62 689 | 12,89 | 2 056 | 21,51 | ||||
| 2025-07-25 | 13F | Stephens Consulting, LLC | 109 837 | −4,19 | 3 603 | 3,09 | ||||
| 2025-07-29 | 13F | Private Trust Co Na | 0 | −100,00 | 0 | |||||
| 2025-07-14 | 13F | AdvisorNet Financial, Inc | 17 772 | 17,52 | 583 | 26,52 | ||||
| 2025-08-29 | 13F | Centaurus Financial, Inc. | 128 798 | 162,67 | 4 | 300,00 | ||||
| 2025-04-30 | 13F | Axxcess Wealth Management, Llc | 0 | −100,00 | 0 | |||||
| 2025-08-06 | 13F | Commonwealth Equity Services, Llc | 106 496 | 42,91 | 3 | 50,00 | ||||
| 2025-07-22 | 13F | DAVENPORT & Co LLC | 130 500 | 0,95 | 4 280 | 8,63 | ||||
| 2025-08-13 | 13F | Northwestern Mutual Wealth Management Co | 404 723 | 32,13 | 13 275 | 42,18 | ||||
| 2025-07-01 | 13F | Burkett Financial Services, Llc | 0 | −100,00 | 0 | |||||
| 2025-07-18 | 13F | Astor Investment Management LLC | 141 254 | −3,48 | 4 633 | 3,88 | ||||
| 2025-07-24 | 13F | Robertson Stephens Wealth Management, LLC | 33 517 | −15,90 | 1 099 | −9,47 | ||||
| 2025-07-30 | 13F | Retirement Planning Group | 17 003 | 558 | ||||||
| 2025-07-25 | 13F | Atria Wealth Solutions, Inc. | 142 613 | −13,07 | 4 777 | −4,46 | ||||
| 2025-08-14 | 13F | Mml Investors Services, Llc | 44 506 | −85,82 | 1 | −88,89 | ||||
| 2025-08-01 | 13F | Envestnet Asset Management Inc | 161 336 | 2,03 | 5 292 | 9,79 | ||||
| 2025-07-24 | 13F | IFP Advisors, Inc | 4 228 | 0,00 | 139 | 7,81 | ||||
| 2025-08-04 | 13F | Atria Investments Llc | 48 334 | −4,05 | 1 585 | 3,26 | ||||
| 2025-08-14 | 13F | Susquehanna International Group, Llp | 10 811 | −51,89 | 355 | −48,25 | ||||
| 2025-07-16 | 13F | Essex Financial Services, Inc. | 79 283 | 56,10 | 2 600 | 67,96 | ||||
| 2025-08-13 | 13F | GeoWealth Management, LLC | 10 400 | 0,15 | 341 | 7,91 | ||||
| 2025-05-16 | 13F/A | Kestra Investment Management, LLC | 0 | −100,00 | 0 | |||||
| 2025-08-14 | 13F | Wiley Bros.-aintree Capital, Llc | 12 098 | 397 | ||||||
| 2025-08-12 | 13F | Change Path, LLC | 8 607 | 1,98 | 282 | 9,73 | ||||
| 2025-07-11 | 13F | CMH Wealth Management LLC | 489 121 | 16 043 | ||||||
| 2025-08-12 | 13F | Proequities, Inc. | 0 | 0 | ||||||
| 2025-08-15 | 13F | Equitable Holdings, Inc. | 32 676 | −29,84 | 1 072 | −24,52 | ||||
| 2025-08-08 | 13F | Good Life Advisors, LLC | 61 281 | 506,50 | 2 010 | 554,72 | ||||
| 2025-07-15 | 13F | DKM Wealth Management, Inc. | 22 511 | 738 | ||||||
| 2025-09-04 | 13F/A | Advisor Group Holdings, Inc. | 431 459 | 85,17 | 14 156 | 99,23 | ||||
| 2025-08-14 | 13F | Benjamin Edwards Inc | 32 311 | −11,24 | 1 060 | −4,51 | ||||
| 2025-05-02 | 13F | Sigma Planning Corp | 0 | −100,00 | 0 | |||||
| 2025-08-04 | 13F | IFG Advisory, LLC | 20 228 | 28,73 | 663 | 38,70 | ||||
| 2025-08-11 | 13F | HighTower Advisors, LLC | 46 974 | −5,11 | 1 541 | 2,12 | ||||
| 2025-07-30 | 13F | D.a. Davidson & Co. | 276 949 | 3 742,78 | 9 084 | 4 047,49 | ||||
| 2025-07-17 | 13F | Asio Capital, LLC | 377 121 | 67,69 | 12 370 | 80,46 | ||||
| 2025-08-04 | 13F | Pensionmark Financial Group, Llc | 18 310 | −12,02 | 601 | −5,36 | ||||
| 2025-08-13 | 13F | Legacy Capital Wealth Partners, LLC | 0 | −100,00 | 0 | |||||
| 2025-04-22 | 13F | World Equity Group, Inc. | 0 | −100,00 | 0 | |||||
| 2025-08-05 | 13F | Plante Moran Financial Advisors, LLC | 0 | −100,00 | 0 | |||||
| 2025-08-13 | 13F | Jones Financial Companies Lllp | 238 936 | 206,58 | 7 830 | 229,36 | ||||
| 2025-08-07 | 13F | PFG Advisors | 48 632 | −2,94 | 1 595 | 4,45 | ||||
| 2025-08-18 | 13F | Geneos Wealth Management Inc. | 530 | 0,00 | 17 | 6,25 | ||||
| 2025-05-02 | 13F | Transcendent Capital Group LLC | 0 | −100,00 | 0 | |||||
| 2025-08-06 | 13F | Vantage Financial Partners, LLC | 91 540 | 3 003 | ||||||
| 2025-07-22 | 13F | Miracle Mile Advisors, LLC | 12 836 | 0,00 | 421 | 7,67 | ||||
| 2025-05-12 | 13F | Fmr Llc | 0 | −100,00 | 0 | |||||
| 2025-08-14 | 13F | Qube Research & Technologies Ltd | 83 | 3 | ||||||
| 2025-07-25 | 13F | Cwm, Llc | 8 314 | 4,42 | 0 | |||||
| 2025-07-31 | 13F | Cambridge Investment Research Advisors, Inc. | 259 156 | 9,48 | 8 | 14,29 | ||||
| 2025-08-07 | 13F | Resources Investment Advisors, LLC. | 161 806 | 1,49 | 5 307 | 9,22 | ||||
| 2025-08-08 | 13F | Kingsview Wealth Management, LLC | 24 695 | 22,40 | 810 | 31,76 | ||||
| 2025-08-26 | 13F | Nautilus Advisors LLC | 8 340 | 21,49 | 274 | 30,62 |