Grundläggande statistik
| Institutionella ägare | 127 total, 127 long only, 0 short only, 0 long/short - change of −3,76% MRQ |
| Genomsnittlig portföljallokering | 0.1079 % - change of 0,12% MRQ |
| Institutionella aktier (lång) | 5 343 977 (ex 13D/G) - change of −0,18MM shares −3,26% MRQ |
| Institutionellt värde (lång) | $ 332 819 USD ($1000) |
Institutionellt ägande och aktieägare
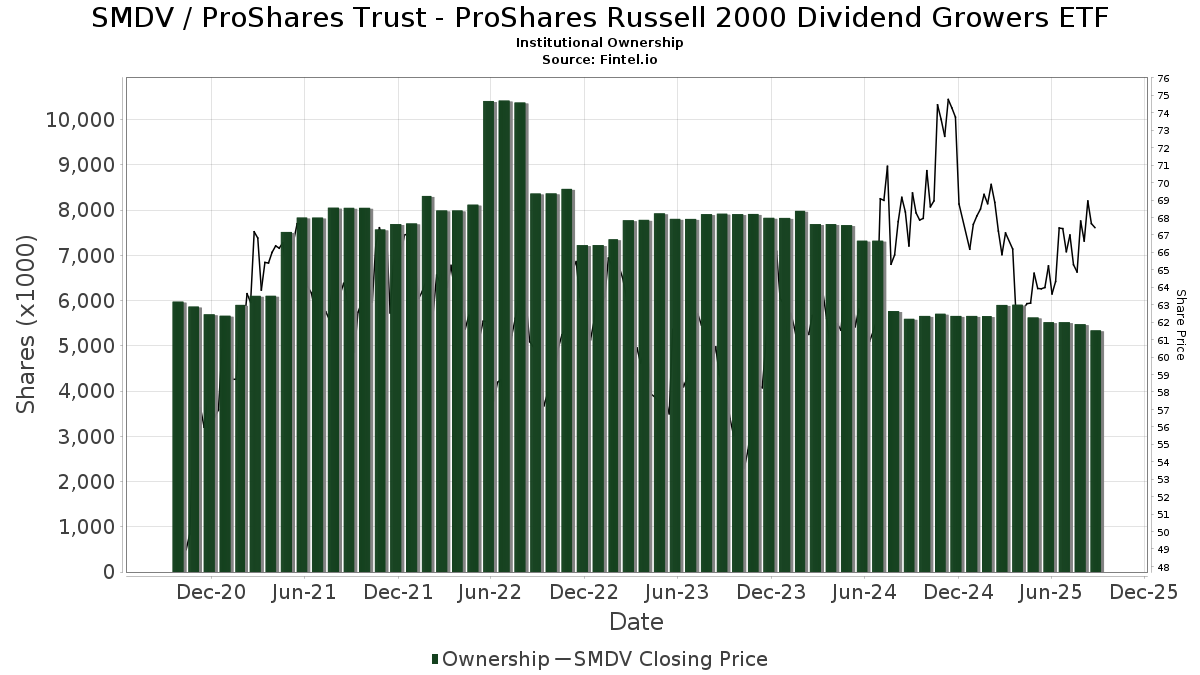
ProShares Trust - ProShares Russell 2000 Dividend Growers ETF (US:SMDV) har 127 Institutionella ägare och aktieägare som har lämnat in 13D/G- eller 13F-formulär till Securities Exchange Commission (SEC). Dessa institut innehar totalt 5,343,977 aktier. Största aktieägare inkluderar Morgan Stanley, Capital Investment Advisors, LLC, UBS Group AG, Wells Fargo & Company/mn, Raymond James Financial Inc, Bank Of America Corp /de/, LPL Financial LLC, Royal Bank Of Canada, Toth Financial Advisory Corp, and Wiley Bros.-aintree Capital, Llc .
ProShares Trust - ProShares Russell 2000 Dividend Growers ETF (BATS:SMDV) Institutionell ägarstruktur visar institutioners och fonders nuvarande positioner i företaget, samt de senaste förändringarna i positionernas storlek. Större aktieägare kan vara enskilda investerare, fonder, hedgefonder eller institutioner. Bilaga 13D visar att investeraren äger (eller ägde) mer än 5% av företaget och avser (eller avsåg) att aktivt eftersträva en förändring av affärsstrategin. Schedule 13G indikerar en passiv investering på över 5%.
The share price as of September 11, 2025 is 68,46 / share. Previously, on September 12, 2024, the share price was 67,04 / share. This represents an increase of 2,11% over that period.
Fondsentimentets poäng
Fondsentimentet poängen(fka Ägarackumulation-poäng) visar vilka aktier som är mest köpta av fonder. Det är resultatet av en sofistikerad kvantitativ flerfaktormodell som identifierar företag med de högsta nivåerna av institutionell ackumulering. Poängsättningsmodellen använder en kombination av den totala ökningen av redovisade ägare, förändringarna i portföljallokeringarna för dessa ägare och andra mått. Siffran sträcker sig från 0 till 100, där högre siffror indikerar en högre nivå av ackumulering i förhållande till sina konkurrenter, och 50 är genomsnittet.
Uppdateringsfrekvens: Dagligen
Se Ownership Explorer, som innehåller en lista över de högst rankade företagen.
Institutionell sälj/köp-kvot
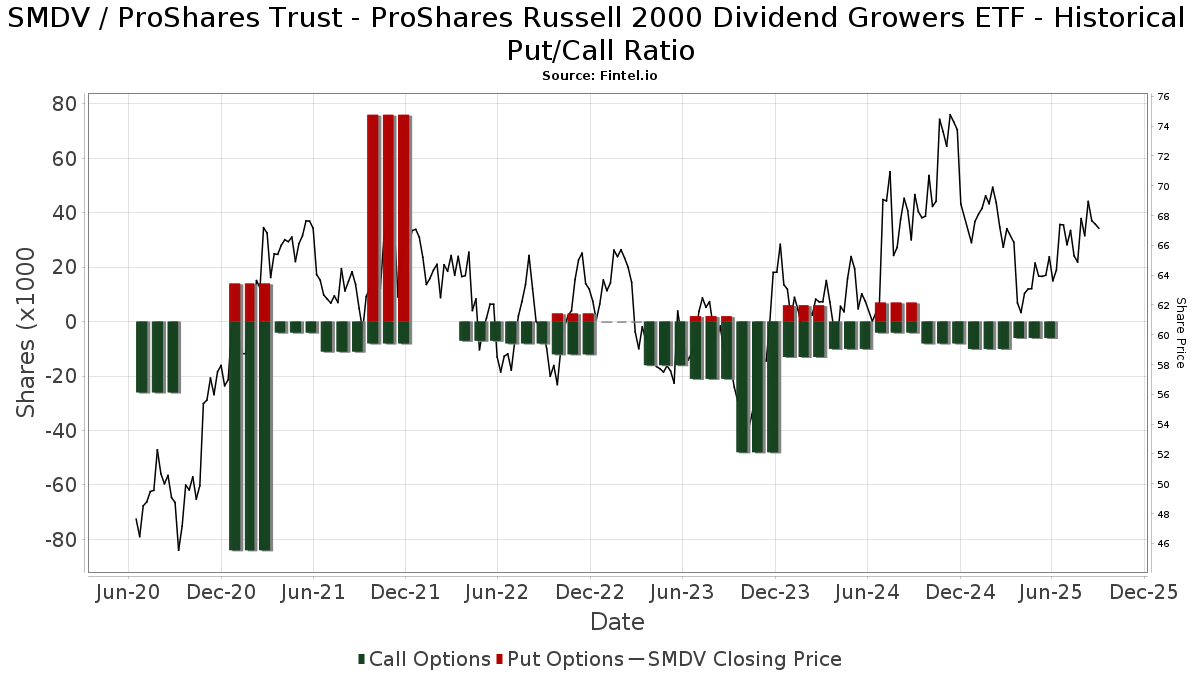
Förutom att rapportera vanliga eget kapital- och skuldemissioner måste institutioner med mer än 100MM tillgångar under förvaltning också avslöja sina innehav av sälj- och köpoptioner. Eftersom säljoptioner i allmänhet indikerar ett negativt sentiment och köpoptioner indikerar ett positivt sentiment, kan vi få en uppfattning om det övergripande institutionella sentimentet genom att plotta förhållandet mellan säljoptioner och köpoptioner. Diagrammet till höger visar det historiska förhållandet mellan sälj- och köpoptioner för detta instrument.
Genom att använda sälj/köp-kvoten som en indikator på aktieägarnas sentiment undviker man en av de största bristerna med att använda det totala institutionella ägandet, nämligen att en betydande del av de förvaltade tillgångarna investeras passivt för att följa index. Passivt förvaltade fonder köper vanligtvis inte optioner, så indikatorn för sälj/köp-kvoten ger en bättre bild av stämningen i aktivt förvaltade fonder.
13F- och NPORT-arkiveringar
Detaljer om 13F-arkiveringar är gratis. Detaljer om NP-arkiveringar kräver ett premiummedlemskap. Gröna rader indikerar nya positioner. Röda rader indikerar stängda positioner. Klicka på länk symbolen för att se hela transaktionshistoriken.
Uppgradera
för att låsa upp premiumdata och exportera till Excel ![]() .
.
| Fil Datum | Källa | Investerare | Typ | Genomsnittligt pris (beräknat) |
Aktier | Δ Aktier (%) |
Rapporterat värde (1000 USD) |
Δ Värde (%) |
Portföljallokering (%) |
|
|---|---|---|---|---|---|---|---|---|---|---|
| 2025-08-12 | 13F | Howe & Rusling Inc | 2 721 | 7,72 | 177 | 7,27 | ||||
| 2025-08-13 | 13F | Baird Financial Group, Inc. | 125 218 | 0,34 | 8 147 | −0,48 | ||||
| 2025-08-14 | 13F | Susquehanna International Group, Llp | 9 206 | 122,80 | 599 | 120,66 | ||||
| 2025-08-14 | 13F | Susquehanna International Group, Llp | Call | 6 700 | 8,06 | 436 | 7,14 | |||
| 2025-08-14 | 13F | Lazard Asset Management Llc | 1 250 | 0,00 | 0 | |||||
| 2025-05-06 | 13F | WT Wealth Management | 0 | −100,00 | 0 | |||||
| 2025-08-14 | 13F | Moneta Group Investment Advisors Llc | 3 227 | 0,00 | 210 | −0,95 | ||||
| 2025-07-22 | 13F | DAVENPORT & Co LLC | 3 826 | 0,00 | 249 | −0,80 | ||||
| 2025-08-14 | 13F | Harvest Investment Services, LLC | 14 383 | 2,51 | 936 | 1,63 | ||||
| 2025-08-12 | 13F | Jacobi Capital Management LLC | 28 411 | −0,78 | 1 848 | −1,60 | ||||
| 2025-08-18 | 13F | Geneos Wealth Management Inc. | 7 955 | 11,52 | 518 | 10,71 | ||||
| 2025-07-31 | 13F | Cambridge Investment Research Advisors, Inc. | 54 029 | −3,54 | 4 | 0,00 | ||||
| 2025-08-14 | 13F | GWM Advisors LLC | 5 415 | 8,02 | 352 | 7,32 | ||||
| 2025-05-12 | 13F | Benjamin Edwards Inc | 0 | −100,00 | 0 | |||||
| 2025-07-25 | 13F | Cwm, Llc | 154 | 0,00 | 0 | |||||
| 2025-08-12 | 13F | J.w. Cole Advisors, Inc. | 6 843 | 6,79 | 445 | 5,95 | ||||
| 2025-08-11 | 13F | HighTower Advisors, LLC | 5 121 | 3,41 | 333 | 2,78 | ||||
| 2025-08-12 | 13F | MAI Capital Management | 2 297 | −2,38 | 149 | −3,25 | ||||
| 2025-08-13 | 13F | Beacon Pointe Advisors, LLC | 10 011 | 0,00 | 651 | −0,76 | ||||
| 2025-07-10 | 13F | Wealth Enhancement Advisory Services, Llc | 5 786 | −2,84 | 392 | 0,51 | ||||
| 2025-08-14 | 13F | Citadel Advisors Llc | 9 850 | −35,24 | 641 | −35,81 | ||||
| 2025-05-06 | 13F | Pinnacle Associates Ltd | 0 | −100,00 | 0 | |||||
| 2025-08-11 | 13F | Citigroup Inc | 3 266 | −8,72 | 212 | −9,40 | ||||
| 2025-07-22 | 13F | Legacy Trust | 0 | −100,00 | 0 | |||||
| 2025-07-25 | 13F | Lion Street Advisors, LLC | 3 132 | 0,10 | 204 | −0,98 | ||||
| 2025-08-12 | 13F | Park Square Financial Group, LLC | 44 | 0,00 | 3 | 0,00 | ||||
| 2025-08-11 | 13F | Aptus Capital Advisors, LLC | 218 | 0,46 | 14 | 0,00 | ||||
| 2025-08-11 | 13F | Western Wealth Management, LLC | 4 185 | 0,29 | 272 | −0,37 | ||||
| 2025-07-10 | 13F | CWC Advisors, LLC. | 3 250 | 0,00 | 211 | −0,94 | ||||
| 2025-04-10 | 13F | Hennion & Walsh Asset Management, Inc. | 0 | −100,00 | 0 | −100,00 | ||||
| 2025-08-14 | 13F | Acorn Wealth Advisors, LLC | 5 099 | 1,39 | 332 | 0,61 | ||||
| 2025-08-06 | 13F | Round Rock Advisors, LLC | 4 275 | −0,02 | 278 | −0,71 | ||||
| 2025-08-06 | 13F | Wedbush Securities Inc | 14 370 | −3,34 | 1 | |||||
| 2025-08-11 | 13F | CFS Investment Advisory Services, LLC | 7 529 | 26,86 | 0 | |||||
| 2025-07-25 | 13F | Landmark Wealth Management, LLC | 47 835 | −0,12 | 3 | 0,00 | ||||
| 2025-07-09 | 13F | Dynamic Advisor Solutions LLC | 7 840 | 1,62 | 510 | 0,79 | ||||
| 2025-08-04 | 13F | Assetmark, Inc | 33 | 17,86 | 2 | 100,00 | ||||
| 2025-08-04 | 13F | Arkadios Wealth Advisors | 3 976 | −2,38 | 259 | −3,37 | ||||
| 2025-08-07 | 13F | Palisade Asset Management, LLC | 0 | −100,00 | 0 | |||||
| 2025-07-01 | 13F | Harbor Investment Advisory, Llc | 2 780 | 0,00 | 181 | −1,10 | ||||
| 2025-07-29 | 13F | Private Trust Co Na | 89 | 0,00 | 6 | 0,00 | ||||
| 2025-07-16 | 13F | Essex Financial Services, Inc. | 23 562 | −6,58 | 1 533 | −7,38 | ||||
| 2025-07-14 | 13F | Toth Financial Advisory Corp | 191 474 | −1,42 | 12 457 | −2,22 | ||||
| 2025-08-12 | 13F | Steward Partners Investment Advisory, Llc | 790 | 0,00 | 51 | 0,00 | ||||
| 2025-07-21 | 13F | Empirical Financial Services, LLC d.b.a. Empirical Wealth Management | 0 | −100,00 | 0 | |||||
| 2025-08-14 | 13F | Mercer Global Advisors Inc /adv | 13 807 | −3,07 | 898 | −3,85 | ||||
| 2025-08-14 | 13F | Raymond James Financial Inc | 293 006 | −3,04 | 19 063 | −3,82 | ||||
| 2025-08-08 | 13F | United Asset Strategies, Inc. | 16 220 | −6,63 | 1 055 | −7,37 | ||||
| 2025-07-25 | 13F | Total Clarity Wealth Management, Inc. | 6 640 | −1,98 | 432 | −5,90 | ||||
| 2025-05-15 | 13F | Citadel Advisors Llc | Put | 0 | −100,00 | 0 | −100,00 | |||
| 2025-07-10 | 13F | Oliver Lagore Vanvalin Investment Group | 0 | −100,00 | 0 | |||||
| 2025-07-11 | 13F | Caldwell Securities, Inc | 2 646 | 30,22 | 172 | 29,32 | ||||
| 2025-08-14 | 13F | Stifel Financial Corp | 47 410 | 1,07 | 3 085 | 0,26 | ||||
| 2025-07-24 | 13F | Blair William & Co/il | 5 946 | 0,00 | 387 | −0,77 | ||||
| 2025-08-08 | 13F | Cetera Investment Advisers | 87 490 | −2,03 | 5 692 | −2,82 | ||||
| 2025-07-07 | 13F | Wesbanco Bank Inc | 3 833 | −29,45 | 249 | −30,06 | ||||
| 2025-07-21 | 13F | Ameritas Advisory Services, LLC | 444 | 29 | ||||||
| 2025-08-14 | 13F | Warren Averett Asset Management, LLC | 3 662 | 0,00 | 238 | −0,83 | ||||
| 2025-08-13 | 13F | Northwestern Mutual Wealth Management Co | 15 449 | −33,06 | 1 005 | −33,58 | ||||
| 2025-05-09 | 13F | Pathway Financial Advisers, LLC | 0 | −100,00 | 0 | |||||
| 2025-07-24 | 13F | Us Bancorp \de\ | 1 000 | 150,00 | 65 | 150,00 | ||||
| 2025-07-22 | 13F | Kraematon Investment Advisors, Inc | 5 222 | −2,72 | 340 | −3,69 | ||||
| 2025-08-04 | 13F | Northwest Financial Advisors | 10 695 | −11,10 | 696 | −11,91 | ||||
| 2025-08-19 | 13F | National Asset Management, Inc. | 4 819 | −8,00 | 314 | −11,58 | ||||
| 2025-08-04 | 13F | L.m. Kohn & Company | 9 789 | 13,63 | 637 | 12,57 | ||||
| 2025-08-13 | 13F | Jones Financial Companies Lllp | 11 760 | 34,72 | 768 | 34,27 | ||||
| 2025-05-08 | 13F | Endeavor Private Wealth, Inc. | 0 | −100,00 | 0 | |||||
| 2025-08-14 | 13F | Ameriprise Financial Inc | 44 356 | 72,82 | 2 886 | 71,42 | ||||
| 2025-07-15 | 13F | Bay Capital Advisors, LLC | 4 400 | 0,00 | 286 | −0,69 | ||||
| 2025-08-14 | 13F | Two Sigma Investments, Lp | 29 900 | −5,97 | 1 945 | −6,71 | ||||
| 2025-08-12 | 13F | MWA Asset Management | 4 081 | −26,88 | 265 | −27,60 | ||||
| 2025-08-04 | 13F | Pensionmark Financial Group, Llc | 7 952 | 0,00 | 517 | −0,77 | ||||
| 2025-07-28 | 13F | BRYN MAWR TRUST Co | 368 | −33,57 | 24 | −36,11 | ||||
| 2025-08-12 | 13F | Franklin Resources Inc | 735 | 48 | ||||||
| 2025-07-30 | 13F | Parcion Private Wealth LLC | 24 893 | 0,00 | 1 620 | −0,80 | ||||
| 2025-07-18 | 13F | Trilogy Capital Inc. | 0 | −100,00 | 0 | |||||
| 2025-08-14 | 13F | UBS Group AG | 377 984 | −15,42 | 24 592 | −16,10 | ||||
| 2025-07-23 | 13F | Trueblood Wealth Management, LLC | 15 481 | 0,00 | 1 007 | −0,79 | ||||
| 2025-08-12 | 13F | Proequities, Inc. | 0 | 0 | ||||||
| 2025-08-14 | 13F | CoreCap Advisors, LLC | 75 | −10,71 | 5 | −20,00 | ||||
| 2025-08-07 | 13F | Addison Advisors LLC | 50 | 0,00 | 3 | 0,00 | ||||
| 2025-08-14 | 13F | Royal Capital Wealth Management, LLC | 12 423 | 0,11 | 808 | −0,62 | ||||
| 2025-08-14 | 13F | Comerica Bank | 9 671 | −0,51 | 629 | −1,26 | ||||
| 2025-08-05 | 13F | Key FInancial Inc | 549 | 0,00 | 36 | −2,78 | ||||
| 2025-08-11 | 13F | Nations Financial Group Inc, /ia/ /adv | 15 189 | −1,43 | 988 | −2,18 | ||||
| 2025-07-30 | 13F | FNY Investment Advisers, LLC | 200 | 0 | ||||||
| 2025-08-13 | 13F | Smith, Moore & Co. | 55 164 | 3,31 | 3 589 | 2,46 | ||||
| 2025-08-12 | 13F | Nemes Rush Group LLC | 0 | −100,00 | 0 | |||||
| 2025-08-07 | 13F | Cascade Financial Partners, LLC | 11 693 | 0,00 | 761 | −0,78 | ||||
| 2025-07-18 | 13F | PFG Investments, LLC | 17 259 | −26,11 | 1 123 | −26,76 | ||||
| 2025-08-11 | 13F | Principal Securities, Inc. | 481 | 54,17 | 31 | 47,62 | ||||
| 2025-08-14 | 13F | Jane Street Group, Llc | 4 196 | 273 | ||||||
| 2025-07-08 | 13F | Arlington Trust Co LLC | 140 033 | −3,24 | 9 111 | −4,02 | ||||
| 2025-08-13 | 13F | Colonial Trust Co / SC | 43 | 0,00 | 3 | 0,00 | ||||
| 2025-07-28 | 13F | Harbour Investments, Inc. | 2 243 | 2 143,00 | 146 | 2 316,67 | ||||
| 2025-08-14 | 13F | Citadel Advisors Llc | Call | 0 | −100,00 | 0 | ||||
| 2025-07-14 | 13F | Lewis Asset Management, LLC | 6 835 | −15,01 | 445 | −15,75 | ||||
| 2025-07-24 | 13F | Capital Advisors, Ltd. LLC | 4 943 | 8,26 | 0 | |||||
| 2025-05-05 | 13F | IFP Advisors, Inc | 0 | −100,00 | 0 | |||||
| 2025-08-14 | 13F | Royal Bank Of Canada | 198 490 | −10,73 | 12 914 | −11,44 | ||||
| 2025-08-14 | 13F | Qube Research & Technologies Ltd | 257 | −55,84 | 17 | −57,89 | ||||
| 2025-08-14 | 13F | Wells Fargo & Company/mn | 348 652 | −17,15 | 22 683 | −17,82 | ||||
| 2025-08-15 | 13F | Tower Research Capital LLC (TRC) | 1 319 | −85,17 | 86 | −85,42 | ||||
| 2025-08-14 | 13F | Financial Advisory Service, Inc. | 712 | −54,24 | 46 | −54,90 | ||||
| 2025-08-06 | 13F | Paladin Advisory Group, LLC | 101 | 0,00 | 7 | 0,00 | ||||
| 2025-08-11 | 13F | United Advisor Group, LLC | 48 451 | −0,18 | 3 152 | −0,97 | ||||
| 2025-05-13 | 13F | Bank Of Montreal /can/ | 0 | −100,00 | 0 | |||||
| 2025-07-30 | 13F/A | KPP Advisory Services LLC | 3 682 | −0,46 | 240 | −1,24 | ||||
| 2025-08-05 | 13F | GPS Wealth Strategies Group, LLC | 2 201 | 0,05 | 143 | −0,69 | ||||
| 2025-08-11 | 13F | Synergy Investment Management, LLC | 0 | −100,00 | 0 | |||||
| 2025-08-11 | 13F | Annis Gardner Whiting Capital Advisors, LLC | 344 | 23 | ||||||
| 2025-08-08 | 13F | Avantax Advisory Services, Inc. | 4 402 | 3,58 | 286 | 2,88 | ||||
| 2025-08-15 | 13F | Morgan Stanley | 1 090 179 | −3,83 | 70 927 | −4,61 | ||||
| 2025-05-14 | 13F | Huntington National Bank | 12 | |||||||
| 2025-08-01 | 13F | Envestnet Asset Management Inc | 72 998 | 33,06 | 4 749 | 31,99 | ||||
| 2025-07-09 | 13F | Key Client Fiduciary Advisors, LLC | 5 917 | 0,00 | 385 | −1,03 | ||||
| 2025-09-04 | 13F/A | Advisor Group Holdings, Inc. | 33 543 | −4,15 | 2 185 | −4,92 | ||||
| 2025-07-08 | 13F | Atlas Brown,Inc. | 5 817 | −0,70 | 378 | −1,56 | ||||
| 2025-08-04 | 13F | Spire Wealth Management | 107 | 0,94 | 7 | 0,00 | ||||
| 2025-05-13 | 13F | Capstone Wealth Management Group LLC | 0 | −100,00 | 0 | |||||
| 2025-07-17 | 13F/A | Capital Investment Advisors, LLC | 419 959 | 0,41 | 27 323 | −0,40 | ||||
| 2025-07-17 | 13F | Janney Montgomery Scott LLC | 3 592 | 1,41 | 0 | |||||
| 2025-08-12 | 13F | CIBC Private Wealth Group, LLC | 272 | 0,00 | 18 | 6,25 | ||||
| 2025-08-07 | 13F | New England Private Wealth Advisors LLC | 30 078 | 1 964 | ||||||
| 2025-07-08 | 13F | Nbc Securities, Inc. | 100 | 0,00 | 0 | |||||
| 2025-08-19 | 13F | Anchor Investment Management, LLC | 1 520 | −8,82 | 99 | −10,09 | ||||
| 2025-07-18 | 13F | Truist Financial Corp | 116 781 | 1,65 | 7 598 | 0,82 | ||||
| 2025-08-14 | 13F | Wiley Bros.-aintree Capital, Llc | 156 160 | 28,41 | 10 161 | 27,51 | ||||
| 2025-08-14 | 13F | IHT Wealth Management, LLC | 3 464 | 0,12 | 225 | −0,44 | ||||
| 2025-08-11 | 13F | Private Advisor Group, LLC | 8 488 | 7,63 | 552 | 6,77 | ||||
| 2025-05-15 | 13F | Two Sigma Securities, Llc | 0 | −100,00 | 0 | −100,00 | ||||
| 2025-08-14 | 13F | Fmr Llc | 1 878 | −13,26 | 122 | −13,48 | ||||
| 2025-08-12 | 13F | Global Retirement Partners, LLC | 245 | 60,13 | 16 | 50,00 | ||||
| 2025-07-17 | 13F | Jackson, Grant Investment Advisers, Inc. | 3 455 | 0,06 | 225 | −0,88 | ||||
| 2025-04-16 | 13F | Crowley Wealth Management, Inc. | 0 | −100,00 | 0 | |||||
| 2025-08-04 | 13F | Integrity Alliance, Llc. | 0 | −100,00 | 0 | |||||
| 2025-08-04 | 13F | Creative Financial Designs Inc /adv | 8 347 | 0,01 | 543 | −0,73 | ||||
| 2025-04-08 | 13F | Parallel Advisors, LLC | 0 | −100,00 | 0 | |||||
| 2025-07-23 | 13F | Ameliora Wealth Management Ltd. | 500 | 0,00 | 33 | 0,00 | ||||
| 2025-08-12 | 13F | LPL Financial LLC | 274 509 | 4,29 | 17 860 | 3,45 | ||||
| 2025-08-08 | 13F | Pnc Financial Services Group, Inc. | 573 | −9,62 | 37 | −9,76 | ||||
| 2025-08-14 | 13F | Heritage Wealth Management, Inc. | 3 972 | −10,18 | 258 | −11,03 | ||||
| 2025-08-15 | 13F | Equitable Holdings, Inc. | 19 246 | −0,67 | 1 252 | −1,42 | ||||
| 2025-04-28 | 13F | Mainstream Capital Management LLC | 0 | −100,00 | 0 | |||||
| 2025-08-11 | 13F | HHM Wealth Advisors, LLC | 0 | −100,00 | 0 | |||||
| 2025-07-28 | 13F | ForthRight Wealth Management, LLC | 85 395 | 24,56 | 5 556 | 23,55 | ||||
| 2025-07-29 | 13F | Creekside Partners | 5 485 | −1,83 | 357 | −2,73 | ||||
| 2025-08-06 | 13F | Commonwealth Equity Services, Llc | 94 117 | 0,38 | 6 | 0,00 | ||||
| 2025-08-14 | 13F | Bank Of America Corp /de/ | 279 956 | −1,02 | 18 214 | −1,83 | ||||
| 2025-07-17 | 13F | Park Place Capital Corp | 29 | 0,00 | 2 | 0,00 | ||||
| 2025-08-12 | 13F | Jpmorgan Chase & Co | 2 724 | −66,31 | 177 | −66,60 | ||||
| 2025-08-14 | 13F | Goldman Sachs Group Inc | 35 312 | 58,64 | 2 297 | 57,44 | ||||
| 2025-08-11 | 13F | Wbi Investments, Inc. | 16 584 | 1,74 | 1 079 | 0,84 | ||||
| 2025-04-25 | 13F | Koshinski Asset Management, Inc. | 0 | −100,00 | 0 | |||||
| 2025-08-01 | 13F | Belvedere Trading LLC | Call | 0 | −100,00 | 0 | ||||
| 2025-08-01 | 13F | Anson Capital, Inc. | 3 579 | 4,56 | 233 | 3,57 |