Grundläggande statistik
| Institutionella ägare | 210 total, 203 long only, 0 short only, 7 long/short - change of 11,11% MRQ |
| Genomsnittlig portföljallokering | 0.1079 % - change of 21,79% MRQ |
| Institutionella aktier (lång) | 10 543 129 (ex 13D/G) - change of 2,38MM shares 29,10% MRQ |
| Institutionellt värde (lång) | $ 496 492 USD ($1000) |
Institutionellt ägande och aktieägare
Global X Funds - Global X Silver Miners ETF (US:SIL) har 210 Institutionella ägare och aktieägare som har lämnat in 13D/G- eller 13F-formulär till Securities Exchange Commission (SEC). Dessa institut innehar totalt 10,543,129 aktier. Största aktieägare inkluderar Morgan Stanley, Two Sigma Investments, Lp, LPL Financial LLC, Susquehanna International Group, Llp, D. E. Shaw & Co., Inc., Meitav Dash Investments Ltd, Jane Street Group, Llc, UBS Group AG, Wells Fargo & Company/mn, and PCG Wealth Advisors, LLC .
Global X Funds - Global X Silver Miners ETF (ARCA:SIL) Institutionell ägarstruktur visar institutioners och fonders nuvarande positioner i företaget, samt de senaste förändringarna i positionernas storlek. Större aktieägare kan vara enskilda investerare, fonder, hedgefonder eller institutioner. Bilaga 13D visar att investeraren äger (eller ägde) mer än 5% av företaget och avser (eller avsåg) att aktivt eftersträva en förändring av affärsstrategin. Schedule 13G indikerar en passiv investering på över 5%.
The share price as of September 11, 2025 is 65,40 / share. Previously, on September 12, 2024, the share price was 33,53 / share. This represents an increase of 95,05% over that period.

Fondsentimentets poäng
Fondsentimentet poängen(fka Ägarackumulation-poäng) visar vilka aktier som är mest köpta av fonder. Det är resultatet av en sofistikerad kvantitativ flerfaktormodell som identifierar företag med de högsta nivåerna av institutionell ackumulering. Poängsättningsmodellen använder en kombination av den totala ökningen av redovisade ägare, förändringarna i portföljallokeringarna för dessa ägare och andra mått. Siffran sträcker sig från 0 till 100, där högre siffror indikerar en högre nivå av ackumulering i förhållande till sina konkurrenter, och 50 är genomsnittet.
Uppdateringsfrekvens: Dagligen
Se Ownership Explorer, som innehåller en lista över de högst rankade företagen.
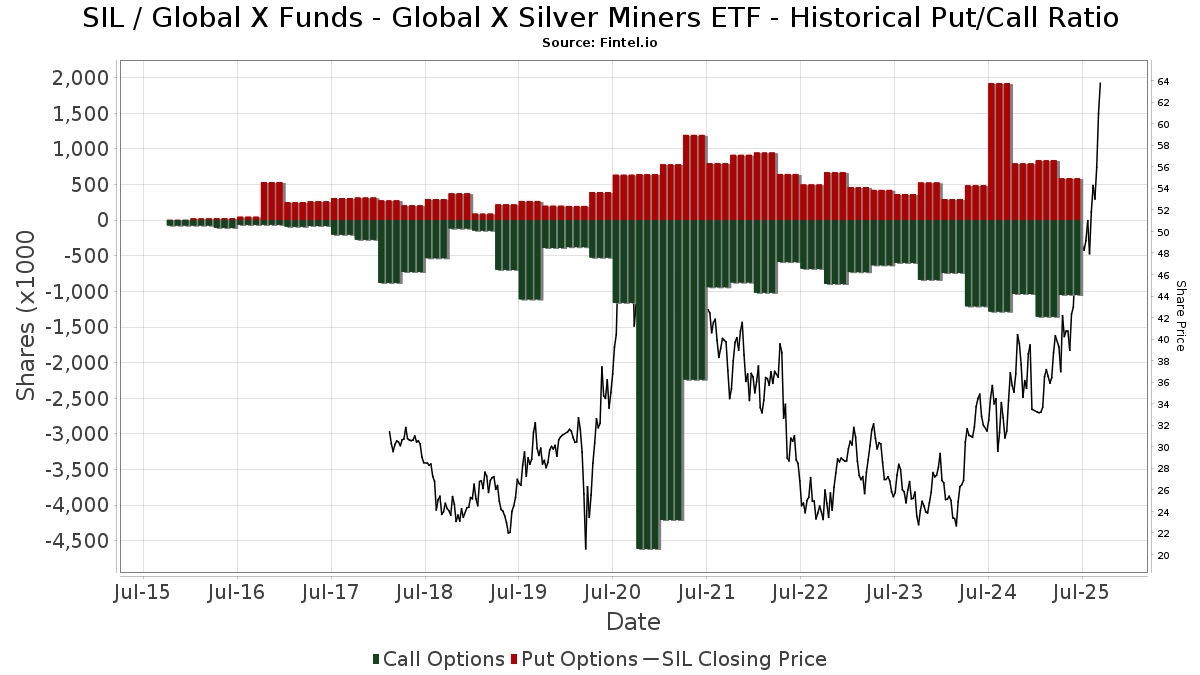
Institutionell sälj/köp-kvot
Förutom att rapportera vanliga eget kapital- och skuldemissioner måste institutioner med mer än 100MM tillgångar under förvaltning också avslöja sina innehav av sälj- och köpoptioner. Eftersom säljoptioner i allmänhet indikerar ett negativt sentiment och köpoptioner indikerar ett positivt sentiment, kan vi få en uppfattning om det övergripande institutionella sentimentet genom att plotta förhållandet mellan säljoptioner och köpoptioner. Diagrammet till höger visar det historiska förhållandet mellan sälj- och köpoptioner för detta instrument.
Genom att använda sälj/köp-kvoten som en indikator på aktieägarnas sentiment undviker man en av de största bristerna med att använda det totala institutionella ägandet, nämligen att en betydande del av de förvaltade tillgångarna investeras passivt för att följa index. Passivt förvaltade fonder köper vanligtvis inte optioner, så indikatorn för sälj/köp-kvoten ger en bättre bild av stämningen i aktivt förvaltade fonder.
13F- och NPORT-arkiveringar
Detaljer om 13F-arkiveringar är gratis. Detaljer om NP-arkiveringar kräver ett premiummedlemskap. Gröna rader indikerar nya positioner. Röda rader indikerar stängda positioner. Klicka på länk symbolen för att se hela transaktionshistoriken.
Uppgradera
för att låsa upp premiumdata och exportera till Excel ![]() .
.
| Fil Datum | Källa | Investerare | Typ | Genomsnittligt pris (beräknat) |
Aktier | Δ Aktier (%) |
Rapporterat värde (1000 USD) |
Δ Värde (%) |
Portföljallokering (%) |
|
|---|---|---|---|---|---|---|---|---|---|---|
| 2025-08-04 | 13F | Spire Wealth Management | 534 | −35,97 | 26 | −21,87 | ||||
| 2025-08-12 | 13F | Jpmorgan Chase & Co | 802 | 0,00 | 39 | 22,58 | ||||
| 2025-08-14 | 13F | Millennium Management Llc | 8 661 | −4,00 | 417 | 17,18 | ||||
| 2025-08-13 | 13F | BCJ Capital Management, LLC | 13 606 | 11,76 | 655 | 36,25 | ||||
| 2025-07-22 | 13F | Chung Wu Investment Group, LLC | 10 400 | 501 | ||||||
| 2025-07-31 | 13F | Cambridge Investment Research Advisors, Inc. | 33 330 | 18,12 | 2 | 0,00 | ||||
| 2025-08-11 | 13F | Private Advisor Group, LLC | 28 994 | 44,68 | 1 396 | 76,58 | ||||
| 2025-08-12 | 13F | Picton Mahoney Asset Management | 3 400 | 36,00 | 0 | |||||
| 2025-08-12 | 13F | Atlas Capital Advisors Llc | 1 856 | 0,00 | 89 | 21,92 | ||||
| 2025-04-30 | 13F | Sofos Investments, Inc. | 98 | 4 | ||||||
| 2025-07-17 | 13F | LexAurum Advisors, LLC | 5 140 | 0,00 | 247 | 22,28 | ||||
| 2025-08-14 | 13F | Capitolis Liquid Global Markets LLC | 0 | −100,00 | 0 | |||||
| 2025-08-11 | 13F | Tidemark, LLC | 1 365 | 0,00 | 66 | 22,64 | ||||
| 2025-08-14 | 13F | Two Sigma Investments, Lp | 903 600 | 2 697,52 | 43 499 | 3 314,36 | ||||
| 2025-08-19 | 13F | Anchor Investment Management, LLC | 0 | −100,00 | 0 | |||||
| 2025-08-14 | 13F | Qube Research & Technologies Ltd | 99 770 | 91,61 | 4 803 | 133,79 | ||||
| 2025-08-13 | 13F | Capital Fund Management S.a. | 32 498 | 1 564 | ||||||
| 2025-05-15 | 13F | Hrt Financial Lp | 0 | −100,00 | 0 | |||||
| 2025-08-12 | 13F | Founders Financial Alliance, LLC | 326 | 16 | ||||||
| 2025-08-06 | 13F | Atlantic Union Bankshares Corp | 60 | 3 | ||||||
| 2025-08-18 | 13F/A | National Bank Of Canada /fi/ | 38 383 | 659,01 | 1 849 | 828,64 | ||||
| 2025-07-31 | 13F | Wealthfront Advisers Llc | 9 058 | −36,54 | 436 | −22,56 | ||||
| 2025-08-06 | 13F | Legacy Wealth Managment, LLC/ID | 337 | 4,66 | 16 | 33,33 | ||||
| 2025-07-25 | 13F | LRI Investments, LLC | 850 | 0,00 | 41 | 21,21 | ||||
| 2025-07-25 | 13F | M.e. Allison & Co., Inc. | 6 000 | 0,00 | 289 | 22,03 | ||||
| 2025-07-15 | 13F | Financial Management Professionals, Inc. | 188 | −63,71 | 9 | −55,00 | ||||
| 2025-08-14 | 13F | Mml Investors Services, Llc | 11 064 | −32,47 | 1 | |||||
| 2025-07-29 | 13F | Stephens Inc /ar/ | 6 347 | −21,73 | 306 | −4,39 | ||||
| 2025-07-18 | 13F | PFG Investments, LLC | 11 379 | 0,00 | 548 | 22,10 | ||||
| 2025-07-23 | 13F | Meitav Dash Investments Ltd | 650 000 | 0,00 | 31 349 | 22,32 | ||||
| 2025-08-14 | 13F | Citadel Advisors Llc | 152 246 | −31,81 | 7 329 | −16,78 | ||||
| 2025-08-14 | 13F | Citadel Advisors Llc | Put | 162 900 | −30,68 | 7 842 | −15,40 | |||
| 2025-08-14 | 13F | Caption Management, LLC | Call | 0 | −100,00 | 0 | ||||
| 2025-08-14 | 13F | Citadel Advisors Llc | Call | 94 500 | 110,47 | 4 549 | 156,86 | |||
| 2025-07-21 | 13F | Ameriflex Group, Inc. | 269 | −10,93 | 13 | 18,18 | ||||
| 2025-08-07 | 13F | Resources Investment Advisors, LLC. | 15 815 | −6,29 | 761 | 14,44 | ||||
| 2025-08-11 | 13F | Covestor Ltd | 399 | 32,56 | 0 | |||||
| 2025-08-12 | 13F | Park Square Financial Group, LLC | 42 | 147,06 | 2 | |||||
| 2025-08-14 | 13F | Main Street Financial Solutions, LLC | 18 350 | −2,39 | 883 | 19,16 | ||||
| 2025-07-16 | 13F | ORG Partners LLC | 55 | −38,20 | 3 | −33,33 | ||||
| 2025-08-12 | 13F | Proequities, Inc. | 0 | 0 | ||||||
| 2025-08-13 | 13F | Safe Harbor Fiduciary, LLC | 175 | 0,00 | 8 | 33,33 | ||||
| 2025-08-14 | 13F | LMR Partners LLP | 0 | −100,00 | 0 | |||||
| 2025-07-17 | 13F | Sound Income Strategies, LLC | 44 | 0,00 | 2 | 100,00 | ||||
| 2025-08-07 | 13F | Rathbone Brothers plc | 6 655 | 0,00 | 320 | 22,14 | ||||
| 2025-07-28 | 13F | RFG Advisory, LLC | 10 242 | 3,06 | 493 | 25,77 | ||||
| 2025-08-14 | 13F | LaSalle St. Investment Advisors, LLC | 4 835 | 0 | ||||||
| 2025-08-14 | 13F | Arete Wealth Advisors, LLC | 7 337 | 0,00 | 0 | |||||
| 2025-07-25 | 13F | Atria Wealth Solutions, Inc. | 0 | −100,00 | 0 | |||||
| 2025-08-08 | 13F | Cetera Investment Advisers | 213 696 | 12,80 | 10 287 | 37,66 | ||||
| 2025-08-14 | 13F | Cantor Fitzgerald, L. P. | 0 | −100,00 | 0 | |||||
| 2025-08-27 | 13F/A | Squarepoint Ops LLC | Call | 0 | −100,00 | 0 | −100,00 | |||
| 2025-08-14 | 13F | Ancora Advisors, LLC | 1 029 | 10,76 | 50 | 36,11 | ||||
| 2025-08-15 | 13F | Morgan Stanley | 1 221 760 | 21,31 | 58 816 | 48,03 | ||||
| 2025-08-13 | 13F | VestGen Advisors, LLC | 4 179 | 201 | ||||||
| 2025-08-14 | 13F | Sunbelt Securities, Inc. | 6 211 | −3,16 | 197 | −22,13 | ||||
| 2025-07-18 | 13F | Founders Capital Management | 300 | 0,00 | 14 | 27,27 | ||||
| 2025-07-16 | 13F | Signaturefd, Llc | 6 836 | 0,00 | 329 | 22,30 | ||||
| 2025-05-15 | 13F | Barclays Plc | 0 | −100,00 | 0 | |||||
| 2025-04-23 | 13F | Oppenheimer & Co Inc | 0 | −100,00 | 0 | −100,00 | ||||
| 2025-07-14 | 13F | UMA Financial Services, Inc. | 8 700 | 0,00 | 419 | 21,87 | ||||
| 2025-08-14 | 13F | Old Mission Capital Llc | 33 745 | 1 624 | ||||||
| 2025-08-04 | 13F | Kovack Advisors, Inc. | 24 741 | 1 191 | ||||||
| 2025-07-24 | 13F | IFP Advisors, Inc | 234 | 0,00 | 11 | 22,22 | ||||
| 2025-08-05 | 13F | Tsfg, Llc | 409 | 0,00 | 0 | |||||
| 2025-08-14 | 13F | Financial Advisory Service, Inc. | 13 | 1 | ||||||
| 2025-08-13 | 13F | Baird Financial Group, Inc. | 170 802 | 39,21 | 8 222 | 69,88 | ||||
| 2025-07-08 | 13F | Parallel Advisors, LLC | 1 000 | 0,00 | 48 | 23,08 | ||||
| 2025-08-04 | 13F | Assetmark, Inc | 187 | 367,50 | 9 | 800,00 | ||||
| 2025-08-06 | 13F | AE Wealth Management LLC | 995 | 26,91 | 48 | 56,67 | ||||
| 2025-08-08 | 13F | Financial Gravity Companies, Inc. | 0 | −100,00 | 0 | |||||
| 2025-08-14 | 13F | GeoSphere Capital Management | 25 000 | 1 204 | ||||||
| 2025-08-14 | 13F | Wealth Preservation Advisors, LLC | 300 | 0,00 | 14 | 27,27 | ||||
| 2025-08-14 | 13F | D. E. Shaw & Co., Inc. | 650 237 | 1 084,23 | 31 302 | 1 345,15 | ||||
| 2025-08-13 | 13F | Renaissance Technologies Llc | 36 700 | 1 767 | ||||||
| 2025-04-14 | 13F | Clean Yield Group | 0 | −100,00 | 0 | |||||
| 2025-08-13 | 13F | Diametric Capital, LP | 10 454 | −4,60 | 503 | 16,44 | ||||
| 2025-09-04 | 13F/A | Advisor Group Holdings, Inc. | 82 485 | 123,82 | 3 850 | 164,72 | ||||
| 2025-07-15 | 13F | Wynnefield Capital Inc | 50 000 | 0,00 | 2 407 | 22,06 | ||||
| 2025-08-05 | 13F | Dunhill Financial, LLC | 500 | 0,00 | 24 | 26,32 | ||||
| 2025-08-13 | 13F | Northwestern Mutual Wealth Management Co | 65 960 | 4 486,93 | 3 175 | 5 569,64 | ||||
| 2025-08-08 | 13F | SBI Securities Co., Ltd. | 891 | 31,42 | 43 | 61,54 | ||||
| 2025-04-22 | 13F/A | NorthRock Partners, LLC | 0 | −100,00 | 0 | |||||
| 2025-07-21 | 13F | Matauro, Llc | 8 176 | 394 | ||||||
| 2025-08-14 | 13F | Clark Capital Management Group, Inc. | 88 268 | −35,17 | 4 249 | −20,89 | ||||
| 2025-08-08 | 13F | Capital Investment Advisory Services, LLC | 2 500 | 0,00 | 120 | 22,45 | ||||
| 2025-05-15 | 13F | Marshall Wace, Llp | 0 | −100,00 | 0 | |||||
| 2025-07-25 | 13F | We Are One Seven, LLC | 5 020 | 242 | ||||||
| 2025-05-12 | 13F | Fiduciary Family Office, Llc | 0 | −100,00 | 0 | |||||
| 2025-07-31 | 13F | City State Bank | 570 | 0,00 | 27 | 22,73 | ||||
| 2025-07-11 | 13F | Farther Finance Advisors, LLC | 3 700 | 335,29 | 178 | 439,39 | ||||
| 2025-07-28 | 13F | Harbour Investments, Inc. | 8 108 | 9,88 | 390 | 34,02 | ||||
| 2025-05-16 | 13F | Jones Financial Companies Lllp | 0 | −100,00 | 0 | |||||
| 2025-07-14 | 13F | Park Avenue Securities Llc | 8 535 | −17,06 | 0 | |||||
| 2025-08-13 | 13F | Mount Yale Investment Advisors, LLC | 49 318 | 3,54 | 2 374 | 26,34 | ||||
| 2025-08-01 | 13F | Belvedere Trading LLC | Call | 400 | −97,33 | 19 | −96,79 | |||
| 2025-08-06 | 13F | Pekin Hardy Strauss, Inc. | 43 663 | −0,76 | 2 102 | 21,10 | ||||
| 2025-07-28 | 13F | Pettinga Financial Advisors, LLC | 8 612 | −22,50 | 415 | −5,48 | ||||
| 2025-08-01 | 13F | Belvedere Trading LLC | Put | 5 100 | 2,00 | 246 | 24,37 | |||
| 2025-08-14 | 13F | Shay Capital LLC | Call | 42 500 | 2 046 | |||||
| 2025-08-14 | 13F | Comerica Bank | 5 279 | 54,85 | 254 | 89,55 | ||||
| 2025-07-08 | 13F | Arlington Trust Co LLC | 3 238 | 0,00 | 156 | 22,05 | ||||
| 2025-08-14 | 13F | CIBC World Markets Inc. | 39 566 | −3,95 | 1 905 | 17,17 | ||||
| 2025-08-11 | 13F | HighTower Advisors, LLC | 30 146 | 22,06 | 1 451 | 48,97 | ||||
| 2025-08-12 | 13F | MAI Capital Management | 3 404 | 0,00 | 164 | 21,64 | ||||
| 2025-07-08 | 13F | Ballew Advisors, Inc | 70 741 | −6,80 | 3 473 | 13,76 | ||||
| 2025-08-05 | 13F | Bank Of Montreal /can/ | 5 781 | 11,69 | 278 | 36,27 | ||||
| 2025-08-11 | 13F | Sprott Inc. | 74 671 | −3,71 | 3 595 | 17,49 | ||||
| 2025-08-13 | 13F | New Harbor Financial Group, LLC | 21 480 | −11,28 | 1 034 | 8,27 | ||||
| 2025-08-13 | 13F | Scotia Capital Inc. | 66 662 | 321,24 | 3 209 | 414,26 | ||||
| 2025-08-07 | 13F | Evoke Wealth, Llc | 30 496 | 24,67 | 1 470 | 52,33 | ||||
| 2025-08-14 | 13F | Raymond James Financial Inc | 82 030 | 21,79 | 3 949 | 48,59 | ||||
| 2025-08-14 | 13F | Ameriprise Financial Inc | 255 277 | 100,73 | 12 476 | 148,70 | ||||
| 2025-07-21 | 13F | Portfolio Strategies, Inc. | 10 812 | 9,91 | 520 | 34,02 | ||||
| 2025-05-15 | 13F | Grayhawk Investment Strategies Inc. | 90 | 0,00 | 4 | 50,00 | ||||
| 2025-05-12 | 13F | RIA Advisory Group LLC | 0 | −100,00 | 0 | |||||
| 2025-08-11 | 13F | Citigroup Inc | 181 281 | 15,97 | 8 727 | 41,52 | ||||
| 2025-05-15 | 13F | Cubist Systematic Strategies, LLC | 0 | −100,00 | 0 | −100,00 | ||||
| 2025-08-18 | 13F | Geneos Wealth Management Inc. | 23 305 | −0,64 | 1 122 | 21,19 | ||||
| 2025-08-08 | NP | QALTX - Quantified Alternative Investment Fund Investor Class Shares | 235 | −15,77 | 11 | 0,00 | ||||
| 2025-07-28 | 13F | Copia Wealth Management | 2 140 | 39,96 | 103 | 71,67 | ||||
| 2025-08-29 | 13F | Total Investment Management Inc | 3 489 | 168 | ||||||
| 2025-07-01 | 13F | Harbor Investment Advisory, Llc | 17 027 | −0,33 | 820 | 21,69 | ||||
| 2025-08-14 | 13F | IHT Wealth Management, LLC | 25 563 | 3,38 | 1 231 | 26,15 | ||||
| 2025-04-14 | 13F | IMC-Chicago, LLC | 0 | −100,00 | 0 | |||||
| 2025-07-23 | 13F | Columbus Macro, LLC | 12 454 | 0,59 | 600 | 22,75 | ||||
| 2025-07-24 | 13F | Cyndeo Wealth Partners, LLC | 6 546 | 0,00 | 315 | 22,09 | ||||
| 2025-08-07 | 13F | Encompass More Asset Management | 26 943 | 1 297 | ||||||
| 2025-07-25 | 13F | Concord Wealth Partners | 358 | 0,00 | 17 | 21,43 | ||||
| 2025-05-14 | 13F | Oarsman Capital, Inc. | 0 | −100,00 | 0 | |||||
| 2025-07-15 | 13F | Well Done, LLC | 0 | −100,00 | 0 | |||||
| 2025-08-14 | 13F | Wells Fargo & Company/mn | 317 173 | 2,41 | 15 269 | 24,96 | ||||
| 2025-08-13 | 13F | SCP Investment, LP | 8 800 | 424 | ||||||
| 2025-05-12 | 13F | Virtu Financial LLC | 0 | −100,00 | 0 | |||||
| 2025-05-09 | 13F | Belvedere Trading LLC | 0 | −100,00 | 0 | −100,00 | ||||
| 2025-08-25 | 13F/A | Neuberger Berman Group LLC | 7 370 | 0,00 | 355 | 22,07 | ||||
| 2025-08-14 | 13F | Group One Trading, L.p. | 150 567 | 29,27 | 7 248 | 57,77 | ||||
| 2025-07-30 | 13F | FNY Investment Advisers, LLC | 4 011 | 52,92 | 0 | |||||
| 2025-08-04 | 13F | Bay Colony Advisory Group, Inc d/b/a Bay Colony Advisors | 7 149 | 344 | ||||||
| 2025-08-14 | 13F | Van Den Berg Management I, Inc | 50 | 2 | ||||||
| 2025-05-15 | 13F | LMR Partners LLP | Put | 0 | −100,00 | 0 | −100,00 | |||
| 2025-08-12 | 13F | O'shaughnessy Asset Management, Llc | 71 | 0,00 | 3 | 50,00 | ||||
| 2025-08-05 | 13F | GPS Wealth Strategies Group, LLC | 105 | 0,00 | 5 | 25,00 | ||||
| 2025-08-12 | 13F | Financial Advocates Investment Management | 0 | −100,00 | 0 | |||||
| 2025-08-14 | 13F | Fiduciary Trust Co | 10 270 | −0,87 | 494 | 21,08 | ||||
| 2025-08-13 | 13F | Walleye Capital LLC | 0 | −100,00 | 0 | |||||
| 2025-08-01 | 13F | Y-Intercept (Hong Kong) Ltd | 19 289 | 929 | ||||||
| 2025-07-25 | 13F | SPC Financial, Inc. | 20 379 | 5,77 | 981 | 29,08 | ||||
| 2025-07-24 | 13F | Ronald Blue Trust, Inc. | 3 414 | −0,06 | 164 | 22,39 | ||||
| 2025-08-14 | 13F | UBS Group AG | 367 242 | −27,06 | 17 679 | −11,00 | ||||
| 2025-08-14 | 13F | Bank Of America Corp /de/ | 80 332 | 2,60 | 3 867 | 25,23 | ||||
| 2025-08-14 | 13F | UBS Group AG | Call | 97 890 | −71,66 | 4 712 | −65,41 | |||
| 2025-05-13 | 13F | Franklin Resources Inc | 0 | −100,00 | 0 | −100,00 | ||||
| 2025-08-08 | 13F | Kingsview Wealth Management, LLC | 0 | −100,00 | 0 | |||||
| 2025-08-13 | 13F | Walleye Trading LLC | Call | 2 200 | −21,43 | 106 | −4,55 | |||
| 2025-08-13 | 13F | Capula Management Ltd | 20 000 | −63,30 | 963 | −55,23 | ||||
| 2025-08-13 | 13F | Walleye Trading LLC | 7 110 | 211,84 | 342 | 284,27 | ||||
| 2025-08-06 | 13F | Legacy Investment Solutions, LLC | 337 | 4,66 | 16 | 45,45 | ||||
| 2025-07-08 | 13F | Juncture Wealth Strategies, Llc | 25 266 | 5,22 | 1 216 | 28,41 | ||||
| 2025-07-23 | 13F | Vontobel Holding Ltd. | 42 100 | 0,00 | 2 027 | 22,05 | ||||
| 2025-07-25 | 13F | Sequoia Financial Advisors, LLC | 6 134 | 6,68 | 295 | 30,53 | ||||
| 2025-08-13 | 13F | Walleye Trading LLC | Put | 7 400 | 356 | |||||
| 2025-07-24 | 13F | Baldwin Brothers Inc/ma | 7 350 | 22,50 | 354 | 49,58 | ||||
| 2025-08-07 | 13F | Kestra Private Wealth Services, Llc | 10 991 | 25,80 | 529 | 53,78 | ||||
| 2025-07-15 | 13F | Jeppson Wealth Management, Llc | 6 728 | −0,74 | 324 | 20,97 | ||||
| 2025-08-12 | 13F | AlphaCore Capital LLC | 476 | 23 | ||||||
| 2025-08-05 | 13F | Sigma Planning Corp | 12 262 | −8,83 | 590 | 11,32 | ||||
| 2025-08-01 | 13F | Vision Financial Markets Llc | 50 | 0,00 | 2 | 100,00 | ||||
| 2025-08-14 | 13F | Barometer Capital Management Inc. | 9 200 | −26,98 | 443 | −11,07 | ||||
| 2025-08-14 | 13F | Jane Street Group, Llc | Put | 173 200 | 51,66 | 8 338 | 85,06 | |||
| 2025-08-14 | 13F | Jane Street Group, Llc | Call | 70 700 | 855,41 | 3 403 | 1 069,42 | |||
| 2025-08-11 | 13F | Principal Securities, Inc. | 9 714 | 3,76 | 468 | 57,24 | ||||
| 2025-08-01 | 13F | Liberty Wealth Management Llc | 0 | −100,00 | 0 | −100,00 | ||||
| 2025-07-30 | 13F | Whittier Trust Co | 222 | 0,00 | 11 | 25,00 | ||||
| 2025-08-11 | 13F | TD Waterhouse Canada Inc. | 270 | 13 | ||||||
| 2025-08-15 | 13F | Tower Research Capital LLC (TRC) | 35 | 2 | ||||||
| 2025-07-28 | 13F | Kiker Wealth Management, LLC | 1 750 | 52,17 | 84 | 86,67 | ||||
| 2025-08-05 | 13F | Financial Sense Advisors, Inc. | 27 513 | −48,17 | 1 324 | −36,77 | ||||
| 2025-08-14 | 13F | Glen Eagle Advisors, LLC | 3 | 0,00 | 0 | |||||
| 2025-08-14 | 13F | Cubist Systematic Strategies, LLC | Call | 43 300 | 501,39 | 2 084 | 633,80 | |||
| 2025-08-05 | 13F | Advisors Preferred, LLC | 235 | −15,77 | 11 | 10,00 | ||||
| 2025-08-13 | 13F | StoneX Group Inc. | 0 | −100,00 | 0 | −100,00 | ||||
| 2025-08-14 | 13F | Transamerica Financial Advisors, Inc. | 2 | 0,00 | 0 | |||||
| 2025-08-14 | 13F | UBS Group AG | Put | 0 | −100,00 | 0 | −100,00 | |||
| 2025-07-22 | 13F | DAVENPORT & Co LLC | 4 365 | −30,33 | 210 | −14,98 | ||||
| 2025-08-06 | 13F | Golden State Wealth Management, LLC | 60 | 3 | ||||||
| 2025-08-06 | 13F | Commonwealth Equity Services, Llc | 34 552 | −4,55 | 2 | 0,00 | ||||
| 2025-08-07 | 13F | PCG Wealth Advisors, LLC | 317 038 | −23,55 | 15 262 | −6,71 | ||||
| 2025-07-30 | 13F | Atlantic Edge Private Wealth Management, LLC | 70 | 0,00 | 3 | 50,00 | ||||
| 2025-08-14 | 13F | Sagard Holdings Management Inc. | 90 | 4 | ||||||
| 2025-08-14 | 13F | Cubist Systematic Strategies, LLC | Put | 47 000 | 2 263 | |||||
| 2025-08-27 | 13F/A | Squarepoint Ops LLC | 32 910 | −2,08 | 1 584 | 19,55 | ||||
| 2025-07-30 | 13F | Bogart Wealth, LLC | 636 | 3 080,00 | 31 | |||||
| 2025-08-06 | 13F | First Horizon Advisors, Inc. | 196 | 9 | ||||||
| 2025-08-12 | 13F | Howe & Rusling Inc | 100 | −50,00 | 5 | −42,86 | ||||
| 2025-08-15 | 13F | Sender Co & Partners, Inc. | 25 989 | 49,56 | 1 251 | 82,63 | ||||
| 2025-07-30 | 13F | D.a. Davidson & Co. | 93 815 | 159,16 | 4 516 | 216,25 | ||||
| 2025-08-14 | 13F | Prelude Capital Management, Llc | 0 | −100,00 | 0 | |||||
| 2025-08-05 | 13F | Carolinas Wealth Consulting Llc | 0 | −100,00 | 0 | −100,00 | ||||
| 2025-08-13 | 13F | Cerity Partners LLC | 21 401 | 1,75 | 1 030 | 24,25 | ||||
| 2025-08-08 | 13F | Pnc Financial Services Group, Inc. | 4 781 | 1 452,27 | 230 | 1 816,67 | ||||
| 2025-08-14 | 13F | Wellington Management Group Llp | 0 | −100,00 | 0 | |||||
| 2025-08-14 | 13F | Stifel Financial Corp | 165 604 | 118,33 | 7 972 | 166,44 | ||||
| 2025-08-01 | 13F | GoalVest Advisory LLC | 1 053 | 0,00 | 51 | 21,95 | ||||
| 2025-08-14 | 13F | Jane Street Group, Llc | 378 792 | 18 235 | ||||||
| 2025-08-05 | 13F | Simplex Trading, Llc | 78 910 | 6,23 | 4 | 50,00 | ||||
| 2025-04-25 | 13F | K.J. Harrison & Partners Inc | 0 | −100,00 | 0 | −100,00 | ||||
| 2025-07-14 | 13F | AdvisorNet Financial, Inc | 225 | 11 | ||||||
| 2025-08-01 | 13F | Envestnet Asset Management Inc | 119 708 | −3,86 | 5 763 | 17,30 | ||||
| 2025-08-05 | 13F | Verity Asset Management, Inc. | 5 240 | −22,71 | 252 | −5,62 | ||||
| 2025-08-01 | 13F | Anson Capital, Inc. | 6 991 | 3,79 | 337 | 26,79 | ||||
| 2025-07-29 | 13F | Beverly Hills Private Wealth, LLC | 24 020 | 43,08 | 1 156 | 74,62 | ||||
| 2025-08-18 | 13F | Wolverine Trading, Llc | 47 157 | 249,86 | 2 213 | 315,79 | ||||
| 2025-08-11 | 13F | Vanguard Group Inc | 5 500 | 0,00 | 265 | 22,22 | ||||
| 2025-08-12 | 13F | Global Retirement Partners, LLC | 3 669 | −59,34 | 177 | −38,46 | ||||
| 2025-08-11 | 13F | Aptus Capital Advisors, LLC | 497 | 0,00 | 24 | 21,05 | ||||
| 2025-08-14 | 13F | Fmr Llc | 677 | −18,73 | 33 | 0,00 | ||||
| 2025-08-15 | 13F | Kestra Advisory Services, LLC | 74 114 | −8,71 | 3 568 | 11,40 | ||||
| 2025-08-14 | 13F | Mariner, LLC | 13 983 | 7,59 | 673 | 31,45 | ||||
| 2025-08-08 | 13F | SG Americas Securities, LLC | 40 214 | 2 | ||||||
| 2025-08-13 | 13F | Quadrature Capital Ltd | 0 | −100,00 | 0 | |||||
| 2025-05-14 | 13F | Legend Financial Advisors, Inc. | 0 | −100,00 | 0 | |||||
| 2025-08-12 | 13F | CIBC Private Wealth Group, LLC | 91 | 4 | ||||||
| 2025-08-12 | 13F | Steward Partners Investment Advisory, Llc | 6 302 | 384,77 | 303 | 494,12 | ||||
| 2025-08-07 | 13F | Guardian Partners Inc. | 78 400 | 3 784 | ||||||
| 2025-08-14 | 13F | Goldman Sachs Group Inc | Call | 0 | −100,00 | 0 | ||||
| 2025-07-15 | 13F | Compagnie Lombard Odier SCmA | 250 | −50,00 | 12 | −36,84 | ||||
| 2025-05-16 | 13F | Coppell Advisory Solutions LLC | 0 | −100,00 | 0 | |||||
| 2025-08-08 | 13F | Creative Planning | 19 867 | 1,20 | 956 | 23,51 | ||||
| 2025-08-14 | 13F | Royal Bank Of Canada | 246 478 | 17,32 | 11 866 | 43,17 | ||||
| 2025-08-14 | 13F | Goldman Sachs Group Inc | 0 | −100,00 | 0 | |||||
| 2025-08-18 | 13F | Wolverine Trading, Llc | Call | 17 900 | −69,30 | 840 | −63,55 | |||
| 2025-08-05 | 13F | Magnolia Capital Advisors Llc | 4 701 | 226 | ||||||
| 2025-08-18 | 13F | Wolverine Trading, Llc | Put | 12 100 | −8,33 | 568 | 8,83 | |||
| 2025-08-14 | 13F | SummitTX Capital, L.P. | 75 000 | 3 610 | ||||||
| 2025-08-27 | NP | TIFF INVESTMENT PROGRAM - TIFF Multi-Asset Fund | 6 284 | 303 | ||||||
| 2025-04-24 | 13F | Kessler Investment Group, LLC | 0 | −100,00 | 0 | |||||
| 2025-07-16 | 13F | Highline Wealth Partners Llc | 0 | −100,00 | 0 | |||||
| 2025-07-21 | 13F | Mirae Asset Global Investments Co., Ltd. | 8 800 | −28,46 | 424 | −12,78 | ||||
| 2025-07-16 | 13F | One + One Wealth Management, Llc | 67 350 | −2,12 | 3 242 | 19,45 | ||||
| 2025-07-29 | 13F | Private Trust Co Na | 40 | −45,21 | 2 | −50,00 | ||||
| 2025-07-17 | 13F | Moss Adams Wealth Advisors LLC | 64 239 | 3 092 | ||||||
| 2025-08-12 | 13F | J.w. Cole Advisors, Inc. | 20 320 | 978 | ||||||
| 2025-08-13 | 13F | Level Four Advisory Services, Llc | 16 433 | −0,95 | 791 | 20,95 | ||||
| 2025-08-14 | 13F | Bnp Paribas Arbitrage, Sa | 42 633 | 86,38 | 2 052 | 127,49 | ||||
| 2025-08-11 | 13F | Citigroup Inc | Put | 0 | −100,00 | 0 | −100,00 | |||
| 2025-08-14 | 13F | Visionary Wealth Advisors | 4 307 | 207 | ||||||
| 2025-08-08 | 13F | Emerald Investment Partners, Llc | 45 | 2 | ||||||
| 2025-08-13 | 13F | Summit Financial, LLC | 80 552 | −0,66 | 3 884 | 21,41 | ||||
| 2025-08-15 | 13F | Ion Asset Management Ltd. | 30 800 | 15,36 | 1 483 | 40,74 | ||||
| 2025-08-06 | 13F | Prospera Financial Services Inc | 29 429 | 1 417 | ||||||
| 2025-05-12 | 13F | Independent Advisor Alliance | 0 | −100,00 | 0 | |||||
| 2025-08-14 | 13F | Banco BTG Pactual S.A. | 18 059 | −76,63 | 869 | −71,49 | ||||
| 2025-08-14 | 13F | GWM Advisors LLC | 10 357 | −29,93 | 499 | −14,58 | ||||
| 2025-05-12 | 13F | Sandy Spring Bank | 72 | 2,86 | 3 | 0,00 | ||||
| 2025-07-29 | 13F | Robinson Value Management, Ltd. | 5 547 | 0,00 | 267 | 22,48 | ||||
| 2025-08-14 | 13F | Susquehanna International Group, Llp | Put | 179 000 | −5,74 | 8 617 | 15,03 | |||
| 2025-07-16 | 13F | Strategic Investment Solutions, Inc. /IL | 0 | −100,00 | 0 | −100,00 | ||||
| 2025-08-14 | 13F | Susquehanna International Group, Llp | 7 408 | −92,35 | 357 | −90,68 | ||||
| 2025-08-18 | 13F | Hollencrest Capital Management | 18 591 | 0,00 | 895 | 21,96 | ||||
| 2025-08-14 | 13F | Saudi Central Bank | 203 700 | 9 822 | ||||||
| 2025-08-14 | 13F | Susquehanna International Group, Llp | Call | 678 500 | −10,49 | 32 663 | 9,23 | |||
| 2025-08-12 | 13F | LPL Financial LLC | 723 885 | −2,96 | 34 848 | 18,42 | ||||
| 2025-05-05 | 13F | Lindbrook Capital, Llc | 100 | 0,00 | 4 | 0,00 | ||||
| 2025-07-21 | 13F | Quattro Financial Advisors Llc | 49 195 | 0,00 | 2 368 | 22,06 | ||||
| 2025-08-14 | 13F | Federation des caisses Desjardins du Quebec | 73 345 | −1,16 | 3 531 | 20,60 | ||||
| 2025-08-12 | 13F | Change Path, LLC | 4 308 | −49,66 | 207 | −38,58 | ||||
| 2025-07-25 | 13F | Cwm, Llc | 2 230 | 0 | ||||||
| 2025-08-11 | 13F | Blue Bell Private Wealth Management, Llc | 326 | 8,31 | 16 | 36,36 |