Grundläggande statistik
| Institutionella ägare | 187 total, 187 long only, 0 short only, 0 long/short - change of −4,59% MRQ |
| Genomsnittlig portföljallokering | 0.2028 % - change of −21,26% MRQ |
| Institutionella aktier (lång) | 19 034 428 (ex 13D/G) - change of −3,03MM shares −13,72% MRQ |
| Institutionellt värde (lång) | $ 781 324 USD ($1000) |
Institutionellt ägande och aktieägare
Invesco Exchange-Traded Fund Trust II - Invesco S&P SmallCap 600 Revenue ETF (US:RWJ) har 187 Institutionella ägare och aktieägare som har lämnat in 13D/G- eller 13F-formulär till Securities Exchange Commission (SEC). Dessa institut innehar totalt 19,034,428 aktier. Största aktieägare inkluderar LPL Financial LLC, Morgan Stanley, Ameriprise Financial Inc, Fusion Family Wealth LLC, Bank Of America Corp /de/, UBS Group AG, Raymond James Financial Inc, Commonwealth Equity Services, Llc, Advisor Group Holdings, Inc., and Wells Fargo & Company/mn .
Invesco Exchange-Traded Fund Trust II - Invesco S&P SmallCap 600 Revenue ETF (ARCA:RWJ) Institutionell ägarstruktur visar institutioners och fonders nuvarande positioner i företaget, samt de senaste förändringarna i positionernas storlek. Större aktieägare kan vara enskilda investerare, fonder, hedgefonder eller institutioner. Bilaga 13D visar att investeraren äger (eller ägde) mer än 5% av företaget och avser (eller avsåg) att aktivt eftersträva en förändring av affärsstrategin. Schedule 13G indikerar en passiv investering på över 5%.
The share price as of September 12, 2025 is 48,14 / share. Previously, on September 16, 2024, the share price was 44,57 / share. This represents an increase of 8,01% over that period.

Fondsentimentets poäng
Fondsentimentet poängen(fka Ägarackumulation-poäng) visar vilka aktier som är mest köpta av fonder. Det är resultatet av en sofistikerad kvantitativ flerfaktormodell som identifierar företag med de högsta nivåerna av institutionell ackumulering. Poängsättningsmodellen använder en kombination av den totala ökningen av redovisade ägare, förändringarna i portföljallokeringarna för dessa ägare och andra mått. Siffran sträcker sig från 0 till 100, där högre siffror indikerar en högre nivå av ackumulering i förhållande till sina konkurrenter, och 50 är genomsnittet.
Uppdateringsfrekvens: Dagligen
Se Ownership Explorer, som innehåller en lista över de högst rankade företagen.
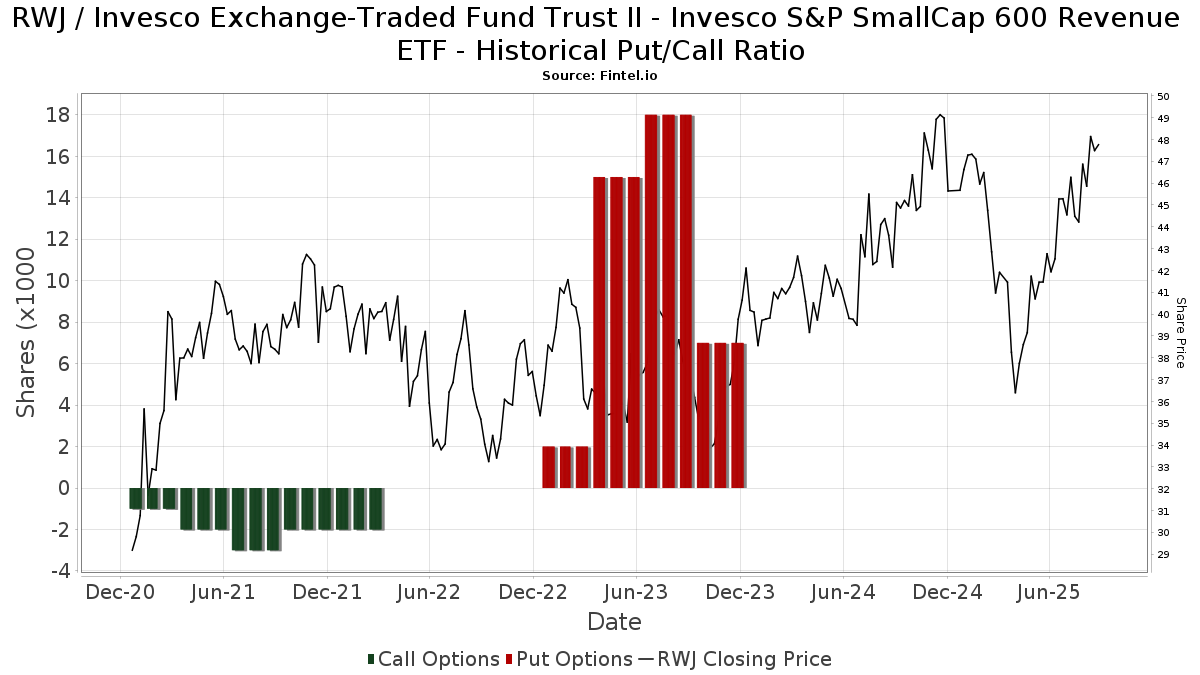
Institutionell sälj/köp-kvot
Förutom att rapportera vanliga eget kapital- och skuldemissioner måste institutioner med mer än 100MM tillgångar under förvaltning också avslöja sina innehav av sälj- och köpoptioner. Eftersom säljoptioner i allmänhet indikerar ett negativt sentiment och köpoptioner indikerar ett positivt sentiment, kan vi få en uppfattning om det övergripande institutionella sentimentet genom att plotta förhållandet mellan säljoptioner och köpoptioner. Diagrammet till höger visar det historiska förhållandet mellan sälj- och köpoptioner för detta instrument.
Genom att använda sälj/köp-kvoten som en indikator på aktieägarnas sentiment undviker man en av de största bristerna med att använda det totala institutionella ägandet, nämligen att en betydande del av de förvaltade tillgångarna investeras passivt för att följa index. Passivt förvaltade fonder köper vanligtvis inte optioner, så indikatorn för sälj/köp-kvoten ger en bättre bild av stämningen i aktivt förvaltade fonder.
13F- och NPORT-arkiveringar
Detaljer om 13F-arkiveringar är gratis. Detaljer om NP-arkiveringar kräver ett premiummedlemskap. Gröna rader indikerar nya positioner. Röda rader indikerar stängda positioner. Klicka på länk symbolen för att se hela transaktionshistoriken.
Uppgradera
för att låsa upp premiumdata och exportera till Excel ![]() .
.
| Fil Datum | Källa | Investerare | Typ | Genomsnittligt pris (beräknat) |
Aktier | Δ Aktier (%) |
Rapporterat värde (1000 USD) |
Δ Värde (%) |
Portföljallokering (%) |
|
|---|---|---|---|---|---|---|---|---|---|---|
| 2025-07-28 | 13F | Harbour Investments, Inc. | 106 522 | −23,22 | 4 611 | −18,33 | ||||
| 2025-08-14 | 13F | Ausdal Financial Partners, Inc. | 30 891 | 4,42 | 1 337 | 11,05 | ||||
| 2025-07-17 | 13F | Janney Montgomery Scott LLC | 34 148 | −1,31 | 1 | 0,00 | ||||
| 2025-07-18 | 13F | Consolidated Planning Corp | 312 598 | −3,61 | 13 532 | 2,53 | ||||
| 2025-07-21 | 13F | Ameritas Advisory Services, LLC | 2 217 | 96 | ||||||
| 2025-07-21 | 13F | Ameriflex Group, Inc. | 0 | −100,00 | 0 | |||||
| 2025-08-14 | 13F | Wiley Bros.-aintree Capital, Llc | 121 751 | −4,77 | 5 271 | 6,29 | ||||
| 2025-08-14 | 13F | Advisor OS, LLC | 7 500 | 325 | ||||||
| 2025-05-13 | 13F | Brooklyn FI, LLC | 0 | −100,00 | 0 | −100,00 | ||||
| 2025-08-08 | 13F | Fiera Capital Corp | 7 851 | 0,00 | 340 | 6,27 | ||||
| 2025-07-25 | 13F | NorthRock Partners, LLC | 732 | −58,92 | 32 | −56,94 | ||||
| 2025-08-06 | 13F | Moors & Cabot, Inc. | 15 561 | −10,15 | 674 | −4,40 | ||||
| 2025-08-13 | 13F | Valued Retirements, Inc. | 62 493 | 1,33 | 2 705 | 7,77 | ||||
| 2025-05-12 | 13F | Founders Financial Securities Llc | 0 | −100,00 | 0 | |||||
| 2025-04-11 | 13F | LPF Advisors LLC | 9 871 | −17,98 | 402 | −27,09 | ||||
| 2025-08-07 | 13F | Kestra Private Wealth Services, Llc | 4 644 | 201 | ||||||
| 2025-07-08 | 13F | Zrc Wealth Management, Llc | 1 929 | 0,00 | 84 | 6,41 | ||||
| 2025-08-14 | 13F | Warren Averett Asset Management, LLC | 4 754 | 206 | ||||||
| 2025-08-06 | 13F | Vantage Financial Partners, LLC | 33 391 | 10,61 | 1 446 | 17,67 | ||||
| 2025-08-11 | 13F | Aptus Capital Advisors, LLC | 2 283 | 0,22 | 99 | 6,52 | ||||
| 2025-08-14 | 13F | EP Wealth Advisors, Inc. | 11 291 | 5,98 | 489 | 12,70 | ||||
| 2025-07-30 | 13F | Fusion Family Wealth LLC | 1 444 721 | 1,36 | 62 542 | 7,81 | ||||
| 2025-08-15 | 13F | Morgan Stanley | 2 054 911 | 0,72 | 88 957 | 7,13 | ||||
| 2025-04-11 | 13F | Unique Wealth, Llc | 0 | −100,00 | 0 | |||||
| 2025-04-21 | 13F | ORG Partners LLC | 0 | −100,00 | 0 | |||||
| 2025-07-23 | 13F | Prime Capital Investment Advisors, LLC | 33 887 | 1,13 | 1 467 | 7,56 | ||||
| 2025-09-04 | 13F/A | Advisor Group Holdings, Inc. | 553 244 | −6,32 | 23 961 | −0,36 | ||||
| 2025-08-14 | 13F | Susquehanna International Group, Llp | 76 111 | 846,18 | 3 295 | 907,34 | ||||
| 2025-07-10 | 13F | Sovran Advisors, LLC | 44 815 | −22,69 | 2 019 | −5,96 | ||||
| 2025-07-25 | 13F | Cwm, Llc | 812 | 223,51 | 0 | |||||
| 2025-08-12 | 13F | Aviso Financial Inc. | 600 | 26 | ||||||
| 2025-08-12 | 13F | Fortis Capital Management LLC | 35 047 | −8,77 | 1 517 | −2,94 | ||||
| 2025-07-15 | 13F | CHB Investment Group, LLC | 23 982 | −0,91 | 1 | |||||
| 2025-07-10 | 13F | Marshall Financial Group LLC | 12 089 | 0,01 | 540 | 9,78 | ||||
| 2025-08-14 | 13F | Comerica Bank | 4 867 | −4,47 | 211 | 1,45 | ||||
| 2025-07-17 | 13F | Montis Financial, LLC | 7 092 | −18,23 | 307 | −12,78 | ||||
| 2025-08-11 | 13F | Tidemark, LLC | 802 | −65,73 | 35 | −64,21 | ||||
| 2025-08-13 | 13F/A | StoneX Group Inc. | 6 695 | 0,01 | 803 | −2,55 | ||||
| 2025-07-11 | 13F | SILVER OAK SECURITIES, Inc | 9 588 | 0,00 | 415 | 6,41 | ||||
| 2025-08-12 | 13F | Coldstream Capital Management Inc | 0 | −100,00 | 0 | |||||
| 2025-08-15 | 13F | Captrust Financial Advisors | 8 867 | 58,54 | 384 | 68,72 | ||||
| 2025-08-13 | 13F | Cerity Partners LLC | 19 583 | 0,01 | 848 | 6,41 | ||||
| 2025-08-14 | 13F/A | Rockefeller Capital Management L.P. | 35 853 | 0,63 | 1 552 | 7,03 | ||||
| 2025-07-25 | 13F | Retirement Planning Group, Llc / Ny | 11 638 | 2,86 | 504 | 9,35 | ||||
| 2025-07-31 | 13F | CVA Family Office, LLC | 124 | 0,00 | 5 | 0,00 | ||||
| 2025-07-24 | 13F | IFP Advisors, Inc | 101 912 | 12,62 | 4 412 | 19,77 | ||||
| 2025-08-12 | 13F | Jpmorgan Chase & Co | 34 605 | −3,33 | 1 498 | 2,88 | ||||
| 2025-08-13 | 13F | Capital Analysts, Inc. | 922 | 0,00 | 0 | |||||
| 2025-07-30 | 13F | Nottingham Advisors, Inc. | 26 680 | 0,00 | 1 155 | 6,36 | ||||
| 2025-07-25 | 13F | Atria Wealth Solutions, Inc. | 6 673 | −47,87 | 289 | −44,62 | ||||
| 2025-08-07 | 13F | Guidance Capital, Inc | 29 989 | 7,78 | 1 286 | 16,08 | ||||
| 2025-08-12 | 13F | J.w. Cole Advisors, Inc. | 5 877 | −17,48 | 254 | −12,11 | ||||
| 2025-07-10 | 13F | Tompkins Financial Corp | 456 | −16,48 | 20 | −13,64 | ||||
| 2025-07-22 | 13F | Valley National Advisers Inc | 0 | −100,00 | 0 | |||||
| 2025-08-12 | 13F | Calton & Associates, Inc. | 0 | −100,00 | 0 | |||||
| 2025-08-12 | 13F | OneAscent Financial Services LLC | 6 514 | −44,12 | 0 | |||||
| 2025-08-08 | 13F | Opinicus Capital, Inc. | 38 162 | 4,05 | 1 652 | 10,72 | ||||
| 2025-07-10 | 13F | Kmg Fiduciary Partners, Llc | 8 606 | −59,76 | 373 | −57,24 | ||||
| 2025-08-08 | 13F | Avantax Advisory Services, Inc. | 75 213 | 9,35 | 3 256 | 16,29 | ||||
| 2025-08-14 | 13F | Integrity Wealth Advisors, Inc. | 12 862 | 10,28 | 557 | 17,30 | ||||
| 2025-04-28 | 13F | Strategic Financial Concepts, LLC | 0 | −100,00 | 0 | −100,00 | ||||
| 2025-08-08 | 13F | Pnc Financial Services Group, Inc. | 111 | 0,00 | 5 | 0,00 | ||||
| 2025-07-16 | 13F | Kendall Capital Management | 0 | −100,00 | 0 | |||||
| 2025-08-05 | 13F | Tsfg, Llc | 11 080 | 0,46 | 0 | |||||
| 2025-08-13 | 13F | Brown Advisory Inc | 14 001 | 9,37 | 606 | 16,31 | ||||
| 2025-08-01 | 13F | Gwn Securities Inc. | 0 | −100,00 | 0 | |||||
| 2025-08-12 | 13F | Insigneo Advisory Services, Llc | 6 820 | −3,66 | 295 | 2,43 | ||||
| 2025-07-11 | 13F | Farther Finance Advisors, LLC | 159 | 0,00 | 7 | 0,00 | ||||
| 2025-08-14 | 13F | Wells Fargo & Company/mn | 448 260 | −26,44 | 19 405 | −21,75 | ||||
| 2025-08-11 | 13F | Citigroup Inc | 201 | 0,50 | 9 | 0,00 | ||||
| 2025-05-13 | 13F | Thrivent Financial For Lutherans | 0 | −100,00 | 0 | |||||
| 2025-08-11 | 13F | Principal Securities, Inc. | 5 297 | −74,66 | 229 | −76,05 | ||||
| 2025-08-14 | 13F | Jane Street Group, Llc | 42 655 | −0,97 | 1 847 | 5,31 | ||||
| 2025-08-13 | 13F | Jones Financial Companies Lllp | 85 378 | 32,50 | 3 707 | 41,43 | ||||
| 2025-08-18 | 13F | Geneos Wealth Management Inc. | 16 169 | 4,84 | 700 | 11,48 | ||||
| 2025-08-11 | 13F | Nations Financial Group Inc, /ia/ /adv | 13 674 | −0,19 | 592 | 6,10 | ||||
| 2025-08-12 | 13F | Titleist Asset Management, Llc | 4 997 | −61,23 | 216 | −58,78 | ||||
| 2025-07-16 | 13F | Meridian Financial, LLC | 4 910 | 213 | ||||||
| 2025-07-31 | 13F | WFA Asset Management Corp | 256 564 | −18,72 | 10 281 | −23,93 | ||||
| 2025-07-08 | 13F | Nbc Securities, Inc. | 268 | 0,00 | 0 | |||||
| 2025-08-14 | 13F | Mpwm Advisory Solutions, Llc | 0 | −100,00 | 0 | |||||
| 2025-07-28 | 13F | Copia Wealth Management | 9 452 | 5,49 | 409 | 12,36 | ||||
| 2025-05-12 | 13F | Independent Advisor Alliance | 0 | −100,00 | 0 | |||||
| 2025-08-14 | 13F | Pine Harbor Wealth Management, LLC | 6 909 | 0,00 | 299 | 6,41 | ||||
| 2025-08-12 | 13F | Ameritas Investment Partners, Inc. | 18 804 | 13,43 | 814 | 20,77 | ||||
| 2025-08-27 | 13F/A | Brinker Capital Investments, LLC | 19 243 | 19,80 | 833 | 27,57 | ||||
| 2025-08-04 | 13F | Flagship Harbor Advisors, Llc | 0 | −100,00 | 0 | |||||
| 2025-08-14 | 13F | Two Sigma Securities, Llc | 7 206 | 312 | ||||||
| 2025-08-08 | 13F | Foundations Investment Advisors, LLC | 168 224 | 10,28 | 7 282 | 17,30 | ||||
| 2025-04-29 | 13F | Hm Payson & Co | 1 254 | 0,00 | 51 | −10,53 | ||||
| 2025-05-15 | 13F | Ashton Thomas Securities, Llc | 0 | −100,00 | 0 | |||||
| 2025-07-21 | 13F | DHJJ Financial Advisors, Ltd. | 108 | 0,00 | 5 | 0,00 | ||||
| 2025-08-08 | 13F | Ogorek Anthony Joseph /ny/ /adv | 420 | 0,24 | 0 | |||||
| 2025-08-11 | 13F | Private Advisor Group, LLC | 285 829 | −33,90 | 12 374 | −29,70 | ||||
| 2025-08-14 | 13F | UBS Group AG | 809 267 | 51,31 | 35 033 | 60,95 | ||||
| 2025-08-08 | 13F | Gts Securities Llc | 18 805 | −21,84 | 814 | −16,85 | ||||
| 2025-07-29 | 13F | Private Trust Co Na | 3 094 | −10,66 | 134 | −5,00 | ||||
| 2025-08-12 | 13F | Fairscale Capital, LLC | 36 | 0,00 | 2 | 0,00 | ||||
| 2025-05-05 | 13F | Lindbrook Capital, Llc | 3 000 | 0,00 | 122 | −10,95 | ||||
| 2025-08-01 | 13F | Bessemer Group Inc | 7 065 | −1,40 | 0 | |||||
| 2025-08-21 | 13F | Aveo Capital Partners, LLC | 0 | −100,00 | 0 | |||||
| 2025-08-15 | 13F | Equitable Holdings, Inc. | 7 847 | 22,42 | 340 | 30,38 | ||||
| 2025-08-14 | 13F | Sunbelt Securities, Inc. | 0 | −100,00 | 0 | |||||
| 2025-07-29 | 13F | Signature Estate & Investment Advisors Llc | 4 704 | 204 | ||||||
| 2025-08-14 | 13F | Goldman Sachs Group Inc | 60 002 | 0,00 | 2 597 | 6,35 | ||||
| 2025-05-12 | 13F | Sandy Spring Bank | 1 864 | 0,00 | 76 | −11,76 | ||||
| 2025-08-07 | 13F | Legacy Financial Advisors, Inc. | 29 217 | 7,44 | 1 265 | 14,29 | ||||
| 2025-07-22 | 13F | Belpointe Asset Management LLC | 27 895 | 33,19 | 1 208 | 41,67 | ||||
| 2025-05-15 | 13F/A | Orion Portfolio Solutions, LLC | 16 063 | −9,60 | 654 | −19,68 | ||||
| 2025-08-11 | 13F | Western Wealth Management, LLC | 31 289 | 1,58 | 1 355 | 8,06 | ||||
| 2025-08-08 | 13F | Creative Planning | 29 181 | −4,02 | 1 263 | 2,10 | ||||
| 2025-08-14 | 13F | Citadel Advisors Llc | 104 019 | 161,35 | 4 503 | 178,07 | ||||
| 2025-07-16 | 13F | Swisher Financial Concepts, Inc. | 18 484 | −30,30 | 800 | −25,86 | ||||
| 2025-07-21 | 13F | Patriot Financial Group Insurance Agency, LLC | 33 049 | 11,64 | 1 431 | 18,77 | ||||
| 2025-08-04 | 13F | Spire Wealth Management | 0 | −100,00 | 0 | |||||
| 2025-08-19 | 13F | Anchor Investment Management, LLC | 777 | 0,00 | 34 | 6,45 | ||||
| 2025-08-12 | 13F | MWA Asset Management | 6 731 | −24,20 | 291 | −19,39 | ||||
| 2025-08-14 | 13F | Raymond James Financial Inc | 646 992 | −57,87 | 28 008 | −55,19 | ||||
| 2025-07-14 | 13F | S.A. Mason LLC | 8 425 | 0,00 | 365 | 6,43 | ||||
| 2025-07-30 | 13F | Onyx Bridge Wealth Group LLC | 24 150 | −31,98 | 1 045 | −27,68 | ||||
| 2025-08-06 | 13F | Commonwealth Equity Services, Llc | 633 845 | 0,72 | 27 | 8,00 | ||||
| 2025-08-14 | 13F | Bnp Paribas Arbitrage, Sa | 204 | 385,71 | 9 | 700,00 | ||||
| 2025-07-10 | 13F | Wealth Enhancement Advisory Services, Llc | 207 340 | 11,03 | 9 405 | 23,74 | ||||
| 2025-08-06 | 13F | AE Wealth Management LLC | 567 | 16,91 | 25 | 26,32 | ||||
| 2025-08-14 | 13F | Mml Investors Services, Llc | 74 073 | −19,52 | 3 | 0,00 | ||||
| 2025-07-18 | 13F | Bartlett & Co. Wealth Management Llc | 21 | 0,00 | 1 | |||||
| 2025-07-18 | 13F | Truist Financial Corp | 22 287 | 1,03 | 965 | 7,47 | ||||
| 2025-07-15 | 13F | Main Street Group, LTD | 46 503 | 30,50 | 2 013 | 38,83 | ||||
| 2025-08-12 | 13F | Proequities, Inc. | 0 | 0 | ||||||
| 2025-07-30 | 13F | Pacific Sun Financial Corp | 40 164 | −0,33 | 1 739 | 5,98 | ||||
| 2025-08-04 | 13F | Pensionmark Financial Group, Llc | 8 790 | −75,65 | 381 | −74,13 | ||||
| 2025-08-14 | 13F | Fmr Llc | 5 771 | 6,55 | 250 | 13,18 | ||||
| 2025-07-17 | 13F | Cyr Financial Inc. | 115 557 | 9,83 | 5 002 | 16,81 | ||||
| 2025-07-14 | 13F | Sowell Financial Services LLC | 17 993 | 0,40 | 779 | 6,72 | ||||
| 2025-08-07 | 13F | Allworth Financial LP | 671 | 235,50 | 29 | 314,29 | ||||
| 2025-08-12 | 13F | AlphaCore Capital LLC | 210 | 9 | ||||||
| 2025-05-12 | 13F | C2P Capital Advisory Group, LLC d.b.a. Prosperity Capital Advisors | 0 | −100,00 | 0 | −100,00 | ||||
| 2025-08-05 | 13F | Sigma Planning Corp | 29 601 | −9,68 | 1 281 | −3,90 | ||||
| 2025-08-14 | 13F | GWM Advisors LLC | 38 555 | 14,89 | 1 669 | 22,27 | ||||
| 2025-08-13 | 13F | Renaissance Technologies Llc | 0 | −100,00 | 0 | |||||
| 2025-08-11 | 13F | Covestor Ltd | 66 | −50,00 | 0 | |||||
| 2025-08-13 | 13F | IAG Wealth Partners, LLC | 345 | 0,00 | 15 | 0,00 | ||||
| 2025-08-14 | 13F | Royal Bank Of Canada | 177 673 | 44,56 | 7 691 | 53,76 | ||||
| 2025-07-30 | 13F | Liberty One Investment Management, Llc | 49 549 | 5,21 | 2 145 | 11,90 | ||||
| 2025-07-30 | 13F | Crewe Advisors LLC | 0 | −100,00 | 0 | |||||
| 2025-07-14 | 13F | Cathy Pareto & Associates, Inc | 20 503 | −21,82 | 888 | −16,87 | ||||
| 2025-08-12 | 13F | Steward Partners Investment Advisory, Llc | 52 502 | 0,19 | 2 273 | 6,57 | ||||
| 2025-08-04 | 13F | Atria Investments Llc | 38 883 | −42,78 | 1 683 | −39,13 | ||||
| 2025-08-08 | 13F | Thoroughbred Financial Services, Llc | 28 280 | −55,57 | 1 | −50,00 | ||||
| 2025-08-14 | 13F | Great Valley Advisor Group, Inc. | 25 526 | −8,63 | 1 105 | −2,81 | ||||
| 2025-07-31 | 13F | Whipplewood Advisors, LLC | 3 270 | −88,58 | 142 | −71,63 | ||||
| 2025-08-14 | 13F | CoreCap Advisors, LLC | 47 251 | 16,54 | 2 045 | 23,94 | ||||
| 2025-08-25 | NP | KOOL - North Shore Equity Rotation ETF | 15 750 | −48,35 | 682 | −45,12 | ||||
| 2025-07-18 | 13F | Parsons Capital Management Inc/ri | 5 850 | 0,00 | 253 | 6,30 | ||||
| 2025-05-06 | 13F | Forbes J M & Co Llp | 0 | −100,00 | 0 | |||||
| 2025-08-12 | 13F | Financial Advocates Investment Management | 39 392 | −3,27 | 1 705 | 2,90 | ||||
| 2025-07-28 | 13F | Kiker Wealth Management, LLC | 589 | −67,73 | 25 | −66,22 | ||||
| 2025-07-07 | 13F | Investors Research Corp | 78 | 0,00 | 3 | 0,00 | ||||
| 2025-07-07 | 13F | Whitaker-Myers Wealth Managers, LTD. | 4 992 | 1,34 | 216 | 8,00 | ||||
| 2025-07-14 | 13F | Park Avenue Securities Llc | 5 591 | 0 | ||||||
| 2025-08-05 | 13F | Obermeyer Wood Investment Counsel, Lllp | 18 921 | 0,06 | 819 | 6,50 | ||||
| 2025-08-14 | 13F | Ancora Advisors, LLC | 288 126 | −7,96 | 12 473 | −2,10 | ||||
| 2025-07-29 | 13F | Stratos Wealth Partners, LTD. | 38 542 | −1,19 | 1 669 | 5,10 | ||||
| 2025-08-12 | 13F | Gladstone Institutional Advisory LLC | 30 875 | 7,36 | 1 337 | 14,19 | ||||
| 2025-08-14 | 13F | Colony Group, LLC | 419 499 | 6,44 | 18 160 | 13,22 | ||||
| 2025-06-02 | 13F/A | Modern Wealth Management, LLC | 6 767 | −19,39 | 275 | −28,39 | ||||
| 2025-08-12 | 13F | LPL Financial LLC | 2 706 243 | −14,49 | 117 153 | −9,05 | ||||
| 2025-07-31 | 13F | Cambridge Investment Research Advisors, Inc. | 123 935 | −27,45 | 5 | −16,67 | ||||
| 2025-08-13 | 13F | Russell Investments Group, Ltd. | 210 | −47,37 | 9 | −43,75 | ||||
| 2025-08-14 | 13F | Hrt Financial Lp | 24 567 | 1 | ||||||
| 2025-08-13 | 13F | Northwestern Mutual Wealth Management Co | 396 365 | 13,21 | 17 159 | 20,42 | ||||
| 2025-08-14 | 13F | Potentia Wealth | 0 | −100,00 | 0 | |||||
| 2025-07-14 | 13F | UMA Financial Services, Inc. | 6 | 0,00 | 0 | |||||
| 2025-08-13 | 13F | MONECO Advisors, LLC | 76 246 | −4,22 | 3 301 | 1,88 | ||||
| 2025-08-14 | 13F | Arete Wealth Advisors, LLC | 0 | −100,00 | 0 | |||||
| 2025-07-31 | 13F | Glass Jacobson Investment Advisors llc | 0 | −100,00 | 0 | |||||
| 2025-08-05 | 13F | Bank Of Montreal /can/ | 6 825 | 8,75 | 295 | 15,69 | ||||
| 2025-08-15 | 13F | Kestra Advisory Services, LLC | 34 195 | −12,48 | 1 480 | −6,92 | ||||
| 2025-08-04 | 13F | IFG Advisory, LLC | 23 080 | −65,28 | 999 | −63,07 | ||||
| 2025-08-14 | 13F | Bank Of America Corp /de/ | 1 190 231 | 5,53 | 51 525 | 12,25 | ||||
| 2025-08-14 | 13F | Two Sigma Investments, Lp | 0 | −100,00 | 0 | |||||
| 2025-08-14 | 13F | Stifel Financial Corp | 20 845 | −3,65 | 902 | 2,50 | ||||
| 2025-08-13 | 13F | Proactive Wealth Strategies LLC | 6 230 | −0,61 | 0 | |||||
| 2025-05-06 | 13F | Assetmark, Inc | 0 | −100,00 | 0 | |||||
| 2025-08-14 | 13F | Mariner, LLC | 76 515 | −1,34 | 3 312 | 4,94 | ||||
| 2025-08-13 | 13F | Rsm Us Wealth Management Llc | 0 | −100,00 | 0 | |||||
| 2025-08-13 | 13F | Alerus Financial Na | 310 | 13 | ||||||
| 2025-07-22 | 13F | Miracle Mile Advisors, LLC | 5 253 | 3,94 | 227 | 10,73 | ||||
| 2025-07-07 | 13F | Nova Wealth Management, Inc. | 2 100 | 481,72 | 91 | 542,86 | ||||
| 2025-08-05 | 13F | Key FInancial Inc | 6 686 | 289 | ||||||
| 2025-08-14 | 13F | Ameriprise Financial Inc | 1 792 940 | −33,91 | 77 673 | −29,65 | ||||
| 2025-08-08 | 13F | Cetera Investment Advisers | 184 564 | 4,25 | 7 990 | 10,88 | ||||
| 2025-08-12 | 13F | Global Retirement Partners, LLC | 19 428 | 2,18 | 841 | −3,33 | ||||
| 2025-07-24 | 13F | Edge Financial Advisors LLC | 28 648 | 10,06 | 1 246 | 17,56 | ||||
| 2025-08-04 | 13F | Creative Financial Designs Inc /adv | 1 948 | 0,00 | 84 | 6,33 | ||||
| 2025-08-08 | 13F | Citizens Financial Group Inc/ri | 21 450 | −3,17 | 929 | 3,00 | ||||
| 2025-05-12 | 13F | Maia Wealth LLC | 0 | −100,00 | 0 | |||||
| 2025-07-10 | 13F | SK Wealth Management, LLC | 121 756 | −22,40 | 5 513 | −3,69 | ||||
| 2025-08-11 | 13F | HighTower Advisors, LLC | 19 207 | −27,91 | 831 | −23,34 | ||||
| 2025-05-09 | 13F | Kickstand Ventures, Llc. | 0 | −100,00 | 0 | |||||
| 2025-08-19 | 13F | National Asset Management, Inc. | 0 | −100,00 | 0 | |||||
| 2025-05-22 | 13F | Wbi Investments, Inc. | 0 | −100,00 | 0 | |||||
| 2025-07-15 | 13F | World Equity Group, Inc. | 6 602 | −8,42 | 286 | −2,73 | ||||
| 2025-07-30 | 13F | Lionsbridge Wealth Management LLC | 0 | −100,00 | 0 | |||||
| 2025-08-14 | 13F | Byrne Financial Freedom, Llc | 19 841 | −4,15 | 859 | 1,90 | ||||
| 2025-08-14 | 13F | Mercer Global Advisors Inc /adv | 5 540 | −42,44 | 240 | −38,87 | ||||
| 2025-08-01 | 13F | Envestnet Asset Management Inc | 131 049 | −7,95 | 5 673 | −2,09 | ||||
| 2025-07-23 | 13F | Hall Capital Management Co Inc | 6 700 | 0,00 | 290 | 6,62 | ||||
| 2025-07-16 | 13F | New Insight Wealth Advisors | 11 686 | −14,75 | 506 | −9,34 | ||||
| 2025-08-01 | 13F | James Investment Research Inc | 45 001 | −10,54 | 1 948 | −4,84 | ||||
| 2025-07-31 | 13F | Curio Wealth, Llc | 5 | 400,00 | 0 | |||||
| 2025-07-30 | 13F | Klingman & Associates, LLC | 28 569 | 0,00 | 1 237 | 6,37 | ||||
| 2025-08-01 | 13F | First Command Advisory Services, Inc. | 3 567 | 0,00 | 154 | 6,21 | ||||
| 2025-04-29 | 13F | Investor's Fiduciary Advisor Network, LLC | 0 | −100,00 | 0 | |||||
| 2025-08-15 | 13F | Cornerstone Financial Group, LLC /NE/ | 7 312 | 0,26 | 317 | 3,27 | ||||
| 2025-07-09 | 13F | Bowman & Co S.C. | 23 173 | 0,05 | 1 003 | 6,48 | ||||
| 2025-07-09 | 13F | Fermata Advisors, LLC | 5 533 | −89,89 | 240 | −89,27 | ||||
| 2025-07-24 | 13F | Us Bancorp \de\ | 24 306 | −41,38 | 1 052 | −37,64 | ||||
| 2025-08-14 | 13F | Hilltop Holdings Inc. | 18 935 | 0,25 | 820 | 6,64 | ||||
| 2025-08-06 | 13F | Financial Advisory Corp /ut/ /adv | 12 795 | 2,04 | 1 | |||||
| 2025-08-14 | 13F | D. E. Shaw & Co., Inc. | 0 | −100,00 | 0 | |||||
| 2025-08-05 | 13F | Claro Advisors LLC | 15 687 | −1,22 | 679 | 5,11 | ||||
| 2025-08-12 | 13F | MAI Capital Management | 392 822 | 4,48 | 17 005 | 11,13 | ||||
| 2025-08-05 | 13F | GPS Wealth Strategies Group, LLC | 375 | 0,00 | 16 | 6,67 | ||||
| 2025-08-12 | 13F | O'shaughnessy Asset Management, Llc | 0 | −100,00 | 0 |