Grundläggande statistik
| Institutionella ägare | 140 total, 140 long only, 0 short only, 0 long/short - change of −6,00% MRQ |
| Genomsnittlig portföljallokering | 0.1206 % - change of −16,15% MRQ |
| Institutionella aktier (lång) | 14 660 843 (ex 13D/G) - change of −1,12MM shares −7,10% MRQ |
| Institutionellt värde (lång) | $ 373 940 USD ($1000) |
Institutionellt ägande och aktieägare
Nuveen Nasdaq 100 Dynamic Overwrite Fund (US:QQQX) har 140 Institutionella ägare och aktieägare som har lämnat in 13D/G- eller 13F-formulär till Securities Exchange Commission (SEC). Dessa institut innehar totalt 14,660,843 aktier. Största aktieägare inkluderar Morgan Stanley, Karpus Management, Inc., Wells Fargo & Company/mn, Invesco Ltd., UBS Group AG, Royal Bank Of Canada, PCEF - Invesco CEF Income Composite ETF, Cornerstone Advisors, LLC, LPL Financial LLC, and 1607 Capital Partners, LLC .
Nuveen Nasdaq 100 Dynamic Overwrite Fund (NasdaqGS:QQQX) Institutionell ägarstruktur visar institutioners och fonders nuvarande positioner i företaget, samt de senaste förändringarna i positionernas storlek. Större aktieägare kan vara enskilda investerare, fonder, hedgefonder eller institutioner. Bilaga 13D visar att investeraren äger (eller ägde) mer än 5% av företaget och avser (eller avsåg) att aktivt eftersträva en förändring av affärsstrategin. Schedule 13G indikerar en passiv investering på över 5%.
The share price as of September 17, 2025 is 27,02 / share. Previously, on September 18, 2024, the share price was 24,75 / share. This represents an increase of 9,17% over that period.

Fondsentimentets poäng
Fondsentimentet poängen(fka Ägarackumulation-poäng) visar vilka aktier som är mest köpta av fonder. Det är resultatet av en sofistikerad kvantitativ flerfaktormodell som identifierar företag med de högsta nivåerna av institutionell ackumulering. Poängsättningsmodellen använder en kombination av den totala ökningen av redovisade ägare, förändringarna i portföljallokeringarna för dessa ägare och andra mått. Siffran sträcker sig från 0 till 100, där högre siffror indikerar en högre nivå av ackumulering i förhållande till sina konkurrenter, och 50 är genomsnittet.
Uppdateringsfrekvens: Dagligen
Se Ownership Explorer, som innehåller en lista över de högst rankade företagen.
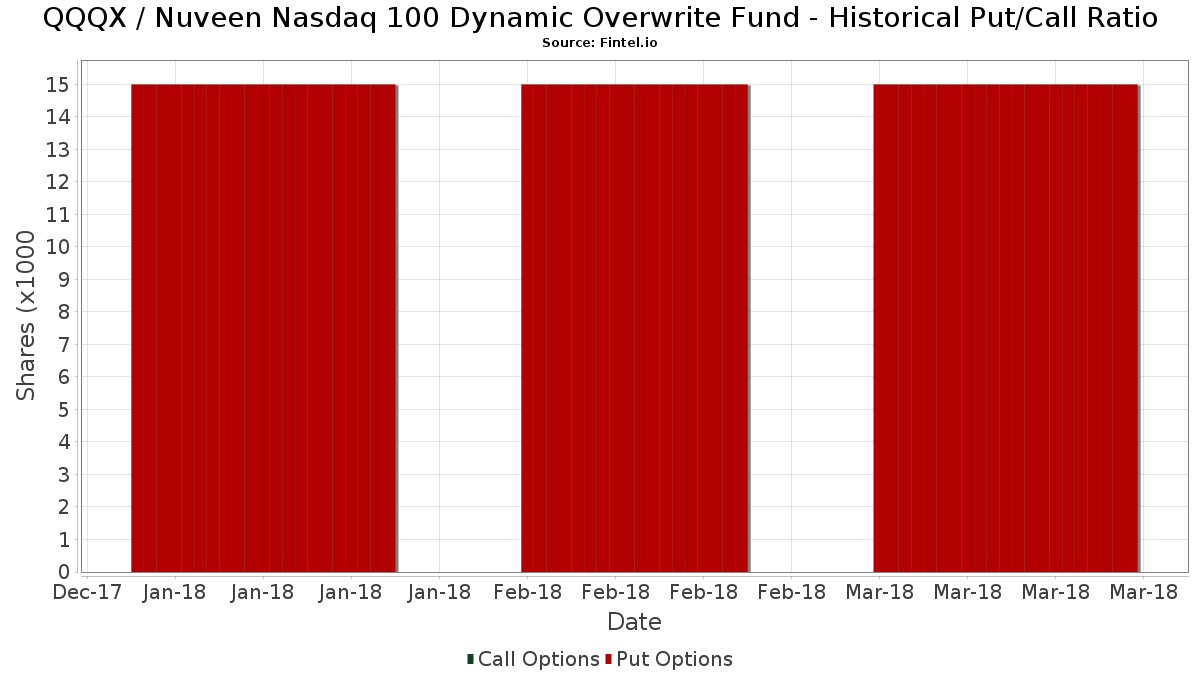
Institutionell sälj/köp-kvot
Förutom att rapportera vanliga eget kapital- och skuldemissioner måste institutioner med mer än 100MM tillgångar under förvaltning också avslöja sina innehav av sälj- och köpoptioner. Eftersom säljoptioner i allmänhet indikerar ett negativt sentiment och köpoptioner indikerar ett positivt sentiment, kan vi få en uppfattning om det övergripande institutionella sentimentet genom att plotta förhållandet mellan säljoptioner och köpoptioner. Diagrammet till höger visar det historiska förhållandet mellan sälj- och köpoptioner för detta instrument.
Genom att använda sälj/köp-kvoten som en indikator på aktieägarnas sentiment undviker man en av de största bristerna med att använda det totala institutionella ägandet, nämligen att en betydande del av de förvaltade tillgångarna investeras passivt för att följa index. Passivt förvaltade fonder köper vanligtvis inte optioner, så indikatorn för sälj/köp-kvoten ger en bättre bild av stämningen i aktivt förvaltade fonder.
13F- och NPORT-arkiveringar
Detaljer om 13F-arkiveringar är gratis. Detaljer om NP-arkiveringar kräver ett premiummedlemskap. Gröna rader indikerar nya positioner. Röda rader indikerar stängda positioner. Klicka på länk symbolen för att se hela transaktionshistoriken.
Uppgradera
för att låsa upp premiumdata och exportera till Excel ![]() .
.
| Fil Datum | Källa | Investerare | Typ | Genomsnittligt pris (beräknat) |
Aktier | Δ Aktier (%) |
Rapporterat värde (1000 USD) |
Δ Värde (%) |
Portföljallokering (%) |
|
|---|---|---|---|---|---|---|---|---|---|---|
| 2025-08-07 | 13F | Cypress Capital Management LLC (WY) | 161 035 | 150,43 | 4 353 | 178,44 | ||||
| 2025-08-08 | 13F | WealthTrust Asset Management, LLC | 10 639 | −10,00 | 282 | 0,36 | ||||
| 2025-08-14 | 13F | Great Valley Advisor Group, Inc. | 14 301 | −43,66 | 379 | −37,21 | ||||
| 2025-07-29 | 13F | International Assets Investment Management, Llc | 13 389 | −0,62 | 354 | 10,97 | ||||
| 2025-08-04 | 13F | Flagship Harbor Advisors, Llc | 0 | −100,00 | 0 | |||||
| 2025-05-14 | 13F | Huntington National Bank | 17 | −11,11 | ||||||
| 2025-07-17 | 13F | Vermillion Wealth Management, Inc. | 237 | 0,00 | 6 | 20,00 | ||||
| 2025-08-11 | 13F | HighTower Advisors, LLC | 250 298 | −13,96 | 6 625 | −4,11 | ||||
| 2025-08-14 | 13F | Wealth Preservation Advisors, LLC | 221 | 0,00 | 6 | 0,00 | ||||
| 2025-08-13 | 13F | Capital Analysts, Inc. | 2 702 | −50,00 | 0 | |||||
| 2025-08-14 | 13F | Polar Asset Management Partners Inc. | 189 421 | 481,96 | 5 014 | 548,51 | ||||
| 2025-07-23 | 13F | Kingswood Wealth Advisors, Llc | 13 887 | −16,69 | 368 | −7,56 | ||||
| 2025-08-06 | 13F | Golden State Wealth Management, LLC | 210 | 0,00 | 6 | 25,00 | ||||
| 2025-08-04 | 13F | Wolverine Asset Management Llc | 0 | −100,00 | 0 | |||||
| 2025-06-30 | 13F/A | Deutsche Bank Ag\ | 0 | −100,00 | 0 | |||||
| 2025-08-14 | 13F | GWM Advisors LLC | 47 559 | 21,91 | 1 259 | 35,85 | ||||
| 2025-08-15 | 13F | Morgan Stanley | 2 047 158 | 15,18 | 54 188 | 28,38 | ||||
| 2025-08-05 | 13F | GPS Wealth Strategies Group, LLC | 9 | 12,50 | 0 | |||||
| 2025-07-23 | 13F | TriaGen Wealth Management LLC | 10 951 | 0,00 | 290 | 11,15 | ||||
| 2025-08-13 | 13F | Summit Financial, LLC | 9 905 | 267 | ||||||
| 2025-07-31 | 13F | Richards, Merrill & Peterson, Inc. | 0 | −100,00 | 0 | |||||
| 2025-08-14 | 13F | Karpus Management, Inc. | 1 803 255 | −0,66 | 47 732 | 10,71 | ||||
| 2025-07-29 | 13F | Salomon & Ludwin, LLC | 491 | 0,00 | 13 | 9,09 | ||||
| 2025-07-29 | 13F | Stratos Wealth Partners, LTD. | 19 124 | −18,35 | 506 | −8,99 | ||||
| 2025-05-16 | 13F | Coppell Advisory Solutions LLC | 0 | −100,00 | 0 | |||||
| 2025-07-17 | 13F | Janney Montgomery Scott LLC | 226 733 | −14,13 | 6 | 0,00 | ||||
| 2025-05-20 | 13F | Aspen Investment Management Inc | 0 | −100,00 | 0 | |||||
| 2025-04-15 | 13F | Noble Wealth Management PBC | 375 | 0,00 | 9 | −20,00 | ||||
| 2025-07-30 | 13F | Loring Wolcott & Coolidge Fiduciary Advisors Llp/ma | 0 | −100,00 | 0 | |||||
| 2025-07-31 | 13F | Avory & Company, LLC | 17 157 | 0,00 | 454 | 11,55 | ||||
| 2025-05-29 | NP | ACEFX - Absolute Strategies Fund Institutional Shares | 2 390 | −30,14 | 57 | −39,13 | ||||
| 2025-05-15 | 13F | Millennium Management Llc | 0 | −100,00 | 0 | −100,00 | ||||
| 2025-07-24 | 13F | Us Bancorp \de\ | 7 817 | 0,00 | 207 | 11,35 | ||||
| 2025-08-14 | 13F | CoreCap Advisors, LLC | 1 000 | −55,04 | 26 | −50,00 | ||||
| 2025-08-15 | 13F | Equitable Holdings, Inc. | 7 738 | 205 | ||||||
| 2025-07-16 | 13F | Register Financial Advisors LLC | 10 115 | 0,00 | 268 | 11,25 | ||||
| 2025-08-05 | 13F | Aviance Capital Partners, LLC | 13 414 | 0,04 | 355 | 11,64 | ||||
| 2025-08-27 | NP | RYMSX - Guggenheim Multi-Hedge Strategies Fund Class P | 72 | −38,46 | 2 | −50,00 | ||||
| 2025-07-29 | 13F | Huntleigh Advisors, Inc. | 21 869 | 3,26 | 579 | 15,14 | ||||
| 2025-07-16 | 13F | Dakota Wealth Management | 37 110 | 0,00 | 982 | 11,46 | ||||
| 2025-07-18 | 13F | Truist Financial Corp | 18 130 | 0,42 | 480 | 11,92 | ||||
| 2025-08-12 | 13F | Jacobi Capital Management LLC | 9 433 | 1,97 | 250 | 13,70 | ||||
| 2025-07-15 | 13F | Financial Management Professionals, Inc. | 155 | 0,00 | 4 | 33,33 | ||||
| 2025-05-06 | 13F | Avantax Advisory Services, Inc. | 0 | −100,00 | 0 | |||||
| 2025-08-12 | 13F | Jpmorgan Chase & Co | 0 | −100,00 | 0 | |||||
| 2025-08-14 | 13F | Comerica Bank | 12 187 | −3,93 | 323 | 6,98 | ||||
| 2025-08-18 | 13F | Hollencrest Capital Management | 492 | 28,46 | 13 | 44,44 | ||||
| 2025-08-15 | 13F | Tower Research Capital LLC (TRC) | 81 | 2 | ||||||
| 2025-08-01 | 13F | Vision Financial Markets Llc | 410 | 2,50 | 11 | 11,11 | ||||
| 2025-07-16 | 13F | Diversified Enterprises, LLC | 12 434 | 0,78 | 329 | 12,29 | ||||
| 2025-08-12 | 13F | Proequities, Inc. | 0 | 0 | ||||||
| 2025-08-12 | 13F | Retirement Planning Co of New England, Inc. | 0 | −100,00 | 0 | |||||
| 2025-07-25 | NP | FCEF - First Trust CEF Income Opportunity ETF This fund is a listed as child fund of First Trust Advisors Lp and if that institution has disclosed ownership in this security, then these positions will not be double counted when calculating total shares and total value | 17 810 | 10,70 | 450 | 7,93 | ||||
| 2025-07-09 | 13F | Sapient Capital Llc | 19 984 | −10,94 | 540 | −0,92 | ||||
| 2025-08-14 | 13F | Susquehanna International Group, Llp | 0 | −100,00 | 0 | |||||
| 2025-07-08 | 13F | Nbc Securities, Inc. | 59 620 | 8,11 | 2 | 0,00 | ||||
| 2025-08-15 | 13F | Captrust Financial Advisors | 7 935 | 210 | ||||||
| 2025-08-14 | 13F | Ameriprise Financial Inc | 202 289 | −24,66 | 5 355 | −16,03 | ||||
| 2025-08-12 | 13F | Left Brain Wealth Management, LLC | 0 | −100,00 | 0 | |||||
| 2025-08-14 | 13F | Arete Wealth Advisors, LLC | 125 155 | 2,68 | 3 | 50,00 | ||||
| 2025-08-14 | 13F | Wiley Bros.-aintree Capital, Llc | 27 889 | 197,93 | 738 | 233,94 | ||||
| 2025-07-10 | 13F | Sovran Advisors, LLC | 9 242 | 0,00 | 242 | 16,99 | ||||
| 2025-08-06 | 13F | Moors & Cabot, Inc. | 13 934 | 0,87 | 369 | 12,20 | ||||
| 2025-08-14 | 13F | Quarry LP | 0 | −100,00 | 0 | |||||
| 2025-08-07 | 13F | Readystate Asset Management Lp | 0 | −100,00 | 0 | |||||
| 2025-08-08 | 13F | Cornerstone Advisors, LLC | 567 223 | −38,59 | 15 014 | −31,56 | ||||
| 2025-08-14 | 13F | Two Sigma Investments, Lp | 78 927 | 2 089 | ||||||
| 2025-08-12 | 13F | Steward Partners Investment Advisory, Llc | 4 229 | 0,00 | 112 | 11,00 | ||||
| 2025-08-12 | 13F | Advisors Asset Management, Inc. | 101 016 | 27,09 | 2 674 | 41,65 | ||||
| 2025-08-14 | 13F | Mercer Global Advisors Inc /adv | 19 951 | 2,60 | 528 | 14,53 | ||||
| 2025-08-14 | 13F | Goldman Sachs Group Inc | 11 306 | −5,83 | 299 | 4,91 | ||||
| 2025-07-15 | 13F | Absolute Investment Advisers Llc | 0 | −100,00 | 0 | |||||
| 2025-07-28 | 13F | Mutual Advisors, LLC | 18 113 | −6,27 | 482 | 5,71 | ||||
| 2025-08-13 | 13F | MONECO Advisors, LLC | 66 816 | −1,56 | 1 769 | 9,68 | ||||
| 2025-08-14 | 13F | 1607 Capital Partners, LLC | 522 323 | 1,04 | 13 826 | 12,61 | ||||
| 2025-08-01 | 13F | Gwn Securities Inc. | 18 922 | 501 | ||||||
| 2025-08-08 | 13F | Cetera Investment Advisers | 35 381 | 3,95 | 937 | 15,84 | ||||
| 2025-08-12 | 13F | LPL Financial LLC | 524 643 | 11,49 | 13 887 | 24,26 | ||||
| 2025-08-14 | 13F | Raymond James Financial Inc | 394 570 | 3,97 | 10 444 | 15,88 | ||||
| 2025-08-19 | 13F | National Asset Management, Inc. | 0 | −100,00 | 0 | |||||
| 2025-07-15 | 13F | Main Street Group, LTD | 4 318 | 0,00 | 114 | 11,76 | ||||
| 2025-08-12 | 13F | Global Retirement Partners, LLC | 2 290 | 0,00 | 61 | −1,64 | ||||
| 2025-08-14 | 13F | Royal Bank Of Canada | 720 477 | −2,58 | 19 071 | 8,58 | ||||
| 2025-07-28 | 13F | Cornerstone Wealth Group, LLC | 8 453 | 0,00 | 224 | 11,50 | ||||
| 2025-08-01 | 13F | Envestnet Asset Management Inc | 16 430 | −0,04 | 435 | 11,28 | ||||
| 2025-08-12 | 13F | Pathstone Holdings, LLC | 7 790 | −64,59 | 208 | −60,57 | ||||
| 2025-08-13 | 13F | Invesco Ltd. | 823 010 | 1,02 | 21 785 | 12,60 | ||||
| 2025-08-01 | 13F | Motco | 700 | 19 | ||||||
| 2025-08-13 | 13F | Northwestern Mutual Wealth Management Co | 4 766 | 58,08 | 126 | 77,46 | ||||
| 2025-08-14 | 13F | Ionic Capital Management LLC | 69 146 | −6,74 | 1 830 | 3,98 | ||||
| 2025-07-24 | 13F | Cyndeo Wealth Partners, LLC | 13 812 | 0,00 | 366 | 11,28 | ||||
| 2025-08-11 | 13F | Private Advisor Group, LLC | 26 144 | 44,57 | 692 | 61,31 | ||||
| 2025-08-14 | 13F | CoreFirst Bank & Trust | 658 | 17 | ||||||
| 2025-04-21 | 13F | PSI Advisors, LLC | 0 | −100,00 | 0 | |||||
| 2025-08-14 | 13F | Quantedge Capital Pte Ltd | 0 | −100,00 | 0 | |||||
| 2025-08-18 | 13F | Geneos Wealth Management Inc. | 2 521 | 223,21 | 67 | 266,67 | ||||
| 2025-08-07 | 13F | Allworth Financial LP | 5 492 | 0,00 | 145 | 13,28 | ||||
| 2025-08-12 | 13F | Landscape Capital Management, L.l.c. | 0 | −100,00 | 0 | |||||
| 2025-07-15 | 13F | Bay Capital Advisors, LLC | 10 003 | 0,53 | 265 | 11,86 | ||||
| 2025-08-07 | 13F | Hennion & Walsh Asset Management, Inc. | 7 783 | 206 | ||||||
| 2025-08-14 | 13F/A | Rockefeller Capital Management L.P. | 23 566 | 624 | ||||||
| 2025-07-31 | 13F | Cambridge Investment Research Advisors, Inc. | 10 547 | −46,61 | 0 | |||||
| 2025-08-08 | 13F | Hartland & Co., LLC | 1 000 | 0,00 | 26 | 13,04 | ||||
| 2025-08-12 | 13F | Wood Tarver Financial Group, LLC | 172 | 0,00 | 0 | −100,00 | ||||
| 2025-08-14 | 13F | Diversify Advisory Services, LLC | 11 865 | 0,59 | 322 | 15,00 | ||||
| 2025-07-08 | 13F | Next Level Private LLC | 8 055 | 213 | ||||||
| 2025-07-25 | 13F | Atria Wealth Solutions, Inc. | 15 023 | −50,49 | 406 | −44,91 | ||||
| 2025-08-22 | NP | Cornerstone Strategic Value Fund Inc | 441 032 | −31,37 | 11 674 | −23,50 | ||||
| 2025-07-28 | 13F | Axxcess Wealth Management, Llc | 48 531 | −1,14 | 1 285 | 10,21 | ||||
| 2025-07-30 | 13F | Schnieders Capital Management Llc | 48 895 | 6,54 | 1 294 | 18,72 | ||||
| 2025-07-24 | 13F | Eastern Bank | 2 293 | 0,00 | 61 | 11,11 | ||||
| 2025-08-06 | 13F | Wedbush Securities Inc | 14 313 | −27,53 | 0 | |||||
| 2025-08-08 | 13F | Pnc Financial Services Group, Inc. | 26 963 | −45,55 | 714 | −39,37 | ||||
| 2025-08-14 | 13F | Wells Fargo & Company/mn | 1 223 017 | 6,32 | 32 373 | 18,50 | ||||
| 2025-07-16 | 13F | ORG Partners LLC | 2 818 | 66,94 | 74 | 85,00 | ||||
| 2025-08-12 | 13F | Park Square Financial Group, LLC | 82 | 0,00 | 2 | 100,00 | ||||
| 2025-04-15 | 13F | Fifth Third Bancorp | 0 | −100,00 | 0 | |||||
| 2025-07-18 | 13F | Trust Co Of Vermont | 3 349 | 89 | ||||||
| 2025-08-13 | 13F | First Trust Advisors Lp | 34 481 | 2,74 | 913 | 14,43 | ||||
| 2025-08-06 | 13F | Commonwealth Equity Services, Llc | 82 701 | 2,29 | 2 | 100,00 | ||||
| 2025-08-14 | 13F | Toronto Dominion Bank | 0 | −100,00 | 0 | |||||
| 2025-08-11 | 13F | Hexagon Capital Partners LLC | 0 | −100,00 | 0 | |||||
| 2025-05-05 | 13F | Lindbrook Capital, Llc | 15 390 | 20,64 | 366 | 5,80 | ||||
| 2025-08-05 | 13F | Shaker Financial Services, LLC | 0 | −100,00 | 0 | |||||
| 2025-07-25 | 13F | Griffin Asset Management, Inc. | 7 587 | 201 | ||||||
| 2025-07-21 | 13F | Ameritas Advisory Services, LLC | 3 862 | 102 | ||||||
| 2025-08-04 | 13F | Spire Wealth Management | 352 | 0,00 | 9 | 12,50 | ||||
| 2025-08-13 | 13F | Thomas J. Herzfeld Advisors, Inc. | 212 | −99,81 | 6 | −99,81 | ||||
| 2025-05-14 | 13F | Caitlin John, LLC | 0 | −100,00 | 0 | |||||
| 2025-07-16 | 13F | Formidable Asset Management, LLC | 9 200 | 0,00 | 218 | 0,00 | ||||
| 2025-08-27 | NP | RYDEX VARIABLE TRUST - Multi-Hedge Strategies Fund Variable Annuity | 122 | −20,26 | 3 | 0,00 | ||||
| 2025-08-11 | 13F | Blue Bell Private Wealth Management, Llc | 270 | 0,00 | 7 | 16,67 | ||||
| 2025-09-04 | 13F/A | Advisor Group Holdings, Inc. | 186 894 | 5,87 | 4 948 | 18,01 | ||||
| 2025-07-24 | 13F | Stonebridge Financial Group, LLC | 0 | −100,00 | 0 | −100,00 | ||||
| 2025-08-13 | 13F | Walleye Capital LLC | 0 | −100,00 | 0 | |||||
| 2025-08-19 | 13F | Anchor Investment Management, LLC | 200 | 0,00 | 5 | 25,00 | ||||
| 2025-08-14 | 13F | Nan Shan Life Insurance Co., Ltd. | 301 101 | 0,00 | 7 970 | 11,45 | ||||
| 2025-08-12 | 13F | Financial Advocates Investment Management | 0 | −100,00 | 0 | −100,00 | ||||
| 2025-05-07 | 13F | Ramirez Asset Management, Inc. | 0 | −100,00 | 0 | −100,00 | ||||
| 2025-08-12 | 13F | Virtu Financial LLC | 0 | −100,00 | 0 | |||||
| 2025-08-14 | 13F | Atomi Financial Group, Inc. | 7 836 | 207 | ||||||
| 2025-07-28 | NP | PCEF - Invesco CEF Income Composite ETF This fund is a listed as child fund of Invesco Ltd. and if that institution has disclosed ownership in this security, then these positions will not be double counted when calculating total shares and total value | 681 876 | −8,85 | 17 211 | −11,20 | ||||
| 2025-08-11 | 13F | WPG Advisers, LLC | 413 | 339,36 | 11 | 400,00 | ||||
| 2025-08-11 | 13F | Bell Investment Advisors, Inc | 2 219 | 59 | ||||||
| 2025-08-11 | 13F | Alteri Wealth LLC | 19 643 | 0,15 | 520 | 11,61 | ||||
| 2025-08-12 | 13F | Bokf, Na | 658 | 0,00 | 17 | 13,33 | ||||
| 2025-08-19 | 13F | Newbridge Financial Services Group, Inc. | 4 545 | 120 | ||||||
| 2025-07-30 | 13F | FNY Investment Advisers, LLC | 3 800 | 0,00 | 0 | |||||
| 2025-08-14 | 13F | Bank Of America Corp /de/ | 375 491 | −19,48 | 9 939 | −10,26 | ||||
| 2025-08-12 | 13F | Coldstream Capital Management Inc | 0 | −100,00 | 0 | |||||
| 2025-08-13 | 13F | Guggenheim Capital Llc | 412 622 | 17,22 | 10 922 | 30,65 | ||||
| 2025-08-14 | 13F | Mariner, LLC | 13 298 | 19,34 | 352 | 32,95 | ||||
| 2025-08-14 | 13F | UBS Group AG | 736 471 | −9,04 | 19 494 | 1,37 | ||||
| 2025-07-30 | 13F | D.a. Davidson & Co. | 87 851 | 3,46 | 2 325 | 15,33 | ||||
| 2025-07-07 | 13F | Thurston, Springer, Miller, Herd & Titak, Inc. | 20 128 | 19,92 | 533 | 33,67 | ||||
| 2025-07-22 | 13F | DAVENPORT & Co LLC | 17 500 | 0,00 | 463 | 11,57 | ||||
| 2025-08-14 | 13F | Stifel Financial Corp | 10 847 | −1,91 | 287 | 9,54 | ||||
| 2025-08-13 | 13F | Fisher Asset Management, LLC | 0 | −100,00 | 0 | |||||
| 2025-08-11 | 13F | TD Waterhouse Canada Inc. | 2 676 | 0,00 | 70 | 11,11 | ||||
| 2025-08-14 | 13F | MGB Wealth Management, LLC | 11 000 | −50,00 | 291 | −47,85 | ||||
| 2025-08-05 | 13F | Key FInancial Inc | 1 104 | 0,00 | 29 | 11,54 | ||||
| 2025-07-15 | 13F | Mather Group, Llc. | 0 | −100,00 | 0 | −100,00 | ||||
| 2025-08-15 | 13F | Kestra Advisory Services, LLC | 0 | −100,00 | 0 | |||||
| 2025-08-14 | 13F | Sunbelt Securities, Inc. | 1 834 | 0,00 | 50 | 13,95 | ||||
| 2025-07-28 | 13F | Harbour Investments, Inc. | 1 820 | 68,52 | 48 | 92,00 | ||||
| 2025-07-25 | 13F | Cwm, Llc | 6 901 | 0,00 | 0 | |||||
| 2025-07-22 | 13F | Merit Financial Group, LLC | 11 135 | 4,93 | 295 | 16,67 | ||||
| 2025-07-25 | 13F | Allspring Global Investments Holdings, LLC | 503 646 | 20,40 | 13 332 | 34,18 | ||||
| 2025-07-29 | 13F | Private Trust Co Na | 1 500 | 0,00 | 40 | 11,43 | ||||
| 2025-08-04 | 13F | Arkadios Wealth Advisors | 26 289 | 0,00 | 696 | 11,38 | ||||
| 2025-08-22 | NP | Cornerstone Total Return Fund Inc | 126 191 | −55,10 | 3 340 | −49,96 | ||||
| 2025-08-11 | 13F | Principal Securities, Inc. | 300 | 0,00 | 8 | −12,50 | ||||
| 2025-08-08 | 13F | Emerald Investment Partners, Llc | 8 263 | −6,02 | 219 | 2,35 | ||||
| 2025-08-20 | NP | ADANX - AQR Diversified Arbitrage Fund Class N | 44 626 | −26,18 | 1 181 | −17,70 | ||||
| 2025-08-12 | 13F | J.w. Cole Advisors, Inc. | 12 344 | 1,45 | 327 | 13,19 | ||||
| 2025-04-28 | NP | CEFS - Saba Closed-End Funds ETF | 0 | −100,00 | 0 | −100,00 | ||||
| 2025-08-14 | 13F | Cnh Partners Llc | 116 834 | −45,09 | 3 058 | −38,05 |