Grundläggande statistik
| Institutionella ägare | 153 total, 153 long only, 0 short only, 0 long/short - change of 0,66% MRQ |
| Genomsnittlig portföljallokering | 0.0671 % - change of 3,63% MRQ |
| Institutionella aktier (lång) | 5 440 618 (ex 13D/G) - change of −0,25MM shares −4,36% MRQ |
| Institutionellt värde (lång) | $ 157 334 USD ($1000) |
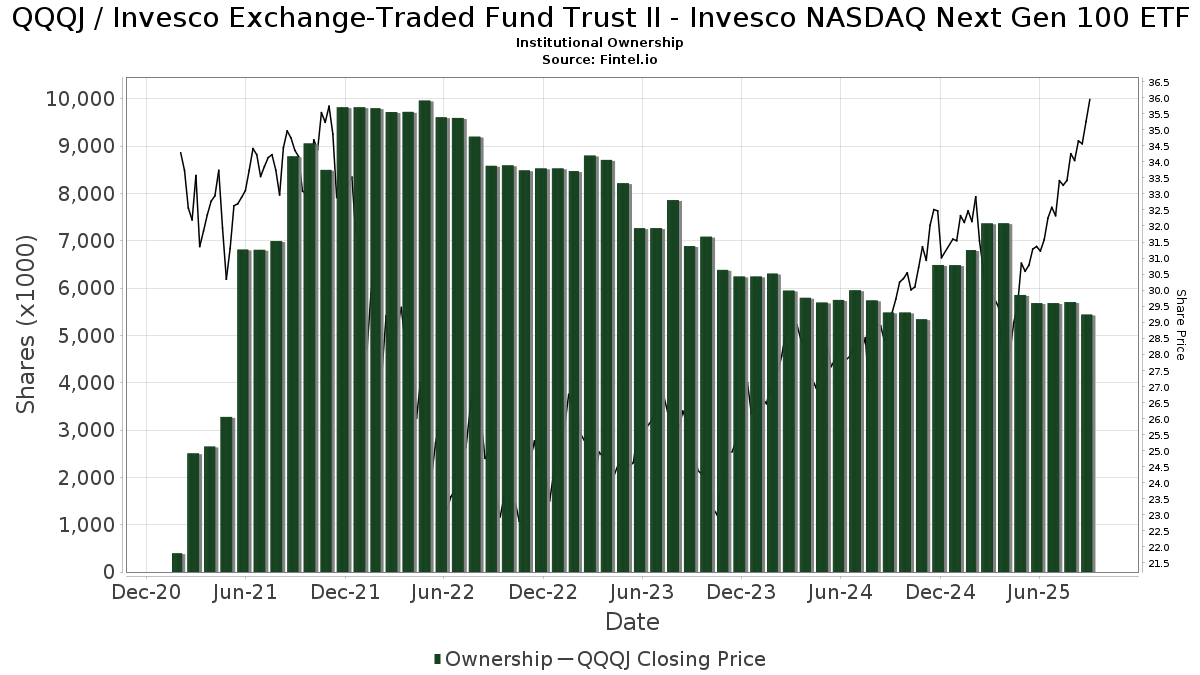
Institutionellt ägande och aktieägare
Invesco Exchange-Traded Fund Trust II - Invesco NASDAQ Next Gen 100 ETF (US:QQQJ) har 153 Institutionella ägare och aktieägare som har lämnat in 13D/G- eller 13F-formulär till Securities Exchange Commission (SEC). Dessa institut innehar totalt 5,440,618 aktier. Största aktieägare inkluderar Raymond James Financial Inc, LRI Investments, LLC, LPL Financial LLC, Morgan Stanley, Erickson Financial Group, LLC, Jones Financial Companies Lllp, Bank Of America Corp /de/, Gerber Kawasaki Wealth & Investment Management, Royal Bank Of Canada, and Wealthcare Advisory Partners LLC .
Invesco Exchange-Traded Fund Trust II - Invesco NASDAQ Next Gen 100 ETF (NasdaqGM:QQQJ) Institutionell ägarstruktur visar institutioners och fonders nuvarande positioner i företaget, samt de senaste förändringarna i positionernas storlek. Större aktieägare kan vara enskilda investerare, fonder, hedgefonder eller institutioner. Bilaga 13D visar att investeraren äger (eller ägde) mer än 5% av företaget och avser (eller avsåg) att aktivt eftersträva en förändring av affärsstrategin. Schedule 13G indikerar en passiv investering på över 5%.
The share price as of September 22, 2025 is 36,33 / share. Previously, on September 23, 2024, the share price was 29,63 / share. This represents an increase of 22,61% over that period.
Fondsentimentets poäng
Fondsentimentet poängen(fka Ägarackumulation-poäng) visar vilka aktier som är mest köpta av fonder. Det är resultatet av en sofistikerad kvantitativ flerfaktormodell som identifierar företag med de högsta nivåerna av institutionell ackumulering. Poängsättningsmodellen använder en kombination av den totala ökningen av redovisade ägare, förändringarna i portföljallokeringarna för dessa ägare och andra mått. Siffran sträcker sig från 0 till 100, där högre siffror indikerar en högre nivå av ackumulering i förhållande till sina konkurrenter, och 50 är genomsnittet.
Uppdateringsfrekvens: Dagligen
Se Ownership Explorer, som innehåller en lista över de högst rankade företagen.
AI+ Ask Fintel’s AI assistant about Invesco Exchange-Traded Fund Trust II - Invesco NASDAQ Next Gen 100 ETF.
Thinking of good questions…
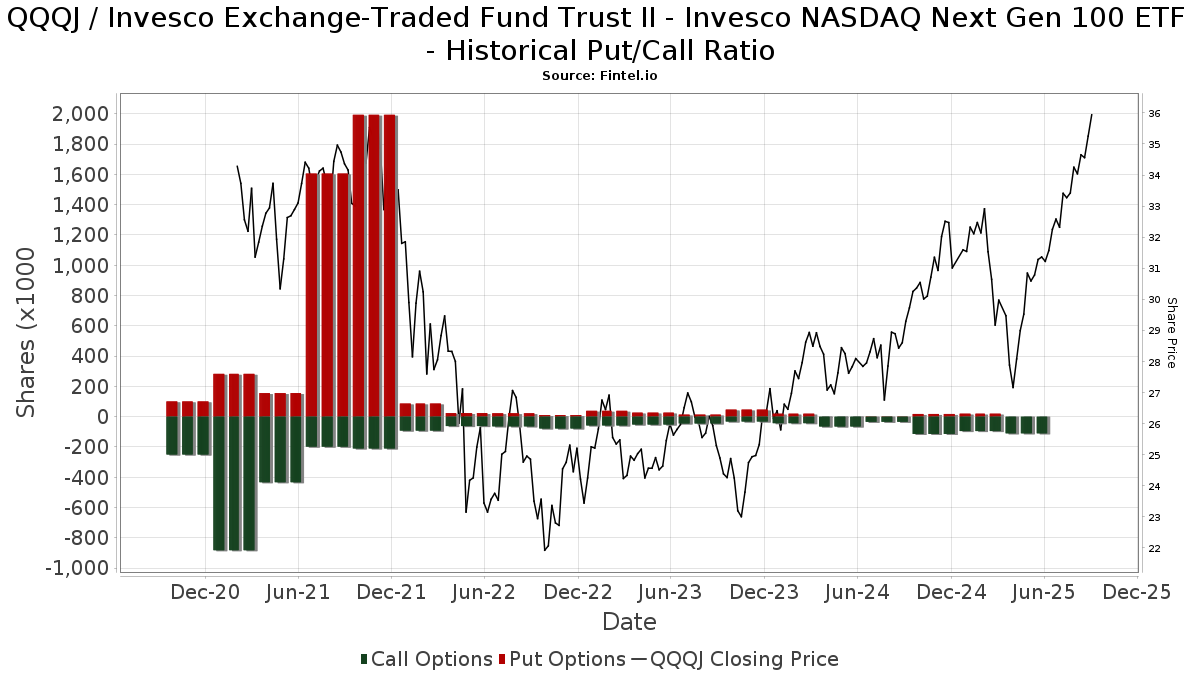
Institutionell sälj/köp-kvot
Förutom att rapportera vanliga eget kapital- och skuldemissioner måste institutioner med mer än 100MM tillgångar under förvaltning också avslöja sina innehav av sälj- och köpoptioner. Eftersom säljoptioner i allmänhet indikerar ett negativt sentiment och köpoptioner indikerar ett positivt sentiment, kan vi få en uppfattning om det övergripande institutionella sentimentet genom att plotta förhållandet mellan säljoptioner och köpoptioner. Diagrammet till höger visar det historiska förhållandet mellan sälj- och köpoptioner för detta instrument.
Genom att använda sälj/köp-kvoten som en indikator på aktieägarnas sentiment undviker man en av de största bristerna med att använda det totala institutionella ägandet, nämligen att en betydande del av de förvaltade tillgångarna investeras passivt för att följa index. Passivt förvaltade fonder köper vanligtvis inte optioner, så indikatorn för sälj/köp-kvoten ger en bättre bild av stämningen i aktivt förvaltade fonder.
13F- och NPORT-arkiveringar
Detaljer om 13F-arkiveringar är gratis. Detaljer om NP-arkiveringar kräver ett premiummedlemskap. Gröna rader indikerar nya positioner. Röda rader indikerar stängda positioner. Klicka på länk symbolen för att se hela transaktionshistoriken.
Uppgradera
för att låsa upp premiumdata och exportera till Excel ![]() .
.
| Fil Datum | Källa | Investerare | Typ | Genomsnittligt pris (beräknat) |
Aktier | Δ Aktier (%) |
Rapporterat värde (1000 USD) |
Δ Värde (%) |
Portföljallokering (%) |
|
|---|---|---|---|---|---|---|---|---|---|---|
| 2025-07-23 | 13F | Gerber, Llc | 45 356 | 73,63 | 1 450 | 91,55 | ||||
| 2025-08-14 | 13F | Goldman Sachs Group Inc | 69 488 | −39,38 | 2 222 | −33,17 | ||||
| 2025-08-14 | 13F | Sunbelt Securities, Inc. | 1 086 | 22,44 | 34 | 32,00 | ||||
| 2025-08-14 | 13F | IHT Wealth Management, LLC | 21 289 | −0,84 | 681 | 9,32 | ||||
| 2025-08-13 | 13F | Continuum Advisory, LLC | 0 | −100,00 | 0 | |||||
| 2025-08-12 | 13F | Edmond De Rothschild Holding S.a. | 250 | 0,00 | 8 | 0,00 | ||||
| 2025-07-08 | 13F/A | Salem Investment Counselors Inc | 129 | 4 | ||||||
| 2025-07-16 | 13F | Spirepoint Private Client, Llc | 24 101 | −1,19 | 771 | 8,91 | ||||
| 2025-07-16 | 13F/A | CX Institutional | 234 | 0,00 | 0 | |||||
| 2025-07-25 | 13F | Cwm, Llc | 95 | −97,25 | 0 | |||||
| 2025-04-25 | 13F | New Wave Wealth Advisors Llc | 0 | −100,00 | 0 | |||||
| 2025-08-14 | 13F | Wiley Bros.-aintree Capital, Llc | 11 677 | −18,21 | 373 | −10,34 | ||||
| 2025-08-13 | 13F | Truvestments Capital Llc | 700 | 0,00 | 22 | 10,00 | ||||
| 2025-05-15 | 13F | Wick Capital Partners, LLC | 0 | −100,00 | 0 | −100,00 | ||||
| 2025-08-14 | 13F | CoreCap Advisors, LLC | 0 | −100,00 | 0 | |||||
| 2025-08-15 | 13F | Tower Research Capital LLC (TRC) | 21 015 | 50,67 | 672 | 66,34 | ||||
| 2025-07-22 | 13F | Clarius Group, LLC | 20 601 | 0,00 | 659 | 10,22 | ||||
| 2025-07-29 | 13F | Angeles Wealth Management, Llc | 103 | 3 | ||||||
| 2025-05-12 | 13F | Simplex Trading, Llc | 0 | −100,00 | 0 | |||||
| 2025-08-14 | 13F | Qube Research & Technologies Ltd | 154 | 0,00 | 5 | 0,00 | ||||
| 2025-07-25 | 13F | NorthRock Partners, LLC | 2 484 | 8,80 | 79 | 19,70 | ||||
| 2025-04-23 | 13F | Financial Life Planners | 0 | −100,00 | 0 | |||||
| 2025-07-24 | 13F | McKinley Carter Wealth Services, Inc. | 31 086 | −1,26 | 994 | 8,87 | ||||
| 2025-08-07 | 13F | Resources Investment Advisors, LLC. | 0 | −100,00 | 0 | |||||
| 2025-08-08 | 13F | Smithfield Trust Co | 685 | 0,00 | 0 | |||||
| 2025-04-01 | 13F | Modus Advisors, LLC | 0 | −100,00 | 0 | −100,00 | ||||
| 2025-08-11 | 13F | TD Waterhouse Canada Inc. | 14 194 | −1,83 | 454 | 8,10 | ||||
| 2025-08-11 | 13F | Greykasell Wealth Strategies, Inc. | 0 | −100,00 | 0 | |||||
| 2025-05-02 | 13F | Signaturefd, Llc | 0 | −100,00 | 0 | |||||
| 2025-08-11 | 13F | Rothschild Investment Llc | 600 | 20,00 | 19 | 35,71 | ||||
| 2025-08-14 | 13F | Citadel Advisors Llc | Call | 10 400 | 300,00 | 333 | 342,67 | |||
| 2025-08-14 | 13F | Citadel Advisors Llc | 9 619 | −96,06 | 308 | −95,66 | ||||
| 2025-08-14 | 13F | Federation des caisses Desjardins du Quebec | 611 | 0,00 | 20 | 11,76 | ||||
| 2025-08-14 | 13F | Raymond James Financial Inc | 1 138 394 | −3,94 | 36 406 | 5,89 | ||||
| 2025-07-25 | 13F | Ellis Investment Partners, LLC | 8 754 | −3,06 | 280 | 6,90 | ||||
| 2025-08-18 | 13F | Goodman Advisory Group, LLC | 0 | −100,00 | 0 | |||||
| 2025-07-16 | 13F | St Germain D J Co Inc | 103 | 3 | ||||||
| 2025-08-04 | 13F | Flagship Harbor Advisors, Llc | 6 387 | 204 | ||||||
| 2025-08-08 | 13F | Capital Investment Advisory Services, LLC | 9 324 | −2,59 | 298 | 7,58 | ||||
| 2025-05-19 | 13F/A | Jane Street Group, Llc | 0 | −100,00 | 0 | −100,00 | ||||
| 2025-07-24 | 13F | Jfs Wealth Advisors, Llc | 3 741 | 0,03 | 120 | 10,19 | ||||
| 2025-08-13 | 13F | Cresset Asset Management, LLC | 19 496 | 0,26 | 623 | 10,46 | ||||
| 2025-07-23 | 13F | Steel Peak Wealth Management LLC | 82 955 | −7,21 | 2 653 | 2,28 | ||||
| 2025-07-10 | 13F | Wealth Enhancement Advisory Services, Llc | 23 015 | −11,14 | 748 | −0,53 | ||||
| 2025-05-12 | 13F | Sandy Spring Bank | 305 | 0,00 | 9 | −11,11 | ||||
| 2025-08-11 | 13F | Aptus Capital Advisors, LLC | 584 | 0,00 | 19 | 12,50 | ||||
| 2025-07-08 | 13F | RMR Wealth Builders | 16 985 | −8,83 | 543 | 0,56 | ||||
| 2025-07-18 | 13F | Truist Financial Corp | 7 038 | 225 | ||||||
| 2025-08-14 | 13F | Mml Investors Services, Llc | 17 425 | 3,01 | 1 | |||||
| 2025-07-25 | 13F | LRI Investments, LLC | 562 679 | 0,00 | 563 | 0,00 | ||||
| 2025-07-21 | 13F | Ameritas Advisory Services, LLC | 3 832 | 123 | ||||||
| 2025-07-28 | 13F | Harbour Investments, Inc. | 1 736 | 0,06 | 56 | 10,00 | ||||
| 2025-08-06 | 13F | Texas Yale Capital Corp. | 39 090 | 4,41 | 1 250 | 15,10 | ||||
| 2025-07-31 | 13F | Brinker Capital Investments, LLC | 0 | −100,00 | 0 | −100,00 | ||||
| 2025-09-04 | 13F/A | Advisor Group Holdings, Inc. | 31 738 | −12,76 | 1 015 | −3,79 | ||||
| 2025-08-06 | 13F | Commonwealth Equity Services, Llc | 55 650 | 26,75 | 2 | 0,00 | ||||
| 2025-07-31 | 13F | Gill Capital Partners, Llc | 7 643 | −4,26 | 244 | 5,63 | ||||
| 2025-08-08 | 13F | Creative Planning | 13 498 | 0,75 | 432 | 11,08 | ||||
| 2025-07-31 | 13F | Oppenheimer & Co Inc | 9 447 | 302 | ||||||
| 2025-07-08 | 13F | Goldstone Financial Group, LLC | 22 760 | 20,88 | 739 | 35,35 | ||||
| 2025-08-14 | 13F | Royal Bank Of Canada | 155 429 | 31,54 | 4 970 | 44,98 | ||||
| 2025-08-08 | 13F | TD Capital Management LLC | 3 126 | 0,29 | 100 | 10,00 | ||||
| 2025-07-22 | 13F | Wealthcare Advisory Partners LLC | 151 578 | 12,56 | 4 847 | 24,09 | ||||
| 2025-07-11 | 13F | Farther Finance Advisors, LLC | 309 | 100,65 | 10 | 125,00 | ||||
| 2025-08-12 | 13F | AlphaCore Capital LLC | 300 | 10 | ||||||
| 2025-07-21 | 13F | Mirae Asset Global Investments Co., Ltd. | 28 059 | 0,00 | 897 | 9,66 | ||||
| 2025-07-17 | 13F | Investment Research & Advisory Group, Inc. | 1 212 | 0,25 | 39 | 8,57 | ||||
| 2025-08-06 | 13F | Nvwm, Llc | 135 | −35,10 | 4 | −33,33 | ||||
| 2025-08-12 | 13F | Global Retirement Partners, LLC | 5 121 | 92,30 | 164 | 98,78 | ||||
| 2025-08-14 | 13F | GWM Advisors LLC | 21 133 | −9,05 | 676 | 0,15 | ||||
| 2025-08-14 | 13F | Susquehanna International Group, Llp | 24 640 | −35,59 | 788 | −29,04 | ||||
| 2025-08-12 | 13F | Cornerstone Wealth Management, LLC | 30 049 | 5,15 | 961 | 15,94 | ||||
| 2025-08-14 | 13F | Susquehanna International Group, Llp | Call | 92 400 | 974,42 | 2 955 | 1 086,35 | |||
| 2025-08-12 | 13F | Retirement Planning Co of New England, Inc. | 8 672 | −1,14 | 277 | 9,06 | ||||
| 2025-08-06 | 13F | AE Wealth Management LLC | 905 | 0,00 | 29 | 7,69 | ||||
| 2025-07-09 | 13F | WealthCare Investment Partners, LLC | 21 570 | −9,18 | 701 | 10,06 | ||||
| 2025-07-31 | 13F | Wealthfront Advisers Llc | 66 023 | −2,96 | 2 111 | 6,99 | ||||
| 2025-08-07 | 13F | Allworth Financial LP | 300 | 200,00 | 10 | 350,00 | ||||
| 2025-07-08 | 13F | Granite Bay Wealth Management, LLC | 0 | −100,00 | 0 | |||||
| 2025-08-20 | 13F/A | Coppell Advisory Solutions LLC | 9 877 | 5 413 | ||||||
| 2025-04-23 | 13F | Mascagni Wealth Management, Inc. | 0 | −100,00 | 0 | −100,00 | ||||
| 2025-08-08 | 13F | Rockefeller Capital Management L.P. | 0 | −100,00 | 0 | |||||
| 2025-04-09 | 13F | Signature Securities Group Corporation | 0 | −100,00 | 0 | |||||
| 2025-07-21 | 13F | Crews Bank & Trust | 240 | 17,07 | 8 | 40,00 | ||||
| 2025-07-24 | 13F | IFP Advisors, Inc | 51 | 0,00 | 2 | 0,00 | ||||
| 2025-08-07 | 13F | Hughes Financial Services, LLC | 4 | 0,00 | 0 | |||||
| 2025-07-31 | 13F | Optimum Investment Advisors | 50 | 0,00 | 2 | 0,00 | ||||
| 2025-07-31 | 13F | Topsail Wealth Management, LLC | 3 205 | 6,66 | 102 | 17,24 | ||||
| 2025-08-12 | 13F | Jpmorgan Chase & Co | 6 407 | 11,02 | 205 | 22,16 | ||||
| 2025-08-13 | 13F | Capital Analysts, Inc. | 200 | 0,00 | 0 | |||||
| 2025-08-14 | 13F | Cardiff Park Advisors, Llc | 100 | 3 | ||||||
| 2025-08-14 | 13F | Susquehanna International Group, Llp | Put | 0 | −100,00 | 0 | ||||
| 2025-08-05 | 13F | Mountain Hill Investment Partners Corp. | 52 | 0,00 | 2 | 0,00 | ||||
| 2025-08-07 | 13F | Winch Advisory Services, LLC | 979 | 0,31 | 31 | 10,71 | ||||
| 2025-08-12 | 13F | Steward Partners Investment Advisory, Llc | 13 367 | 1,52 | 427 | 12,07 | ||||
| 2025-08-06 | 13F | Legacy Wealth Managment, LLC/ID | 58 | 0,00 | 2 | 0,00 | ||||
| 2025-08-29 | 13F | Centaurus Financial, Inc. | 6 622 | −0,03 | 0 | |||||
| 2025-08-19 | 13F | Cape Investment Advisory, Inc. | 100 | 0,00 | 3 | 50,00 | ||||
| 2025-07-30 | 13F | Brookstone Capital Management | 33 573 | 13,25 | 1 074 | 24,77 | ||||
| 2025-08-18 | 13F | Pacific Center for Financial Services | 377 | 0,27 | 12 | 20,00 | ||||
| 2025-08-06 | 13F | Legacy Investment Solutions, LLC | 58 | −78,83 | 2 | −87,50 | ||||
| 2025-05-07 | 13F | Prosperity Consulting Group, LLC | 0 | −100,00 | 0 | |||||
| 2025-07-16 | 13F | Essex Financial Services, Inc. | 79 775 | −4,05 | 2 551 | 5,76 | ||||
| 2025-08-15 | 13F | Kestra Advisory Services, LLC | 13 698 | 98,61 | 438 | 119,00 | ||||
| 2025-05-07 | 13F | Trilogy Capital Inc. | 0 | −100,00 | 0 | |||||
| 2025-08-12 | 13F | MAI Capital Management | 1 369 | −16,78 | 44 | −8,51 | ||||
| 2025-08-14 | 13F | Mariner, LLC | 31 489 | −3,60 | 1 007 | 6,23 | ||||
| 2025-04-17 | 13F | Copia Wealth Management | 0 | −100,00 | 0 | |||||
| 2025-08-04 | 13F | Arkadios Wealth Advisors | 19 151 | 612 | ||||||
| 2025-07-22 | 13F | Apexium Financial, Lp | 22 490 | −4,92 | 719 | 4,81 | ||||
| 2025-07-29 | 13F | Stratos Wealth Partners, LTD. | 7 408 | 237 | ||||||
| 2025-08-13 | 13F | Northwestern Mutual Wealth Management Co | 14 458 | 32,25 | 462 | 45,74 | ||||
| 2025-08-11 | 13F | Strategic Wealth Partners, Ltd. | 100 | 3 | ||||||
| 2025-08-14 | 13F | Citadel Advisors Llc | Put | 0 | −100,00 | 0 | ||||
| 2025-07-21 | 13F | Ameriflex Group, Inc. | 0 | −100,00 | 0 | |||||
| 2025-08-08 | 13F | Gts Securities Llc | 20 700 | 662 | ||||||
| 2025-07-16 | 13F | Novem Group | 65 200 | 0,00 | 2 085 | 10,26 | ||||
| 2025-08-08 | 13F | WASHINGTON TRUST Co | 7 907 | 690,70 | 253 | 768,97 | ||||
| 2025-07-25 | 13F | Stephens Consulting, LLC | 528 | 0,00 | 17 | 6,67 | ||||
| 2025-08-13 | 13F | EverSource Wealth Advisors, LLC | 161 | 0,62 | 5 | 25,00 | ||||
| 2025-07-08 | 13F | Parallel Advisors, LLC | 641 | 3,89 | 20 | 17,65 | ||||
| 2025-08-08 | 13F | Avantax Advisory Services, Inc. | 63 581 | −11,81 | 2 033 | −2,77 | ||||
| 2025-08-14 | 13F | Bank Of America Corp /de/ | 176 018 | −4,41 | 5 629 | 5,37 | ||||
| 2025-08-14 | 13F | Mercer Global Advisors Inc /adv | 13 251 | 20,02 | 424 | 32,19 | ||||
| 2025-08-08 | 13F | Pnc Financial Services Group, Inc. | 280 | 0,00 | 9 | 0,00 | ||||
| 2025-08-13 | 13F | Lido Advisors, LLC | 0 | −100,00 | 0 | |||||
| 2025-08-13 | 13F | Proactive Wealth Strategies LLC | 14 149 | 2,74 | 0 | |||||
| 2025-05-01 | 13F | Quest 10 Wealth Builders, Inc. | 70 | −50,00 | 2 | −50,00 | ||||
| 2025-08-05 | 13F | GPS Wealth Strategies Group, LLC | 979 | 1,77 | 31 | 14,81 | ||||
| 2025-08-05 | 13F | Bank Of Montreal /can/ | 1 | 0,00 | 0 | |||||
| 2025-05-15 | 13F | Finward Bancorp | 0 | −100,00 | 0 | |||||
| 2025-08-13 | 13F | Jones Financial Companies Lllp | 191 738 | 33,80 | 6 101 | 46,03 | ||||
| 2025-08-12 | 13F | LPL Financial LLC | 393 257 | 6,05 | 12 576 | 16,91 | ||||
| 2025-08-12 | 13F | CIBC Private Wealth Group, LLC | 9 032 | 0,00 | 289 | 25,22 | ||||
| 2025-07-21 | 13F | DHJJ Financial Advisors, Ltd. | 14 | 0,00 | 0 | |||||
| 2025-08-18 | 13F | Geneos Wealth Management Inc. | 1 359 | 0,00 | 43 | 10,26 | ||||
| 2025-08-11 | 13F | Principal Securities, Inc. | 4 095 | 3 256,56 | 131 | 4 233,33 | ||||
| 2025-07-11 | 13F | Congress Park Capital LLC | 0 | −100,00 | 0 | |||||
| 2025-07-14 | 13F | AdvisorNet Financial, Inc | 213 | 0,00 | 7 | 0,00 | ||||
| 2025-07-31 | 13F | Cambridge Investment Research Advisors, Inc. | 17 732 | −17,13 | 1 | |||||
| 2025-07-31 | 13F | Sage Mountain Advisors LLC | 0 | −100,00 | 0 | |||||
| 2025-08-14 | 13F | Jane Street Group, Llc | Call | 7 400 | −91,26 | 237 | −90,39 | |||
| 2025-08-14 | 13F | Ameriprise Financial Inc | 73 703 | −5,06 | 2 357 | 4,66 | ||||
| 2025-08-12 | 13F | Mystic Asset Management, Inc. | 14 315 | 0,00 | 458 | 10,12 | ||||
| 2025-08-14 | 13F | Wells Fargo & Company/mn | 149 801 | −10,28 | 4 791 | −1,09 | ||||
| 2025-08-05 | 13F | Key FInancial Inc | 335 | 0,00 | 11 | 11,11 | ||||
| 2025-08-14 | 13F | Gerber Kawasaki Wealth & Investment Management | 167 258 | 0,39 | 5 349 | 10,66 | ||||
| 2025-08-08 | 13F | SBI Securities Co., Ltd. | 5 298 | −1,29 | 169 | 9,03 | ||||
| 2025-07-31 | 13F | Jackson Hole Capital Partners, LLC | 525 | 0,00 | 17 | 6,67 | ||||
| 2025-08-12 | 13F | Proequities, Inc. | 0 | 0 | ||||||
| 2025-08-14 | 13F | UBS Group AG | 32 424 | −22,05 | 1 037 | −14,10 | ||||
| 2025-08-04 | 13F | Roble, Belko & Company, Inc | 2 070 | −2,31 | 0 | |||||
| 2025-07-23 | 13F | Columbus Macro, LLC | 7 678 | 246 | ||||||
| 2025-07-17 | 13F | DiNuzzo Private Wealth, Inc. | 175 | 0,00 | 6 | 0,00 | ||||
| 2025-08-13 | 13F | Invesco Ltd. | 54 812 | 0,55 | 1 753 | 10,82 | ||||
| 2025-08-11 | 13F | FSA Wealth Management LLC | 605 | −0,66 | 19 | 11,76 | ||||
| 2025-08-19 | 13F | Newbridge Financial Services Group, Inc. | 200 | 0,00 | 6 | 20,00 | ||||
| 2025-08-05 | 13F | Fourth Dimension Wealth, LLC | 500 | 0,00 | 16 | 7,14 | ||||
| 2025-08-13 | 13F | Baird Financial Group, Inc. | 16 589 | 7,11 | 531 | 18,04 | ||||
| 2025-08-11 | 13F | HHM Wealth Advisors, LLC | 309 | 0,00 | 10 | 12,50 | ||||
| 2025-08-15 | 13F | Morgan Stanley | 259 551 | −12,76 | 8 300 | −3,82 | ||||
| 2025-08-11 | 13F | HighTower Advisors, LLC | 6 472 | −8,69 | 207 | 0,49 | ||||
| 2025-05-20 | 13F | Integrity Alliance, Llc. | 0 | −100,00 | 0 | |||||
| 2025-08-08 | 13F | Cetera Investment Advisers | 23 587 | 8,46 | 754 | 19,68 | ||||
| 2025-08-01 | 13F | Envestnet Asset Management Inc | 24 161 | −22,00 | 773 | −14,03 | ||||
| 2025-08-05 | 13F | Pointe Capital Management LLC | 10 415 | 0,04 | 333 | 10,26 | ||||
| 2025-07-31 | 13F | CVA Family Office, LLC | 20 | 0,00 | 1 | |||||
| 2025-07-09 | 13F | Massmutual Trust Co Fsb/adv | 400 | −19,52 | 13 | −14,29 | ||||
| 2025-08-06 | 13F | Atlantic Union Bankshares Corp | 305 | 10 | ||||||
| 2025-08-11 | 13F/A | Purus Wealth Management, LLC | 116 047 | 25,69 | 3 711 | 38,57 | ||||
| 2025-08-14 | 13F | Ancora Advisors, LLC | 6 444 | 8,41 | 206 | 19,77 | ||||
| 2025-08-18 | 13F | N.E.W. Advisory Services LLC | 0 | −100,00 | 0 | |||||
| 2025-08-12 | 13F | Tradition Wealth Management, LLC | 52 741 | −1,32 | 1 687 | 8,77 | ||||
| 2025-08-12 | 13F | Erickson Financial Group, LLC | 214 304 | −10,71 | 6 853 | −1,57 | ||||
| 2025-08-14 | 13F | Fmr Llc | 357 | −95,17 | 11 | −94,86 | ||||
| 2025-08-11 | 13F | Private Advisor Group, LLC | 11 215 | −8,76 | 359 | 0,56 | ||||
| 2025-08-06 | 13F | Wedbush Securities Inc | 18 030 | −10,86 | 1 | |||||
| 2025-08-14 | 13F | Guardian Wealth Advisors, Llc / Nc | 481 | 0,00 | 15 | 15,38 | ||||
| 2025-08-15 | 13F | Equitable Holdings, Inc. | 33 079 | −4,67 | 1 058 | 5,07 | ||||
| 2025-08-14 | 13F | Colony Group, LLC | 10 179 | −8,45 | 326 | 0,93 | ||||
| 2025-07-24 | 13F | Us Bancorp \de\ | 0 | −100,00 | 0 | |||||
| 2025-07-14 | 13F | GAMMA Investing LLC | 401 | 13 | ||||||
| 2025-08-11 | 13F | Anderson Financial Strategies, LLC | 0 | −100,00 | 0 | |||||
| 2025-07-11 | 13F | Pinnacle Bancorp, Inc. | 200 | 0,00 | 6 | 20,00 | ||||
| 2025-08-18 | 13F | Hollencrest Capital Management | 138 | 0,00 | 4 | 0,00 | ||||
| 2025-05-14 | 13F | CIBC World Markets Inc. | 0 | −100,00 | 0 | |||||
| 2025-08-18 | 13F/A | National Bank Of Canada /fi/ | 2 388 | 16,20 | 76 | 28,81 | ||||
| 2025-07-17 | 13F | Jackson, Grant Investment Advisers, Inc. | 245 | 0,00 | 8 | 0,00 |