Grundläggande statistik
| Institutionella ägare | 169 total, 169 long only, 0 short only, 0 long/short - change of 20,42% MRQ |
| Genomsnittlig portföljallokering | 0.6696 % - change of 11,22% MRQ |
| Institutionella aktier (lång) | 13 348 586 (ex 13D/G) - change of 3,00MM shares 28,97% MRQ |
| Institutionellt värde (lång) | $ 1 414 069 USD ($1000) |
Institutionellt ägande och aktieägare
American Century ETF Trust - American Century U.S. Quality Growth ETF (US:QGRO) har 169 Institutionella ägare och aktieägare som har lämnat in 13D/G- eller 13F-formulär till Securities Exchange Commission (SEC). Dessa institut innehar totalt 13,348,586 aktier. Största aktieägare inkluderar LPL Financial LLC, Mainstay Capital Management Llc /adv, Great Valley Advisor Group, Inc., American Century Companies Inc, Raymond James Financial Inc, Envestnet Asset Management Inc, Larson Financial Group LLC, Bank Of America Corp /de/, Advisor Group Holdings, Inc., and AAARX - Strategic Allocation: Aggressive Fund R Class .
American Century ETF Trust - American Century U.S. Quality Growth ETF (ARCA:QGRO) Institutionell ägarstruktur visar institutioners och fonders nuvarande positioner i företaget, samt de senaste förändringarna i positionernas storlek. Större aktieägare kan vara enskilda investerare, fonder, hedgefonder eller institutioner. Bilaga 13D visar att investeraren äger (eller ägde) mer än 5% av företaget och avser (eller avsåg) att aktivt eftersträva en förändring av affärsstrategin. Schedule 13G indikerar en passiv investering på över 5%.
The share price as of September 12, 2025 is 113,23 / share. Previously, on September 12, 2024, the share price was 87,62 / share. This represents an increase of 29,23% over that period.

Fondsentimentets poäng
Fondsentimentet poängen(fka Ägarackumulation-poäng) visar vilka aktier som är mest köpta av fonder. Det är resultatet av en sofistikerad kvantitativ flerfaktormodell som identifierar företag med de högsta nivåerna av institutionell ackumulering. Poängsättningsmodellen använder en kombination av den totala ökningen av redovisade ägare, förändringarna i portföljallokeringarna för dessa ägare och andra mått. Siffran sträcker sig från 0 till 100, där högre siffror indikerar en högre nivå av ackumulering i förhållande till sina konkurrenter, och 50 är genomsnittet.
Uppdateringsfrekvens: Dagligen
Se Ownership Explorer, som innehåller en lista över de högst rankade företagen.
Institutionell sälj/köp-kvot
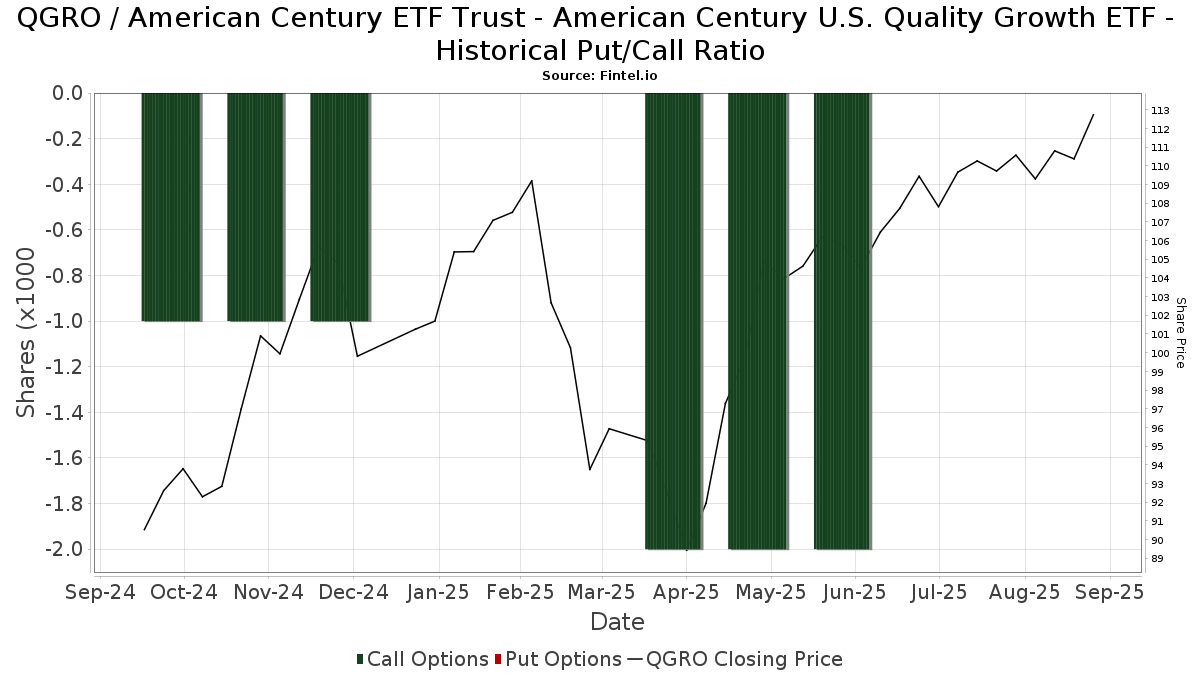
Förutom att rapportera vanliga eget kapital- och skuldemissioner måste institutioner med mer än 100MM tillgångar under förvaltning också avslöja sina innehav av sälj- och köpoptioner. Eftersom säljoptioner i allmänhet indikerar ett negativt sentiment och köpoptioner indikerar ett positivt sentiment, kan vi få en uppfattning om det övergripande institutionella sentimentet genom att plotta förhållandet mellan säljoptioner och köpoptioner. Diagrammet till höger visar det historiska förhållandet mellan sälj- och köpoptioner för detta instrument.
Genom att använda sälj/köp-kvoten som en indikator på aktieägarnas sentiment undviker man en av de största bristerna med att använda det totala institutionella ägandet, nämligen att en betydande del av de förvaltade tillgångarna investeras passivt för att följa index. Passivt förvaltade fonder köper vanligtvis inte optioner, så indikatorn för sälj/köp-kvoten ger en bättre bild av stämningen i aktivt förvaltade fonder.
13F- och NPORT-arkiveringar
Detaljer om 13F-arkiveringar är gratis. Detaljer om NP-arkiveringar kräver ett premiummedlemskap. Gröna rader indikerar nya positioner. Röda rader indikerar stängda positioner. Klicka på länk symbolen för att se hela transaktionshistoriken.
Uppgradera
för att låsa upp premiumdata och exportera till Excel ![]() .
.
| Fil Datum | Källa | Investerare | Typ | Genomsnittligt pris (beräknat) |
Aktier | Δ Aktier (%) |
Rapporterat värde (1000 USD) |
Δ Värde (%) |
Portföljallokering (%) |
|
|---|---|---|---|---|---|---|---|---|---|---|
| 2025-08-04 | 13F | Savvy Advisors, Inc. | 2 119 | −2,17 | 231 | 14,36 | ||||
| 2025-08-05 | 13F | Huntington National Bank | 73 | |||||||
| 2025-08-07 | 13F | Weil Company, Inc. | 40 905 | 4 464 | ||||||
| 2025-08-11 | 13F | Tidemark, LLC | 0 | −100,00 | 0 | |||||
| 2025-08-12 | 13F | O'shaughnessy Asset Management, Llc | 1 | 0 | ||||||
| 2025-07-17 | 13F/A | Capital Investment Advisors, LLC | 69 436 | 65,36 | 7 577 | 92,63 | ||||
| 2025-07-24 | 13F | MFA Wealth Services | 80 954 | 0,71 | 8 834 | 17,32 | ||||
| 2025-06-27 | NP | AAARX - Strategic Allocation: Aggressive Fund R Class This fund is a listed as child fund of American Century Companies Inc and if that institution has disclosed ownership in this security, then these positions will not be double counted when calculating total shares and total value | 374 376 | −1,09 | 36 419 | −8,95 | ||||
| 2025-04-30 | 13F | Sofos Investments, Inc. | 107 | −91,24 | 10 | −90,38 | ||||
| 2025-08-11 | 13F | Private Advisor Group, LLC | 247 941 | 15,10 | 27 055 | 34,08 | ||||
| 2025-07-09 | 13F | Sunpointe, LLC | 7 138 | −2,77 | 779 | 13,25 | ||||
| 2025-08-15 | 13F | Prevail Innovative Wealth Advisors, Llc | 15 418 | 15,46 | 1 682 | 34,56 | ||||
| 2025-05-09 | 13F | Belvedere Trading LLC | Put | 0 | −100,00 | 0 | −100,00 | |||
| 2025-08-13 | 13F | Marshall Wace, Llp | 6 882 | 751 | ||||||
| 2025-08-13 | 13F | WCG Wealth Advisors LLC | 14 195 | 2,09 | 1 549 | 18,89 | ||||
| 2025-08-05 | 13F | Simplex Trading, Llc | 1 236 | 0 | ||||||
| 2025-07-25 | 13F | Pathway Financial Advisors LLC | 63 587 | 7,02 | 6 939 | 24,67 | ||||
| 2025-08-12 | 13F | Global Retirement Partners, LLC | 5 707 | 142,13 | 623 | 165,81 | ||||
| 2025-08-14 | 13F | Bank Of America Corp /de/ | 429 435 | −3,27 | 46 860 | 12,69 | ||||
| 2025-07-24 | 13F | Cyndeo Wealth Partners, LLC | 30 342 | −5,97 | 3 311 | 9,53 | ||||
| 2025-08-04 | 13F | Spire Wealth Management | 2 636 | 1 046,09 | 288 | 1 266,67 | ||||
| 2025-08-13 | 13F | Valued Retirements, Inc. | 18 229 | 78,23 | 1 989 | 107,62 | ||||
| 2025-07-17 | 13F | Oakworth Capital, Inc. | 1 635 | 0,00 | 178 | 16,34 | ||||
| 2025-07-08 | 13F | Parallel Advisors, LLC | 111 | 0,00 | 12 | 20,00 | ||||
| 2025-08-12 | 13F | Bedel Financial Consulting, Inc. | 24 485 | 1,48 | 2 672 | 11,71 | ||||
| 2025-08-07 | 13F | 1620 Investment Advisors, Inc. | 1 | 0 | ||||||
| 2025-04-28 | 13F | D.a. Davidson & Co. | 0 | −100,00 | 0 | |||||
| 2025-08-14 | 13F | Comerica Bank | 1 185 | 34,35 | 129 | 57,32 | ||||
| 2025-08-14 | 13F | GWM Advisors LLC | 216 614 | 4 972,93 | 23 637 | 5 823,81 | ||||
| 2025-08-14 | 13F | Ruggaard & Associates LLC | 142 821 | 2,89 | 15 585 | 19,87 | ||||
| 2025-08-12 | 13F | Ameritas Investment Partners, Inc. | 0 | 0 | ||||||
| 2025-08-14 | 13F | Fmr Llc | 1 118 | 25,06 | 122 | 45,78 | ||||
| 2025-07-30 | 13F | BlueChip Wealth Advisors LLC | 13 501 | 15,53 | 1 473 | 34,64 | ||||
| 2025-08-14 | 13F | Gallagher Fiduciary Advisors, LLC | 3 883 | 424 | ||||||
| 2025-07-24 | 13F | Leo Wealth, LLC | 2 293 | 250 | ||||||
| 2025-08-08 | 13F | Cetera Investment Advisers | 60 659 | 1,08 | 6 619 | 17,75 | ||||
| 2025-08-13 | 13F | Congress Wealth Management LLC / DE / | 4 894 | 91,32 | 534 | 123,43 | ||||
| 2025-07-08 | 13F | Next Level Private LLC | 157 782 | 83,46 | 17 217 | 113,74 | ||||
| 2025-07-22 | 13F | Legacy CG, LLC | 24 233 | −4,66 | 2 644 | 11,09 | ||||
| 2025-08-05 | 13F | Fourth Dimension Wealth, LLC | 18 533 | 10,88 | 2 022 | 29,20 | ||||
| 2025-07-29 | 13F | Fundamentun, Llc | 87 807 | 9 582 | ||||||
| 2025-07-24 | 13F | Us Bancorp \de\ | 365 | 0,00 | 40 | 14,71 | ||||
| 2025-08-13 | 13F | GeoWealth Management, LLC | 0 | −100,00 | 0 | |||||
| 2025-08-13 | 13F | Jones Financial Companies Lllp | 426 | 46 | ||||||
| 2025-07-28 | 13F | RFG Advisory, LLC | 45 199 | 319,48 | 4 932 | 388,80 | ||||
| 2025-08-08 | 13F | Financial Gravity Companies, Inc. | 107 | −86,81 | 12 | −86,25 | ||||
| 2025-04-28 | 13F | Strategic Financial Concepts, LLC | 0 | −100,00 | 0 | −100,00 | ||||
| 2025-07-30 | 13F | Advantage Trust Co | 284 | 31 | ||||||
| 2025-08-11 | 13F | Western Wealth Management, LLC | 50 615 | 1 319,78 | 5 523 | 1 558,56 | ||||
| 2025-08-04 | 13F | Flagship Harbor Advisors, Llc | 45 943 | 7,74 | 5 013 | 25,51 | ||||
| 2025-08-06 | 13F | Commonwealth Equity Services, Llc | 176 171 | 39,47 | 19 | 72,73 | ||||
| 2025-08-08 | 13F | Thoroughbred Financial Services, Llc | 3 398 | 0 | ||||||
| 2025-08-08 | 13F | Avantax Advisory Services, Inc. | 9 683 | 0,82 | 1 057 | 17,46 | ||||
| 2025-07-24 | 13F | Mainstay Capital Management Llc /adv | 1 246 969 | 28,96 | 136 069 | 50,23 | ||||
| 2025-09-10 | 13F | WT Wealth Management | 12 189 | −20,98 | 1 330 | −7,89 | ||||
| 2025-08-12 | 13F | Jpmorgan Chase & Co | 79 | −30,70 | 9 | −20,00 | ||||
| 2025-07-29 | 13F | Private Trust Co Na | 4 170 | 0,65 | 455 | 17,27 | ||||
| 2025-08-04 | 13F | Arkadios Wealth Advisors | 48 134 | 2,25 | 5 252 | 19,12 | ||||
| 2025-08-14 | 13F | Two Sigma Investments, Lp | 110 300 | 12 036 | ||||||
| 2025-07-31 | 13F/A | Avion Wealth | 1 018 | 0 | ||||||
| 2025-08-05 | 13F | GPS Wealth Strategies Group, LLC | 145 | 16,00 | 16 | 36,36 | ||||
| 2025-08-13 | 13F | Smith, Moore & Co. | 2 281 | 249 | ||||||
| 2025-07-28 | 13F | Harbour Investments, Inc. | 2 002 | −15,03 | 218 | −0,91 | ||||
| 2025-08-15 | 13F | Equitable Holdings, Inc. | 140 554 | 9,96 | 15 337 | 28,11 | ||||
| 2025-08-11 | 13F | Independent Advisor Alliance | 4 838 | 528 | ||||||
| 2025-08-05 | 13F | Sigma Planning Corp | 47 367 | 5,11 | 5 169 | 22,44 | ||||
| 2025-08-13 | 13F | Transce3nd, LLC | 3 | 0,00 | 0 | |||||
| 2025-07-08 | 13F | IAM Advisory, LLC | 137 273 | −1,60 | 14 979 | 14,63 | ||||
| 2025-08-12 | 13F | Wealth Advisors of Iowa, LLC | 135 207 | 2 738,69 | 14 754 | 3 207,85 | ||||
| 2025-07-22 | 13F | Beacon Financial Advisory LLC | 6 492 | 70,93 | 708 | 99,44 | ||||
| 2025-08-15 | 13F/A | MONECO Advisors, LLC | 0 | −100,00 | 0 | |||||
| 2025-07-29 | 13F | Stratos Wealth Partners, LTD. | 51 546 | −47,04 | 5 625 | −38,31 | ||||
| 2025-08-14 | 13F/A | Rockefeller Capital Management L.P. | 28 086 | 17,45 | 3 065 | 36,85 | ||||
| 2025-08-14 | 13F | Clark Capital Management Group, Inc. | 2 770 | −31,20 | 302 | −19,89 | ||||
| 2025-07-30 | 13F | Parcion Private Wealth LLC | 52 122 | 3,46 | 5 688 | 20,54 | ||||
| 2025-08-13 | 13F | VestGen Advisors, LLC | 2 296 | 251 | ||||||
| 2025-08-14 | 13F | Garden State Investment Advisory Services LLC | 4 544 | 496 | ||||||
| 2025-07-25 | 13F | Hobbs Group Advisors, LLC | 5 429 | −33,57 | 592 | −22,61 | ||||
| 2025-08-15 | 13F | Captrust Financial Advisors | 34 159 | 10,79 | 3 727 | 29,05 | ||||
| 2025-07-17 | 13F | KWB Wealth | 14 660 | 5,28 | 1 373 | −1,08 | ||||
| 2025-07-25 | 13F | Cwm, Llc | 1 155 | 0 | ||||||
| 2025-07-29 | 13F | Harbor Asset Planning, Inc. | 747 | 81 | ||||||
| 2025-08-04 | 13F | Assetmark, Inc | 409 | 49,27 | 45 | 76,00 | ||||
| 2025-08-14 | 13F | Jane Street Group, Llc | 9 398 | 7,86 | 1 026 | 25,61 | ||||
| 2025-08-08 | 13F | Good Life Advisors, LLC | 68 148 | 2 584,05 | 7 436 | 3 037,55 | ||||
| 2025-08-11 | 13F | NewEdge Wealth, LLC | 14 001 | 60,78 | 1 531 | 87,85 | ||||
| 2025-08-12 | 13F/A | Cozad Asset Management Inc | 12 315 | 159,97 | 1 344 | 203,16 | ||||
| 2025-05-15 | 13F | Vermillion & White Wealth Management Group, LLC | 0 | −100,00 | 0 | |||||
| 2025-08-06 | 13F | Ethos Financial Group, LLC | 7 421 | 810 | ||||||
| 2025-08-08 | 13F | Intrua Financial, LLC | 283 102 | 60,28 | 30 892 | 86,73 | ||||
| 2025-08-11 | 13F | Y.D. More Investments Ltd | 201 | 22 | ||||||
| 2025-08-13 | 13F | Northwestern Mutual Wealth Management Co | 253 503 | 573,14 | 27 662 | 684,29 | ||||
| 2025-08-08 | 13F | Larson Financial Group LLC | 516 628 | 165,33 | 56 374 | 209,10 | ||||
| 2025-08-08 | 13F | Fortis Group Advisors, LLC | 18 930 | 65,67 | 2 070 | 93,46 | ||||
| 2025-08-18 | 13F | Hershey Financial Advisers, LLC | 4 950 | 540 | ||||||
| 2025-05-08 | 13F | IFG Advisory, LLC | 0 | −100,00 | 0 | |||||
| 2025-07-16 | 13F | Dakota Wealth Management | 62 890 | −8,70 | 6 863 | 6,35 | ||||
| 2025-08-07 | 13F | 49 Wealth Management, Llc | 3 021 | −50,32 | 330 | −42,18 | ||||
| 2025-07-15 | 13F | Retireful, LLC | 4 190 | 457 | ||||||
| 2025-08-14 | 13F | IHT Wealth Management, LLC | 30 079 | 6,29 | 3 282 | 23,85 | ||||
| 2025-08-14 | 13F | UBS Group AG | 171 000 | 296,22 | 18 660 | 361,63 | ||||
| 2025-07-22 | 13F | Petros Family Wealth, LLC | 43 275 | 30,07 | 4 722 | 51,54 | ||||
| 2025-08-13 | 13F | Maia Wealth LLC | 0 | −100,00 | 0 | |||||
| 2025-08-14 | 13F | Mercer Global Advisors Inc /adv | 2 112 | −8,53 | 230 | 6,48 | ||||
| 2025-07-31 | 13F | Cambridge Investment Research Advisors, Inc. | 85 618 | 34,73 | 9 | 80,00 | ||||
| 2025-08-05 | 13F | GHP Investment Advisors, Inc. | 1 072 | 0,00 | 117 | 16,00 | ||||
| 2025-07-28 | 13F | Axxcess Wealth Management, Llc | 1 893 | 207 | ||||||
| 2025-08-12 | 13F | Park Square Financial Group, LLC | 1 930 | 111,39 | 211 | 147,06 | ||||
| 2025-08-18 | 13F | Geneos Wealth Management Inc. | 7 295 | −1,07 | 796 | 15,36 | ||||
| 2025-08-11 | 13F | Principal Securities, Inc. | 3 250 | 8,88 | 355 | 19,19 | ||||
| 2025-08-14 | 13F | Mpwm Advisory Solutions, Llc | 6 392 | 23,35 | 697 | 43,71 | ||||
| 2025-08-13 | 13F | Brown Advisory Inc | 5 160 | 10,73 | 563 | 29,13 | ||||
| 2025-07-16 | 13F | Moneywise, Inc. | 35 401 | −9,98 | 3 863 | 4,89 | ||||
| 2025-06-27 | NP | AACRX - Strategic Allocation: Conservative Fund R Class This fund is a listed as child fund of American Century Companies Inc and if that institution has disclosed ownership in this security, then these positions will not be double counted when calculating total shares and total value | 130 789 | 0,00 | 12 723 | −7,94 | ||||
| 2025-04-21 | 13F | PSI Advisors, LLC | 0 | −100,00 | 0 | −100,00 | ||||
| 2025-08-14 | 13F | CoreCap Advisors, LLC | 81 | 5,19 | 9 | 14,29 | ||||
| 2025-08-13 | 13F | Cresset Asset Management, LLC | 28 578 | −0,08 | 3 118 | 16,43 | ||||
| 2025-07-16 | 13F | Freestate Advisors LLC | 9 591 | 1,27 | 1 047 | 17,93 | ||||
| 2025-07-18 | 13F | Midwest Financial Group LLC | 2 376 | 259 | ||||||
| 2025-08-12 | 13F | Steward Partners Investment Advisory, Llc | 14 612 | 44,80 | 1 594 | 68,68 | ||||
| 2025-08-14 | 13F | Stifel Financial Corp | 90 470 | 23,48 | 9 872 | 43,84 | ||||
| 2025-08-14 | 13F | Integrated Wealth Concepts LLC | 15 026 | −0,81 | 1 640 | 15,59 | ||||
| 2025-08-14 | 13F | Win Advisors, Inc | 126 687 | −1,33 | 13 824 | 14,94 | ||||
| 2025-07-24 | 13F | IFP Advisors, Inc | 59 065 | 126,71 | 6 445 | 164,14 | ||||
| 2025-08-01 | 13F | Transcend Wealth Collective, Llc | 0 | −100,00 | 0 | |||||
| 2025-07-09 | 13F | Procyon Private Wealth Partners, LLC | 296 786 | −0,58 | 32 385 | 15,82 | ||||
| 2025-08-06 | 13F | Golden State Wealth Management, LLC | 14 087 | 61,68 | 1 537 | 88,36 | ||||
| 2025-08-14 | 13F | Citadel Advisors Llc | 0 | −100,00 | 0 | |||||
| 2025-06-27 | NP | TWSMX - Strategic Allocation: Moderate Fund Investor Class This fund is a listed as child fund of American Century Companies Inc and if that institution has disclosed ownership in this security, then these positions will not be double counted when calculating total shares and total value | 362 249 | −5,53 | 35 240 | −13,04 | ||||
| 2025-08-28 | NP | TFAFX - Tactical Growth Allocation Fund Class I | 400 | 44 | ||||||
| 2025-09-04 | 13F/A | Advisor Group Holdings, Inc. | 415 538 | 33,26 | 45 344 | 55,24 | ||||
| 2025-07-24 | 13F | Aurora Private Wealth, Inc. | 0 | −100,00 | 0 | |||||
| 2025-08-08 | 13F | Capital Investment Advisory Services, LLC | 300 | 33 | ||||||
| 2025-08-13 | 13F | Per Stirling Capital Management, LLC. | 117 034 | 0,91 | 12 771 | 17,54 | ||||
| 2025-07-25 | 13F | Astoria Portfolio Advisors LLC. | 12 954 | 4,47 | 1 422 | 24,65 | ||||
| 2025-08-14 | 13F | Mml Investors Services, Llc | 67 988 | 157,76 | 7 | 250,00 | ||||
| 2025-08-12 | 13F | Proequities, Inc. | 0 | 0 | ||||||
| 2025-08-12 | 13F | SRS Capital Advisors, Inc. | 26 | 0,00 | 3 | 0,00 | ||||
| 2025-08-14 | 13F | Raymond James Financial Inc | 747 648 | 58,42 | 81 583 | 84,55 | ||||
| 2025-07-21 | 13F | Ameritas Advisory Services, LLC | 34 870 | −54,39 | 3 805 | −49,68 | ||||
| 2025-07-17 | 13F | Janney Montgomery Scott LLC | 20 454 | 24,36 | 2 | 100,00 | ||||
| 2025-08-13 | 13F | Capital Analysts, Inc. | 30 590 | 2,24 | 3 | 50,00 | ||||
| 2025-07-25 | 13F | Apollon Financial, LLC | 2 965 | 0,00 | 324 | 16,61 | ||||
| 2025-08-01 | 13F | Belvedere Trading LLC | Call | 2 300 | 251 | |||||
| 2025-08-05 | 13F | Key FInancial Inc | 17 057 | 55,69 | 1 861 | 81,38 | ||||
| 2025-08-13 | 13F | Truvestments Capital Llc | 36 | 0,00 | 4 | 0,00 | ||||
| 2025-08-07 | 13F | PCG Wealth Advisors, LLC | 0 | −100,00 | 0 | |||||
| 2025-08-01 | 13F | Ashton Thomas Private Wealth, LLC | 4 993 | 80,91 | 545 | 110,85 | ||||
| 2025-08-14 | 13F | Royal Bank Of Canada | 190 677 | 63,26 | 20 806 | 90,18 | ||||
| 2025-08-14 | 13F | Goldman Sachs Group Inc | 2 225 | 0,00 | 243 | 16,35 | ||||
| 2025-07-31 | 13F | Oppenheimer & Co Inc | 4 973 | 543 | ||||||
| 2025-08-01 | 13F | Motco | 960 | 105 | ||||||
| 2025-08-04 | 13F | Atria Investments Llc | 3 644 | −82,41 | 398 | −79,54 | ||||
| 2025-08-14 | 13F | Wells Fargo & Company/mn | 74 507 | 71,72 | 8 130 | 100,05 | ||||
| 2025-08-11 | 13F | Anderson Financial Strategies, LLC | 142 255 | 15 523 | ||||||
| 2025-08-14 | 13F | Synovus Financial Corp | 248 184 | 0,06 | 27 101 | 16,64 | ||||
| 2025-08-06 | 13F | Founders Financial Securities Llc | 30 008 | 3 274 | ||||||
| 2025-07-16 | 13F | St Germain D J Co Inc | 48 | 5 | ||||||
| 2025-08-15 | 13F | Kestra Advisory Services, LLC | 7 931 | 35,32 | 865 | 57,56 | ||||
| 2025-08-14 | 13F | Mariner, LLC | 48 430 | 5 285 | ||||||
| 2025-07-29 | 13F | Stratos Wealth Advisors, LLC | 88 515 | 4,55 | 9 659 | 21,79 | ||||
| 2025-04-21 | 13F | SILVER OAK SECURITIES, Inc | 0 | −100,00 | 0 | |||||
| 2025-08-07 | 13F | Brio Consultants, LLC | 4 124 | 450 | ||||||
| 2025-08-11 | 13F | Strategic Equity Management | 3 877 | −13,48 | 423 | 0,95 | ||||
| 2025-08-12 | 13F | American Century Companies Inc | 783 232 | −12,27 | 85 466 | 2,20 | ||||
| 2025-07-15 | 13F | Unified Investment Management | 12 046 | 0,01 | 1 314 | 16,49 | ||||
| 2025-07-25 | 13F | Atria Wealth Solutions, Inc. | 4 015 | 24,61 | 438 | 45,51 | ||||
| 2025-08-14 | 13F | Warren Averett Asset Management, LLC | 3 599 | −13,98 | 393 | 0,26 | ||||
| 2025-07-30 | 13F/A | KPP Advisory Services LLC | 24 558 | 143,41 | 2 680 | 183,49 | ||||
| 2025-08-12 | 13F | Nemes Rush Group LLC | 625 | 0,00 | 68 | 17,24 | ||||
| 2025-07-30 | 13F | Prosperity Financial Group, Inc. | 29 568 | 1,95 | 3 226 | 18,78 | ||||
| 2025-07-09 | 13F | Exchange Bank | 1 928 | 210 | ||||||
| 2025-08-08 | 13F | Foundations Investment Advisors, LLC | 0 | −100,00 | 0 | |||||
| 2025-07-10 | 13F | Redhawk Wealth Advisors, Inc. | 261 138 | 28 495 | ||||||
| 2025-08-01 | 13F | Envestnet Asset Management Inc | 587 960 | −1,86 | 64 158 | 14,33 | ||||
| 2025-07-23 | 13F | Cannon Wealth Management Services, LLC | 1 900 | 207 | ||||||
| 2025-08-15 | 13F | Morgan Stanley | 1 629 | −52,97 | 178 | −45,37 | ||||
| 2025-04-24 | 13F | Alta Wealth Advisors LLC | 0 | −100,00 | 0 | |||||
| 2025-08-11 | 13F | HighTower Advisors, LLC | 12 625 | 4,12 | 1 378 | 21,32 | ||||
| 2025-08-14 | 13F | Susquehanna International Group, Llp | 0 | −100,00 | 0 | |||||
| 2025-08-07 | 13F | Kestra Private Wealth Services, Llc | 34 695 | 1,99 | 3 786 | 18,80 | ||||
| 2025-07-07 | 13F | Nova Wealth Management, Inc. | 27 221 | 470,31 | 2 969 | 563,98 | ||||
| 2025-07-21 | 13F | DHJJ Financial Advisors, Ltd. | 3 | 0,00 | 0 | |||||
| 2025-08-12 | 13F | Financial Advocates Investment Management | 5 163 | 2,58 | 563 | 19,53 | ||||
| 2025-07-17 | 13F | Park Place Capital Corp | 673 | 73 | ||||||
| 2025-07-21 | 13F | Ameriflex Group, Inc. | 0 | −100,00 | 0 | |||||
| 2025-07-29 | 13F | Mb, Levis & Associates, Llc | 82 416 | 4,28 | 8 993 | 21,48 | ||||
| 2025-08-12 | 13F | LPL Financial LLC | 1 726 534 | 7,33 | 188 399 | 25,04 | ||||
| 2025-07-11 | 13F | Farther Finance Advisors, LLC | 118 | 0,00 | 13 | 9,09 | ||||
| 2025-08-06 | 13F | AE Wealth Management LLC | 14 649 | 21,08 | 1 598 | 41,04 | ||||
| 2025-08-14 | 13F | Great Valley Advisor Group, Inc. | 871 588 | 0,37 | 95 108 | 16,93 |