Grundläggande statistik
| Portföljvärde | $ 109 486 993 |
| Aktuella positioner | 132 |
Senaste innehav, resultat, förvaltat kapital (från 13F, 13D)
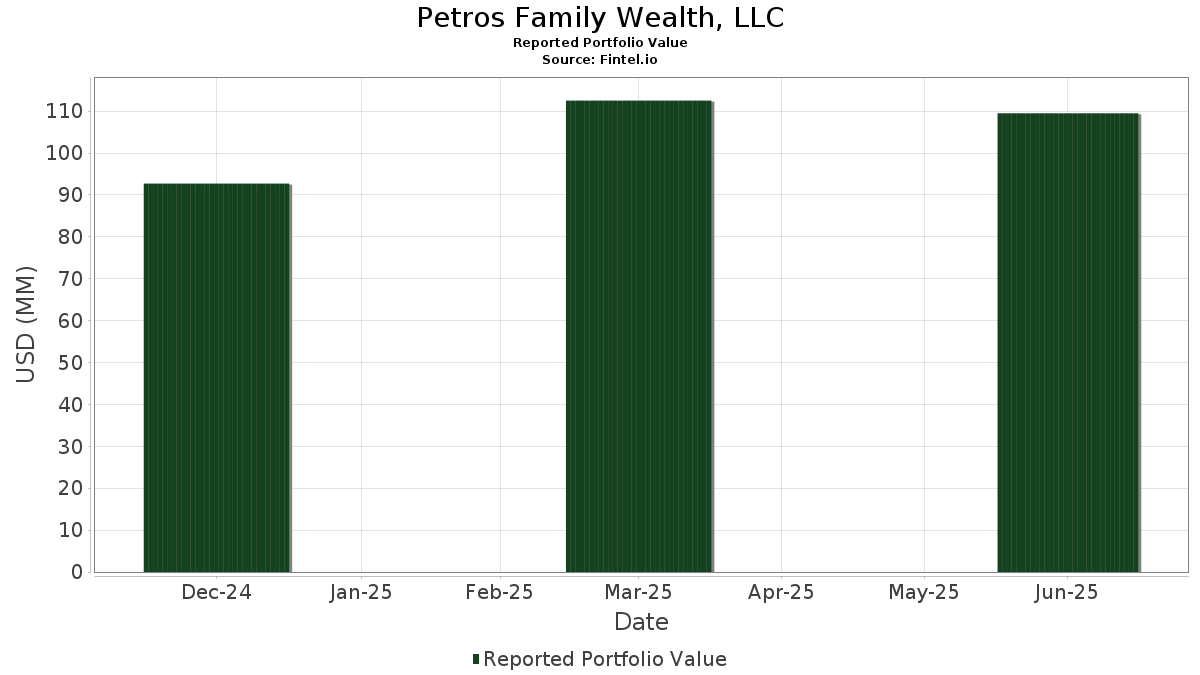
Petros Family Wealth, LLC har redovisat 132 totala innehav i sina senaste SEC-arkiveringar. Det senaste portföljvärdet beräknas vara $ 109 486 993 USD. Faktiskt förvaltade tillgångar (AUM) är detta värde plus likvida medel (som inte redovisas). Petros Family Wealth, LLCs största innehav är SPDR S&P 500 ETF (US:SPY) , American Century ETF Trust - American Century U.S. Quality Growth ETF (US:QGRO) , Apple Inc. (US:AAPL) , Microsoft Corporation (US:MSFT) , and American Century ETF Trust - Avantis International Equity ETF (US:AVDE) . Petros Family Wealth, LLCs nya positioner inkluderar American Century ETF Trust - Avantis International Equity ETF (US:AVDE) , American Century ETF Trust - Avantis Emerging Markets Equity ETF (US:AVEM) , Harbor ETF Trust - Harbor Small Cap Earners ETF (US:EBIT) , Robinhood Markets, Inc. (US:HOOD) , and General Electric Company (US:GE) .
Största ökningarna detta kvartal
Vi använder förändringen i portföljallokeringen eftersom det är det mest meningsfulla måttet. Förändringar kan bero på transaktioner eller förändringar i aktiekurser.
| Värdepapper | Aktier (MM) |
Värde (MM$) |
Portfölj % av | ΔPortfölj % av |
|---|---|---|---|---|
| 0,05 | 3,58 | 3,2731 | 3,2731 | |
| 0,02 | 1,28 | 1,1728 | 1,1728 | |
| 0,01 | 4,48 | 4,0894 | 1,1342 | |
| 0,04 | 1,15 | 1,0518 | 1,0518 | |
| 0,04 | 4,72 | 3,5342 | 0,7644 | |
| 0,02 | 3,15 | 2,3597 | 0,5656 | |
| 0,01 | 0,56 | 0,5139 | 0,5139 | |
| 0,00 | 0,54 | 0,4045 | 0,4045 | |
| 0,01 | 0,37 | 0,3347 | 0,3347 | |
| 0,00 | 0,62 | 0,5700 | 0,3273 |
Största minskningarna detta kvartal
Vi använder förändringen i portföljallokeringen eftersom det är det mest meningsfulla måttet. Förändringar kan bero på transaktioner eller förändringar i aktiepriser.
| Värdepapper | Aktier (MM) |
Värde (MM$) |
Portfölj % av | ΔPortfölj % av |
|---|---|---|---|---|
| 0,01 | 2,64 | 2,4142 | −1,4322 | |
| 0,00 | 0,90 | 0,8247 | −0,3442 | |
| 0,00 | 1,46 | 1,0928 | −0,3269 | |
| 0,02 | 4,59 | 4,1952 | −0,2678 | |
| 0,00 | 0,52 | 0,4742 | −0,2359 | |
| 0,03 | 0,64 | 0,4791 | −0,1782 | |
| 0,01 | 1,00 | 0,7504 | −0,1739 | |
| 0,00 | 0,73 | 0,5455 | −0,1642 | |
| 0,00 | 0,56 | 0,4179 | −0,1589 | |
| 0,00 | 0,78 | 0,5820 | −0,1582 |
13F- och fond arkiveringar
Denna blankett lämnades in den 2025-07-22 för rapporteringsperioden 2025-06-30. Klicka på länksymbolen för att se hela transaktionshistoriken.
Uppgradera för att låsa upp premiumdata och exportera till Excel![]() .
.
| Värdepapper | Typ | Genomsnittligt aktiepris | Aktier (MM) |
ΔAktier (%) |
ΔAktier (%) |
Värde ($MM) |
Portfölj (%) |
ΔPortfölj (%) |
|
|---|---|---|---|---|---|---|---|---|---|
| SPY / SPDR S&P 500 ETF | 0,01 | 12,34 | 6,95 | 24,07 | 5,2043 | 0,2233 | |||
| QGRO / American Century ETF Trust - American Century U.S. Quality Growth ETF | 0,04 | 30,07 | 4,72 | 51,54 | 3,5342 | 0,7644 | |||
| AAPL / Apple Inc. | 0,02 | −0,97 | 4,59 | −8,52 | 4,1952 | −0,2678 | |||
| MSFT / Microsoft Corporation | 0,01 | 1,61 | 4,48 | 34,65 | 4,0894 | 1,1342 | |||
| AVDE / American Century ETF Trust - Avantis International Equity ETF | 0,05 | 3,58 | 3,2731 | 3,2731 | |||||
| NVDD / Direxion Shares ETF Trust - Direxion Daily NVDA Bear 1X Shares | 0,02 | 7,14 | 3,15 | 56,19 | 2,3597 | 0,5656 | |||
| UNH / UnitedHealth Group Incorporated | 0,01 | 2,54 | 2,64 | −38,92 | 2,4142 | −1,4322 | |||
| GOOGL / Alphabet Inc. | 0,01 | 0,87 | 2,63 | 14,52 | 1,9656 | −0,0725 | |||
| IJH / iShares Trust - iShares Core S&P Mid-Cap ETF | 0,04 | 7,68 | 2,54 | 14,45 | 1,8975 | −0,0712 | |||
| COWZ / Pacer Funds Trust - Pacer US Cash Cows 100 ETF | 0,04 | 10,15 | 2,32 | 10,82 | 1,7398 | −0,1241 | |||
| CSCO / Cisco Systems, Inc. | 0,03 | −2,10 | 2,04 | 10,10 | 1,5254 | −0,1203 | |||
| AMZN / Amazon.com, Inc. | 0,01 | 25,10 | 2,01 | 44,22 | 1,5042 | 0,2660 | |||
| BLK / BlackRock, Inc. | 0,00 | 4,29 | 1,89 | 15,62 | 1,4136 | −0,0383 | |||
| KLAC / KLA Corporation | 0,00 | 14,85 | 1,86 | 51,42 | 1,3951 | 0,3004 | |||
| SYK / Stryker Corporation | 0,00 | 3,82 | 1,79 | 10,33 | 1,6390 | 0,1937 | |||
| JPM / JPMorgan Chase & Co. | 0,01 | 5,37 | 1,67 | 24,57 | 1,2524 | 0,0581 | |||
| IWM / iShares Trust - iShares Russell 2000 ETF | 0,01 | 7,26 | 1,65 | 16,02 | 1,2362 | −0,0291 | |||
| COST / Costco Wholesale Corporation | 0,00 | −12,67 | 1,46 | −8,58 | 1,0928 | −0,3269 | |||
| AVEM / American Century ETF Trust - Avantis Emerging Markets Equity ETF | 0,02 | 1,28 | 1,1728 | 1,1728 | |||||
| ISRG / Intuitive Surgical, Inc. | 0,00 | 8,43 | 1,27 | 18,99 | 0,9521 | 0,0018 | |||
| META / Meta Platforms, Inc. | 0,00 | 12,13 | 1,27 | 43,55 | 0,9501 | 0,1644 | |||
| EMR / Emerson Electric Co. | 0,01 | 0,87 | 1,24 | 22,73 | 0,9299 | 0,0297 | |||
| IBM / International Business Machines Corporation | 0,00 | −3,23 | 1,22 | 14,70 | 1,1124 | 0,1688 | |||
| CRWD / CrowdStrike Holdings, Inc. | 0,00 | 1,45 | 1,21 | 46,61 | 0,9068 | 0,1720 | |||
| EBIT / Harbor ETF Trust - Harbor Small Cap Earners ETF | 0,04 | 1,15 | 1,0518 | 1,0518 | |||||
| MMM / 3M Company | 0,01 | −0,99 | 1,02 | 2,63 | 0,9276 | 0,0482 | |||
| ICE / Intercontinental Exchange, Inc. | 0,01 | −9,35 | 1,00 | −3,65 | 0,7504 | −0,1739 | |||
| RTX / RTX Corporation | 0,01 | −1,50 | 0,99 | 8,55 | 0,7416 | −0,0694 | |||
| TSLA / Tesla, Inc. | 0,00 | 4,74 | 0,98 | 28,50 | 0,8980 | 0,2174 | |||
| GOOGL / Alphabet Inc. | 0,01 | 14,88 | 0,96 | 30,97 | 0,8772 | 0,2251 | |||
| BAC / Bank of America Corporation | 0,02 | −3,21 | 0,93 | 9,67 | 0,6966 | −0,0571 | |||
| AMGN / Amgen Inc. | 0,00 | −0,79 | 0,91 | −11,09 | 0,8356 | −0,0787 | |||
| ACN / Accenture plc | 0,00 | −28,33 | 0,90 | −31,41 | 0,8247 | −0,3442 | |||
| NFLX / Netflix, Inc. | 0,00 | −7,97 | 0,90 | 32,30 | 0,8195 | 0,2161 | |||
| TMUS / T-Mobile US, Inc. | 0,00 | 56,89 | 0,83 | 40,17 | 0,6191 | 0,0946 | |||
| PANW / Palo Alto Networks, Inc. | 0,00 | 7,12 | 0,82 | 28,41 | 0,6126 | 0,0464 | |||
| LHX / L3Harris Technologies, Inc. | 0,00 | −6,72 | 0,82 | 11,80 | 0,6100 | −0,0380 | |||
| AVGO / Broadcom Inc. | 0,00 | 2,77 | 0,80 | 69,21 | 0,7281 | 0,3094 | |||
| TXN / Texas Instruments Incorporated | 0,00 | 4,41 | 0,79 | 20,74 | 0,7181 | 0,1389 | |||
| LOW / Lowe's Companies, Inc. | 0,00 | −1,85 | 0,78 | −6,61 | 0,5820 | −0,1582 | |||
| ADI / Analog Devices, Inc. | 0,00 | −10,13 | 0,77 | 6,03 | 0,5799 | −0,0693 | |||
| ANET / Arista Networks Inc | 0,01 | 64,55 | 0,75 | 117,39 | 0,5620 | 0,2548 | |||
| BRK.B / Berkshire Hathaway Inc. | 0,00 | 9,66 | 0,73 | 0,00 | 0,5490 | −0,1028 | |||
| BRK.A / Berkshire Hathaway Inc. | 0,00 | 0,00 | 0,73 | −8,77 | 0,5455 | −0,1642 | |||
| ORCL / Oracle Corporation | 0,00 | −4,54 | 0,69 | 49,35 | 0,6338 | 0,2207 | |||
| AMT / American Tower Corporation | 0,00 | −1,66 | 0,67 | 0,00 | 0,6113 | 0,0159 | |||
| NEE / NextEra Energy, Inc. | 0,01 | 35,56 | 0,64 | 32,92 | 0,4805 | 0,0507 | |||
| PFE / Pfizer Inc. | 0,03 | −9,52 | 0,64 | −13,40 | 0,4791 | −0,1782 | |||
| PLTR / Palantir Technologies Inc. | 0,00 | 41,47 | 0,62 | 128,57 | 0,5700 | 0,3273 | |||
| ABBV / AbbVie Inc. | 0,00 | 1,36 | 0,61 | −10,19 | 0,4552 | −0,1468 | |||
| PSX / Phillips 66 | 0,01 | −1,35 | 0,60 | −4,60 | 0,4500 | −0,1106 | |||
| WMT / Walmart Inc. | 0,01 | −0,58 | 0,60 | 10,72 | 0,5472 | 0,0663 | |||
| CAT / Caterpillar Inc. | 0,00 | 10,38 | 0,60 | 30,00 | 0,5468 | 0,1373 | |||
| AXP / American Express Company | 0,00 | 12,28 | 0,59 | 33,18 | 0,5434 | 0,1462 | |||
| GSCE / GS Connect S&P GSCI Enhanced Commodity Total Return ETN | 0,00 | 3,35 | 0,59 | 33,94 | 0,4407 | 0,0499 | |||
| PGR / The Progressive Corporation | 0,00 | 16,73 | 0,59 | 10,15 | 0,4390 | −0,0346 | |||
| AMD / Advanced Micro Devices, Inc. | 0,00 | 5,58 | 0,57 | 45,88 | 0,5175 | 0,1722 | |||
| ABT / Abbott Laboratories | 0,00 | 0,53 | 0,57 | 3,10 | 0,4234 | −0,0644 | |||
| HOOD / Robinhood Markets, Inc. | 0,01 | 0,56 | 0,5139 | 0,5139 | |||||
| HD / The Home Depot, Inc. | 0,00 | −14,00 | 0,56 | −13,89 | 0,4179 | −0,1589 | |||
| GEV / GE Vernova Inc. | 0,00 | −3,59 | 0,55 | 67,37 | 0,4150 | 0,1201 | |||
| PEP / PepsiCo, Inc. | 0,00 | −9,58 | 0,55 | −20,43 | 0,5056 | −0,1124 | |||
| SPGI / S&P Global Inc. | 0,00 | −0,86 | 0,55 | 2,81 | 0,4108 | −0,0633 | |||
| GE / General Electric Company | 0,00 | 0,54 | 0,4045 | 0,4045 | |||||
| ETN / Eaton Corporation plc | 0,00 | 1,42 | 0,54 | 33,33 | 0,4016 | 0,0435 | |||
| GGG / Graco Inc. | 0,01 | −1,32 | 0,53 | 1,52 | 0,3992 | −0,0674 | |||
| QCOM / QUALCOMM Incorporated | 0,00 | −37,32 | 0,52 | −34,96 | 0,4742 | −0,2359 | |||
| TJX / The TJX Companies, Inc. | 0,00 | −9,22 | 0,49 | −8,01 | 0,4521 | −0,0259 | |||
| HRL / Hormel Foods Corporation | 0,02 | 0,00 | 0,48 | −2,22 | 0,3625 | −0,0778 | |||
| AXON / Axon Enterprise, Inc. | 0,00 | −1,69 | 0,48 | 54,84 | 0,4386 | 0,1628 | |||
| WFC / Wells Fargo & Company | 0,01 | −16,02 | 0,46 | −6,11 | 0,3450 | −0,0921 | |||
| V / Visa Inc. | 0,00 | 5,33 | 0,44 | 6,88 | 0,3258 | −0,0368 | |||
| IBTP / iShares Trust - iShares iBonds Dec 2034 Term Treasury ETF | 0,02 | 23,12 | 0,42 | 23,24 | 0,3138 | 0,0116 | |||
| BMY / Bristol-Myers Squibb Company | 0,01 | −8,50 | 0,41 | −30,49 | 0,3726 | −0,1495 | |||
| PWR / Quanta Services, Inc. | 0,00 | −5,44 | 0,41 | 40,83 | 0,3048 | 0,0475 | |||
| HON / Honeywell International Inc. | 0,00 | 1,94 | 0,40 | 11,91 | 0,3029 | −0,0179 | |||
| PRI / Primerica, Inc. | 0,00 | 0,00 | 0,40 | −3,86 | 0,3647 | −0,0043 | |||
| CDNS / Cadence Design Systems, Inc. | 0,00 | 2,57 | 0,39 | 24,37 | 0,3594 | 0,0780 | |||
| GRMN / Garmin Ltd. | 0,00 | 10,83 | 0,39 | 6,56 | 0,2924 | −0,0335 | |||
| NUMG / Nushares ETF Trust - Nuveen ESG Mid-Cap Growth ETF | 0,01 | 0,39 | 0,2921 | 0,2921 | |||||
| LDOS / Leidos Holdings, Inc. | 0,00 | 11,75 | 0,39 | 30,87 | 0,2920 | 0,0266 | |||
| BK / The Bank of New York Mellon Corporation | 0,00 | −6,35 | 0,39 | 1,84 | 0,2906 | −0,0486 | |||
| MA / Mastercard Incorporated | 0,00 | 10,66 | 0,38 | 13,27 | 0,2881 | −0,0134 | |||
| PYPL / PayPal Holdings, Inc. | 0,01 | 8,46 | 0,38 | 23,78 | 0,2845 | 0,0110 | |||
| JNJ / Johnson & Johnson | 0,00 | −14,70 | 0,38 | −21,37 | 0,3465 | −0,0828 | |||
| MNST / Monster Beverage Corporation | 0,01 | 0,37 | 0,3347 | 0,3347 | |||||
| SSD / Simpson Manufacturing Co., Inc. | 0,00 | 0,30 | 0,36 | −0,82 | 0,3329 | 0,0063 | |||
| USB / U.S. Bancorp | 0,01 | −3,34 | 0,35 | 3,57 | 0,2611 | −0,0382 | |||
| FICO / Fair Isaac Corporation | 0,00 | 0,35 | 0,3172 | 0,3172 | |||||
| LIN / Linde plc | 0,00 | −3,15 | 0,35 | −2,26 | 0,2591 | −0,0562 | |||
| VO / Vanguard Index Funds - Vanguard Mid-Cap ETF | 0,00 | 0,35 | 0,3154 | 0,3154 | |||||
| IEFA / iShares Trust - iShares Core MSCI EAFE ETF | 0,00 | −30,59 | 0,34 | −23,34 | 0,2509 | −0,1381 | |||
| SBUX / Starbucks Corporation | 0,00 | −7,23 | 0,33 | −13,33 | 0,2976 | −0,0365 | |||
| NXPI / NXP Semiconductors N.V. | 0,00 | −11,86 | 0,32 | 1,27 | 0,2383 | −0,0410 | |||
| EME / EMCOR Group, Inc. | 0,00 | −12,46 | 0,32 | 26,51 | 0,2362 | 0,0148 | |||
| WTS / Watts Water Technologies, Inc. | 0,00 | 0,00 | 0,31 | 20,54 | 0,2334 | 0,0035 | |||
| CEG / Constellation Energy Corporation | 0,00 | 0,31 | 0,2818 | 0,2818 | |||||
| SO / The Southern Company | 0,00 | 0,43 | 0,30 | 0,34 | 0,2236 | −0,0411 | |||
| BR / Broadridge Financial Solutions, Inc. | 0,00 | −0,41 | 0,30 | 0,00 | 0,2706 | 0,0068 | |||
| GOLF / Acushnet Holdings Corp. | 0,00 | −0,32 | 0,29 | 5,76 | 0,2686 | 0,0214 | |||
| TTC / The Toro Company | 0,00 | 16,76 | 0,29 | 13,28 | 0,2174 | −0,0102 | |||
| FCN / FTI Consulting, Inc. | 0,00 | 0,00 | 0,29 | −1,37 | 0,2164 | −0,0447 | |||
| IWR / iShares Trust - iShares Russell Mid-Cap ETF | 0,00 | 0,00 | 0,28 | 7,98 | 0,2131 | −0,0210 | |||
| LLY / Eli Lilly and Company | 0,00 | −0,56 | 0,28 | −6,08 | 0,2542 | −0,0093 | |||
| SLV / iShares Silver Trust | 0,01 | 2,74 | 0,28 | 8,66 | 0,2529 | 0,0267 | |||
| XLK / The Select Sector SPDR Trust - The Technology Select Sector SPDR Fund | 0,00 | 0,00 | 0,26 | 22,97 | 0,1926 | 0,0061 | |||
| ECL / Ecolab Inc. | 0,00 | −13,36 | 0,25 | −8,06 | 0,2298 | −0,0131 | |||
| QQQ / Invesco QQQ Trust, Series 1 | 0,00 | 0,25 | 0,1883 | 0,1883 | |||||
| ITOT / iShares Trust - iShares Core S&P Total U.S. Stock Market ETF | 0,00 | −14,90 | 0,25 | −6,11 | 0,1848 | −0,0482 | |||
| EBGEF / Enbridge Inc. - Preferred Stock | 0,01 | 0,24 | 0,2233 | 0,2233 | |||||
| MC / Moelis & Company | 0,00 | 0,70 | 0,24 | 7,56 | 0,2218 | 0,0211 | |||
| CRVL / CorVel Corporation | 0,00 | 0,00 | 0,24 | −8,20 | 0,1760 | −0,0517 | |||
| SOLV / Solventum Corporation | 0,00 | −1,61 | 0,23 | −1,70 | 0,1730 | −0,0364 | |||
| FDX / FedEx Corporation | 0,00 | −12,32 | 0,23 | −18,12 | 0,1694 | −0,0767 | |||
| RBC / RBC Bearings Incorporated | 0,00 | −14,77 | 0,22 | 1,82 | 0,1679 | −0,0277 | |||
| LSTR / Landstar System, Inc. | 0,00 | 10,43 | 0,22 | 2,29 | 0,2044 | 0,0098 | |||
| KAI / Kadant Inc. | 0,00 | 0,00 | 0,22 | −5,93 | 0,2035 | −0,0067 | |||
| KMI / Kinder Morgan, Inc. | 0,01 | −26,45 | 0,22 | −24,23 | 0,2033 | −0,0577 | |||
| SPYG / SPDR Series Trust - SPDR Portfolio S&P 500 Growth ETF | 0,00 | 0,22 | 0,2027 | 0,2027 | |||||
| NUSC / Nushares ETF Trust - Nuveen ESG Small-Cap ETF | 0,01 | 0,22 | 0,1984 | 0,1984 | |||||
| ESGD / iShares Trust - iShares ESG Aware MSCI EAFE ETF | 0,00 | 0,21 | 0,1608 | 0,1608 | |||||
| MDT / Medtronic plc | 0,00 | −23,08 | 0,21 | −25,45 | 0,1561 | −0,0923 | |||
| XEL / Xcel Energy Inc. | 0,00 | 0,21 | 0,1887 | 0,1887 | |||||
| SAIC / Science Applications International Corporation | 0,00 | 0,00 | 0,20 | 0,50 | 0,1516 | −0,0279 | |||
| ZETA / Zeta Global Holdings Corp. | 0,01 | 0,20 | 0,1797 | 0,1797 | |||||
| PKE / Park Aerospace Corp. | 0,01 | 0,00 | 0,15 | 10,14 | 0,1391 | 0,0158 | |||
| ELAN / Elanco Animal Health Incorporated | 0,01 | 0,15 | 0,1364 | 0,1364 | |||||
| ORN / Orion Group Holdings, Inc. | 0,01 | 0,00 | 0,12 | 74,63 | 0,0880 | 0,0278 | |||
| HBI / Hanesbrands Inc. | 0,02 | 15,49 | 0,08 | −8,99 | 0,0611 | −0,0180 | |||
| UNH / UnitedHealth Group Incorporated | Call | 0,00 | 0,03 | 0,0285 | 0,0285 | ||||
| ZETA / Zeta Global Holdings Corp. | Call | 0,00 | 0,02 | 0,0170 | 0,0170 | ||||
| XTNT / Xtant Medical Holdings, Inc. | 0,02 | 0,00 | 0,01 | 55,56 | 0,0111 | 0,0027 | |||
| TMO / Thermo Fisher Scientific Inc. | 0,00 | −100,00 | 0,00 | 0,0000 | |||||
| DE / Deere & Company | 0,00 | −100,00 | 0,00 | 0,0000 | |||||
| CVS / CVS Health Corporation | 0,00 | −100,00 | 0,00 | 0,0000 | |||||
| LDOS / Leidos Holdings, Inc. | Call | 0,00 | −100,00 | 0,00 | −100,00 | −0,0240 | |||
| CVX / Chevron Corporation | 0,00 | −100,00 | 0,00 | 0,0000 | |||||
| LYG / Lloyds Banking Group plc - Depositary Receipt (Common Stock) | 0,00 | −100,00 | 0,00 | 0,0000 | |||||
| UFPI / UFP Industries, Inc. | 0,00 | −100,00 | 0,00 | 0,0000 | |||||
| TT / Trane Technologies plc | 0,00 | −100,00 | 0,00 | 0,0000 | |||||
| PFE / Pfizer Inc. | Call | 0,00 | −100,00 | 0,00 | −100,00 | −0,1126 | |||
| FI / Fiserv, Inc. | 0,00 | −100,00 | 0,00 | 0,0000 | |||||
| LMT / Lockheed Martin Corporation | 0,00 | −100,00 | 0,00 | 0,0000 |