Grundläggande statistik
| Institutionella ägare | 114 total, 113 long only, 0 short only, 1 long/short - change of −6,56% MRQ |
| Genomsnittlig portföljallokering | 0.1338 % - change of −27,97% MRQ |
| Institutionella aktier (lång) | 23 791 013 (ex 13D/G) - change of 4,01MM shares 20,28% MRQ |
| Institutionellt värde (lång) | $ 551 442 USD ($1000) |
Institutionellt ägande och aktieägare
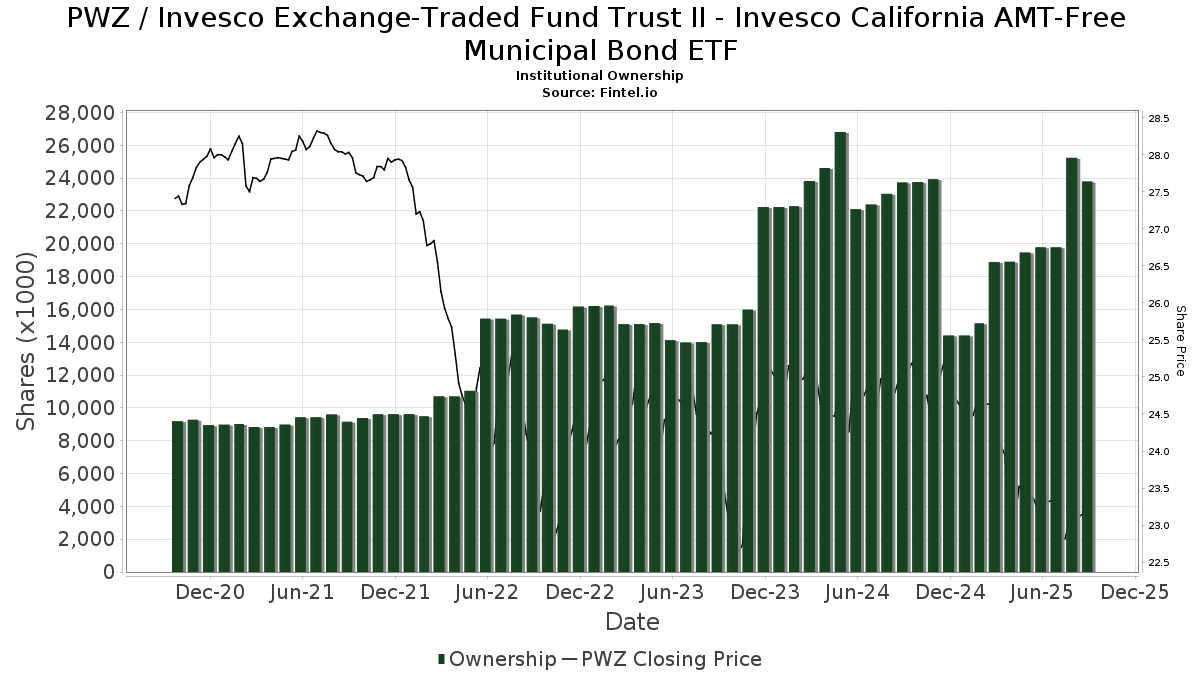
Invesco Exchange-Traded Fund Trust II - Invesco California AMT-Free Municipal Bond ETF (US:PWZ) har 114 Institutionella ägare och aktieägare som har lämnat in 13D/G- eller 13F-formulär till Securities Exchange Commission (SEC). Dessa institut innehar totalt 23,791,013 aktier. Största aktieägare inkluderar Wealthfront Advisers Llc, Miracle Mile Advisors, LLC, Stratos Wealth Partners, LTD., Mercer Global Advisors Inc /adv, Envestnet Asset Management Inc, Syon Capital Llc, Gerber Kawasaki Wealth & Investment Management, First Foundation Advisors, EP Wealth Advisors, Inc., and Bank Of America Corp /de/ .
Invesco Exchange-Traded Fund Trust II - Invesco California AMT-Free Municipal Bond ETF (ARCA:PWZ) Institutionell ägarstruktur visar institutioners och fonders nuvarande positioner i företaget, samt de senaste förändringarna i positionernas storlek. Större aktieägare kan vara enskilda investerare, fonder, hedgefonder eller institutioner. Bilaga 13D visar att investeraren äger (eller ägde) mer än 5% av företaget och avser (eller avsåg) att aktivt eftersträva en förändring av affärsstrategin. Schedule 13G indikerar en passiv investering på över 5%.
The share price as of September 8, 2025 is 23,71 / share. Previously, on September 9, 2024, the share price was 25,11 / share. This represents a decline of 5,58% over that period.
Fondsentimentets poäng
Fondsentimentet poängen(fka Ägarackumulation-poäng) visar vilka aktier som är mest köpta av fonder. Det är resultatet av en sofistikerad kvantitativ flerfaktormodell som identifierar företag med de högsta nivåerna av institutionell ackumulering. Poängsättningsmodellen använder en kombination av den totala ökningen av redovisade ägare, förändringarna i portföljallokeringarna för dessa ägare och andra mått. Siffran sträcker sig från 0 till 100, där högre siffror indikerar en högre nivå av ackumulering i förhållande till sina konkurrenter, och 50 är genomsnittet.
Uppdateringsfrekvens: Dagligen
Se Ownership Explorer, som innehåller en lista över de högst rankade företagen.
Institutionell sälj/köp-kvot
Förutom att rapportera vanliga eget kapital- och skuldemissioner måste institutioner med mer än 100MM tillgångar under förvaltning också avslöja sina innehav av sälj- och köpoptioner. Eftersom säljoptioner i allmänhet indikerar ett negativt sentiment och köpoptioner indikerar ett positivt sentiment, kan vi få en uppfattning om det övergripande institutionella sentimentet genom att plotta förhållandet mellan säljoptioner och köpoptioner. Diagrammet till höger visar det historiska förhållandet mellan sälj- och köpoptioner för detta instrument.
Genom att använda sälj/köp-kvoten som en indikator på aktieägarnas sentiment undviker man en av de största bristerna med att använda det totala institutionella ägandet, nämligen att en betydande del av de förvaltade tillgångarna investeras passivt för att följa index. Passivt förvaltade fonder köper vanligtvis inte optioner, så indikatorn för sälj/köp-kvoten ger en bättre bild av stämningen i aktivt förvaltade fonder.

13F- och NPORT-arkiveringar
Detaljer om 13F-arkiveringar är gratis. Detaljer om NP-arkiveringar kräver ett premiummedlemskap. Gröna rader indikerar nya positioner. Röda rader indikerar stängda positioner. Klicka på länk symbolen för att se hela transaktionshistoriken.
Uppgradera
för att låsa upp premiumdata och exportera till Excel ![]() .
.
| Fil Datum | Källa | Investerare | Typ | Genomsnittligt pris (beräknat) |
Aktier | Δ Aktier (%) |
Rapporterat värde (1000 USD) |
Δ Värde (%) |
Portföljallokering (%) |
|
|---|---|---|---|---|---|---|---|---|---|---|
| 2025-07-18 | 13F | Warren Street Wealth Advisors, LLC | 19 907 | −3,23 | 465 | −5,31 | ||||
| 2025-07-18 | 13F | Bartlett & Co. Wealth Management Llc | 3 747 | 162,03 | 87 | 155,88 | ||||
| 2025-08-12 | 13F | Jpmorgan Chase & Co | 165 571 | −58,64 | 3 864 | −59,53 | ||||
| 2025-08-13 | 13F | Dynamic Wealth Strategies, LLC | 9 717 | −71,64 | 227 | −72,34 | ||||
| 2025-05-15 | 13F/A | Orion Portfolio Solutions, LLC | 92 720 | −3,16 | 2 211 | −6,47 | ||||
| 2025-08-08 | 13F | Creative Planning | 18 359 | −20,33 | 428 | −22,04 | ||||
| 2025-08-08 | 13F | Crossmark Global Holdings, Inc. | 26 448 | −3,32 | 617 | −6,10 | ||||
| 2025-08-11 | 13F | Avantax Planning Partners, Inc. | 15 296 | −39,18 | 357 | −40,40 | ||||
| 2025-08-07 | 13F | Resources Investment Advisors, LLC. | 45 580 | −60,50 | 1 064 | −61,36 | ||||
| 2025-08-12 | 13F | Steward Partners Investment Advisory, Llc | 10 250 | −1,51 | 239 | −3,63 | ||||
| 2025-08-14 | 13F | BCS Private Wealth Management, Inc. | 20 000 | 0 | ||||||
| 2025-07-18 | 13F | SimpliFi, Inc. | 62 431 | 5,02 | 1 457 | 2,82 | ||||
| 2025-08-06 | 13F | Prospera Financial Services Inc | 43 213 | −3,92 | 1 009 | −5,97 | ||||
| 2025-07-28 | 13F | Elmwood Wealth Management, Inc. | 25 075 | 2,66 | 585 | 0,52 | ||||
| 2025-07-08 | 13F | Zrc Wealth Management, Llc | 3 018 | 0,87 | 70 | −1,41 | ||||
| 2025-08-14 | 13F | Hrt Financial Lp | 0 | −100,00 | 0 | |||||
| 2025-07-28 | 13F | Harbour Investments, Inc. | 407 | 0,00 | 9 | 0,00 | ||||
| 2025-08-01 | 13F | Rossby Financial, LCC | 10 000 | 0,00 | 233 | 0,00 | ||||
| 2025-08-12 | 13F | Global Retirement Partners, LLC | 12 545 | −40,61 | 293 | −43,95 | ||||
| 2025-08-14 | 13F | First Foundation Advisors | 952 878 | −14,55 | 22 240 | −16,37 | ||||
| 2025-08-14 | 13F | Dimension Capital Management Llc | 26 232 | 0,00 | 612 | −2,08 | ||||
| 2025-08-04 | 13F | Bristlecone Advisors, LLC | 0 | −100,00 | 0 | |||||
| 2025-08-14 | 13F | Royal Bank Of Canada | 10 178 | −45,60 | 238 | −46,64 | ||||
| 2025-08-14 | 13F | UBS Group AG | 102 562 | 13,76 | 2 394 | 11,30 | ||||
| 2025-08-01 | 13F | Envestnet Asset Management Inc | 1 666 448 | 16,82 | 38 895 | 14,32 | ||||
| 2025-07-14 | 13F | Parkshore Wealth Management, Inc. | 11 170 | −45,59 | 261 | −46,83 | ||||
| 2025-08-15 | 13F | CI Private Wealth, LLC | 9 729 | 227 | ||||||
| 2025-04-25 | 13F | Avidian Wealth Solutions, LLC | 0 | −100,00 | 0 | |||||
| 2025-07-23 | 13F | Steel Peak Wealth Management LLC | 120 397 | 6,84 | 2 810 | 4,58 | ||||
| 2025-08-14 | 13F | Fmr Llc | 69 951 | −65,84 | 1 633 | −66,58 | ||||
| 2025-07-14 | 13F | Sweeney & Michel, Llc | 20 000 | −9,09 | 464 | −7,21 | ||||
| 2025-07-11 | 13F | Farther Finance Advisors, LLC | 8 100 | 0,00 | 189 | −2,58 | ||||
| 2025-08-11 | 13F | GKV Capital Management Co., Inc. | 0 | −100,00 | 0 | −100,00 | ||||
| 2025-08-14 | 13F | Abound Financial, Llc | 0 | −100,00 | 0 | |||||
| 2025-07-09 | 13F | FOCUS Wealth Advisors, LLC | 39 404 | 5,73 | 920 | 3,49 | ||||
| 2025-07-25 | 13F | Lodestar Private Asset Management Llc | 62 801 | −21,35 | 1 466 | −23,06 | ||||
| 2025-08-12 | 13F | LPL Financial LLC | 582 260 | 0,72 | 13 590 | −1,44 | ||||
| 2025-07-29 | 13F | Werba Rubin Papier Wealth Management | 0 | −100,00 | 0 | |||||
| 2025-07-24 | 13F | Williams & Novak, LLC | 39 800 | 5,57 | 929 | 2,54 | ||||
| 2025-07-22 | 13F | McNaughton Wealth Management, LLC | 84 576 | 26,34 | 1 974 | 23,68 | ||||
| 2025-08-08 | 13F | Larson Financial Group LLC | 2 650 | 0,00 | 62 | −3,17 | ||||
| 2025-08-12 | 13F | Waddell & Associates, Llc | 14 125 | 0,00 | 330 | −2,08 | ||||
| 2025-07-11 | 13F | Myecfo, Llc | 0 | −100,00 | 0 | |||||
| 2025-07-09 | 13F | Affinity Capital Advisors, LLC | 53 170 | −71,99 | 1 241 | −71,48 | ||||
| 2025-07-31 | 13F | Wealthfront Advisers Llc | 5 171 896 | 3 414,50 | 120 712 | 3 340,07 | ||||
| 2025-07-31 | 13F | Cambridge Investment Research Advisors, Inc. | 47 378 | −9,32 | 1 | 0,00 | ||||
| 2025-08-04 | 13F | Keybank National Association/oh | 117 570 | 4,75 | 2 744 | 2,54 | ||||
| 2025-08-11 | 13F | Root Financial Partners, LLC | 10 240 | 239 | ||||||
| 2025-08-14 | 13F | Mercer Global Advisors Inc /adv | 1 667 055 | 15,82 | 38 909 | 13,34 | ||||
| 2025-08-08 | 13F | Omega Financial Group, LLC | 25 044 | 0,56 | 585 | −1,52 | ||||
| 2025-06-23 | NP | SRCMX - California Municipal Fund Class A | 500 | 0,00 | 12 | −8,33 | ||||
| 2025-09-04 | 13F/A | Advisor Group Holdings, Inc. | 60 698 | 382,73 | 1 417 | 373,58 | ||||
| 2025-08-05 | 13F | Tme Financial, Inc. | 12 375 | −35,77 | 289 | −37,25 | ||||
| 2025-08-07 | 13F | Allworth Financial LP | 134 636 | −27,65 | 3 142 | −27,62 | ||||
| 2025-08-26 | 13F | Nautilus Advisors LLC | 37 520 | 0,00 | 876 | −2,13 | ||||
| 2025-08-07 | 13F | Hennion & Walsh Asset Management, Inc. | 40 803 | 21,58 | 952 | 19,00 | ||||
| 2025-08-13 | 13F | Kayne Anderson Rudnick Investment Management Llc | 11 405 | 266 | ||||||
| 2025-04-17 | 13F | Cliftonlarsonallen Wealth Advisors, Llc | 0 | −100,00 | 0 | |||||
| 2025-05-15 | 13F | Tower Research Capital LLC (TRC) | 0 | −100,00 | 0 | |||||
| 2025-08-08 | 13F | Laurel Wealth Planning LLC | 9 749 | −5,24 | 228 | −7,35 | ||||
| 2025-07-21 | 13F | Impact Investors, Inc | 81 431 | −8,58 | 1 901 | −10,55 | ||||
| 2025-08-13 | 13F | EverSource Wealth Advisors, LLC | 1 238 | 0,90 | 29 | −3,45 | ||||
| 2025-08-11 | 13F | First American Trust, Fsb | 262 226 | −19,25 | 6 120 | −20,98 | ||||
| 2025-08-13 | 13F | Fisher Asset Management, LLC | 26 000 | 0,00 | 607 | −2,26 | ||||
| 2025-05-15 | 13F | GWM Advisors LLC | 0 | −100,00 | 0 | −100,00 | ||||
| 2025-08-12 | 13F | Journey Strategic Wealth Llc | 24 275 | −67,73 | 567 | −68,45 | ||||
| 2025-07-21 | 13F | Ameriflex Group, Inc. | 1 499 | 0,00 | 35 | −2,86 | ||||
| 2025-08-07 | 13F | Shared Vision Wealth Group LLC | 18 309 | 419 | ||||||
| 2025-08-06 | 13F | Atlas Legacy Advisors, LLC | 17 663 | −96,03 | 412 | −96,13 | ||||
| 2025-08-14 | 13F | Raymond James Financial Inc | 17 903 | −29,33 | 418 | −30,96 | ||||
| 2025-08-13 | 13F | Townsquare Capital Llc | 0 | −100,00 | 0 | |||||
| 2025-08-14 | 13F | Syon Capital Llc | 1 351 618 | 28,95 | 31 547 | 26,19 | ||||
| 2025-07-31 | 13F | Brighton Jones Llc | 0 | −100,00 | 0 | |||||
| 2025-08-15 | 13F | Morgan Stanley | 616 353 | −3,67 | 14 386 | −5,73 | ||||
| 2025-07-24 | 13F | IFP Advisors, Inc | 287 | 0,00 | 7 | 0,00 | ||||
| 2025-07-08 | 13F | Parallel Advisors, LLC | 40 | 0,00 | 1 | |||||
| 2025-08-06 | 13F | Climber Capital SA | 16 395 | 0,00 | 381 | 13,10 | ||||
| 2025-08-13 | 13F | Jones Financial Companies Lllp | 42 338 | 212,27 | 985 | 205,90 | ||||
| 2025-08-14 | 13F | Stifel Financial Corp | 17 416 | −23,82 | 406 | −25,50 | ||||
| 2025-08-13 | 13F | Guggenheim Capital Llc | 282 428 | 66,74 | 6 592 | 63,18 | ||||
| 2025-08-13 | 13F | WCG Wealth Advisors LLC | 11 204 | 262 | ||||||
| 2025-08-14 | 13F | Destination Wealth Management | 35 256 | 0,00 | 823 | −2,14 | ||||
| 2025-08-14 | 13F | Jane Street Group, Llc | 489 526 | 82,27 | 11 426 | 78,38 | ||||
| 2025-07-22 | 13F | Miracle Mile Advisors, LLC | 2 569 651 | 1,94 | 59 976 | −0,24 | ||||
| 2025-08-13 | 13F | Flow Traders U.s. Llc | 0 | −100,00 | 0 | |||||
| 2025-07-28 | 13F | WealthPlan Investment Management, LLC | 23 996 | 560 | ||||||
| 2025-08-14 | 13F | EP Wealth Advisors, Inc. | 834 086 | −3,84 | 19 468 | −5,90 | ||||
| 2025-08-14 | 13F | Smartleaf Asset Management LLC | 1 | 0,00 | 0 | |||||
| 2025-07-21 | 13F | Ameritas Advisory Services, LLC | 0 | −100,00 | 0 | |||||
| 2025-07-30 | 13F | Clifford Swan Investment Counsel Llc | 10 300 | 0,00 | 240 | −2,04 | ||||
| 2025-08-14 | 13F | Integrated Wealth Concepts LLC | 38 594 | 6,26 | 901 | 3,93 | ||||
| 2025-08-14 | 13F | Mariner, LLC | 151 990 | 17,58 | 3 547 | 15,09 | ||||
| 2025-08-08 | 13F | Avantax Advisory Services, Inc. | 16 332 | −1,72 | 381 | −3,79 | ||||
| 2025-08-14 | 13F | Ameriprise Financial Inc | 75 445 | −80,99 | 1 761 | −81,44 | ||||
| 2025-08-14 | 13F | Susquehanna International Group, Llp | 10 164 | −97,04 | 237 | −97,10 | ||||
| 2025-08-14 | 13F | C M Bidwell & Associates Ltd | 22 132 | 0,00 | 517 | −2,09 | ||||
| 2025-08-14 | 13F | Citadel Advisors Llc | Call | 44 500 | 244,96 | 1 039 | 238,11 | |||
| 2025-08-11 | 13F | Amara Financial, Llc. | 0 | −100,00 | 0 | |||||
| 2025-08-14 | 13F | Citadel Advisors Llc | 51 652 | −22,15 | 1 206 | −23,83 | ||||
| 2025-08-14 | 13F | Atomi Financial Group, Inc. | 64 646 | 47,76 | 1 509 | 44,58 | ||||
| 2025-08-14 | 13F | Citadel Advisors Llc | Put | 18 600 | 434 | |||||
| 2025-07-17 | 13F | Keystone Global Partners, LLC | 0 | −100,00 | 0 | |||||
| 2025-08-11 | 13F | Tidemark, LLC | 0 | −100,00 | 0 | |||||
| 2025-08-13 | 13F | Twin Peaks Wealth Advisors, LLC | 10 106 | 0,00 | 234 | −0,85 | ||||
| 2025-08-14 | 13F | Gerber Kawasaki Wealth & Investment Management | 1 219 896 | −7,08 | 28 472 | −9,07 | ||||
| 2025-07-24 | 13F | Robertson Stephens Wealth Management, LLC | 23 848 | 0,00 | 557 | −2,11 | ||||
| 2025-08-14 | 13F | Foronjy Financial Llc | 9 851 | 230 | ||||||
| 2025-08-04 | 13F | Creative Financial Designs Inc /adv | 3 000 | 0,00 | 70 | −1,41 | ||||
| 2025-08-14 | 13F | Quantinno Capital Management LP | 28 144 | 657 | ||||||
| 2025-07-29 | 13F | Stratos Wealth Partners, LTD. | 1 830 367 | 2,08 | 42 721 | −0,10 | ||||
| 2025-07-14 | 13F | GAMMA Investing LLC | 12 129 | −38,47 | 283 | −39,79 | ||||
| 2025-08-12 | 13F | Ameritas Investment Partners, Inc. | 3 241 | 0,46 | 76 | −1,32 | ||||
| 2025-08-14 | 13F | Comerica Bank | 8 395 | 0,00 | 196 | −2,50 | ||||
| 2025-07-14 | 13F | S.A. Mason LLC | 1 300 | 0,00 | 30 | −3,23 | ||||
| 2025-08-06 | 13F | Commonwealth Equity Services, Llc | 91 809 | 67,72 | 2 | 100,00 | ||||
| 2025-07-18 | 13F | Pure Financial Advisors, Inc. | 304 528 | 402,70 | 7 108 | 392,17 | ||||
| 2025-08-14 | 13F | Warren Averett Asset Management, LLC | 0 | −100,00 | 0 | |||||
| 2025-08-27 | 13F/A | Brinker Capital Investments, LLC | 86 562 | −6,64 | 2 020 | −8,64 | ||||
| 2025-08-11 | 13F | FSA Wealth Management LLC | 592 | 14 | ||||||
| 2025-07-24 | 13F | Us Bancorp \de\ | 2 055 | 0,00 | 48 | −4,08 | ||||
| 2025-08-12 | 13F | Main Management LLC | 4 705 | −0,84 | 0 | |||||
| 2025-07-07 | 13F | Versant Capital Management, Inc | 370 | 0,00 | 9 | 0,00 | ||||
| 2025-05-15 | 13F | Old Mission Capital Llc | 0 | −100,00 | 0 | −100,00 | ||||
| 2025-07-22 | 13F | Hill Island Financial Llc | 8 858 | 0,29 | 207 | −1,90 | ||||
| 2025-08-13 | 13F | Cerity Partners LLC | 0 | −100,00 | 0 | |||||
| 2025-08-11 | 13F | Elequin Capital Lp | 0 | −100,00 | 0 | |||||
| 2025-08-15 | 13F | Equitable Holdings, Inc. | 20 851 | −33,76 | 487 | −35,20 | ||||
| 2025-07-21 | 13F | Mattern Capital Management, Llc | 29 340 | 4,26 | 685 | 1,94 | ||||
| 2025-07-14 | 13F | Southland Equity Partners LLC | 9 950 | 0,00 | 232 | −2,11 | ||||
| 2025-08-06 | 13F | Golden State Wealth Management, LLC | 1 821 | 0,00 | 43 | −2,33 | ||||
| 2025-07-22 | 13F | Verus Wealth Management, Llc | 0 | −100,00 | 0 | |||||
| 2025-08-11 | 13F | HighTower Advisors, LLC | 63 159 | 1,89 | 1 474 | −0,27 | ||||
| 2025-08-14 | 13F | Bank Of America Corp /de/ | 698 813 | −18,66 | 16 310 | −20,40 | ||||
| 2025-08-12 | 13F | NWF Advisory Services Inc. | 23 151 | −43,06 | 552 | −45,02 | ||||
| 2025-08-08 | 13F | Cetera Investment Advisers | 20 568 | 5,30 | 480 | 3,23 | ||||
| 2025-07-22 | 13F | Wealthcare Advisory Partners LLC | 0 | −100,00 | 0 | |||||
| 2025-08-11 | 13F | Greykasell Wealth Strategies, Inc. | 43 108 | 0,99 | 1 006 | −1,18 | ||||
| 2025-04-22 | 13F | Spinnaker Investment Group, LLC | 0 | −100,00 | 0 | |||||
| 2025-08-11 | 13F | NewEdge Wealth, LLC | 0 | −100,00 | 0 | |||||
| 2025-08-12 | 13F | Charles Schwab Investment Management Inc | 0 | −100,00 | 0 | |||||
| 2025-07-24 | 13F | Certus Wealth Management, LLC | 17 309 | 404 | ||||||
| 2025-08-12 | 13F | Proequities, Inc. | 0 | 0 | ||||||
| 2025-08-14 | 13F | Wells Fargo & Company/mn | 223 209 | −31,58 | 5 210 | −33,05 |