Grundläggande statistik
| Institutionella ägare | 170 total, 170 long only, 0 short only, 0 long/short - change of 4,91% MRQ |
| Genomsnittlig portföljallokering | 0.1433 % - change of −9,05% MRQ |
| Institutionella aktier (lång) | 12 099 795 (ex 13D/G) - change of 0,57MM shares 4,96% MRQ |
| Institutionellt värde (lång) | $ 702 460 USD ($1000) |
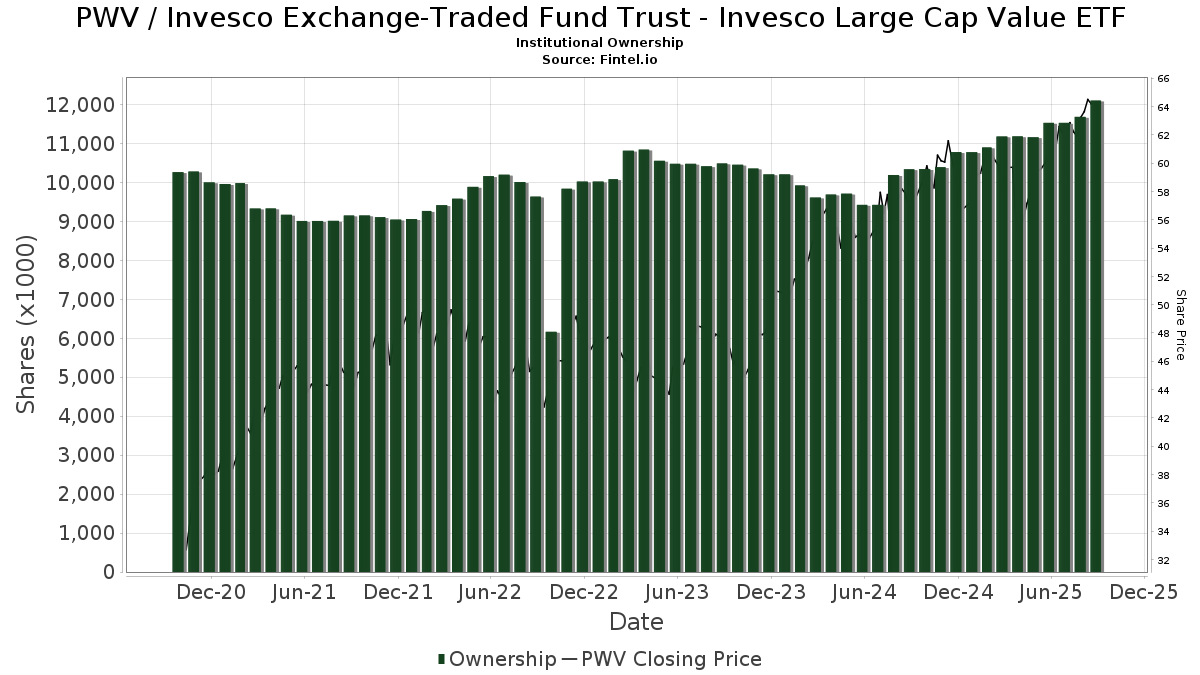
Institutionellt ägande och aktieägare
Invesco Exchange-Traded Fund Trust - Invesco Large Cap Value ETF (US:PWV) har 170 Institutionella ägare och aktieägare som har lämnat in 13D/G- eller 13F-formulär till Securities Exchange Commission (SEC). Dessa institut innehar totalt 12,099,795 aktier. Största aktieägare inkluderar Morgan Stanley, LPL Financial LLC, Bank Of America Corp /de/, Pnc Financial Services Group, Inc., UBS Group AG, Commonwealth Equity Services, Llc, Atlas Private Wealth Advisors, IAG Wealth Partners, LLC, Raymond James Financial Inc, and Envestnet Asset Management Inc .
Invesco Exchange-Traded Fund Trust - Invesco Large Cap Value ETF (ARCA:PWV) Institutionell ägarstruktur visar institutioners och fonders nuvarande positioner i företaget, samt de senaste förändringarna i positionernas storlek. Större aktieägare kan vara enskilda investerare, fonder, hedgefonder eller institutioner. Bilaga 13D visar att investeraren äger (eller ägde) mer än 5% av företaget och avser (eller avsåg) att aktivt eftersträva en förändring av affärsstrategin. Schedule 13G indikerar en passiv investering på över 5%.
The share price as of September 12, 2025 is 64,75 / share. Previously, on September 13, 2024, the share price was 57,38 / share. This represents an increase of 12,85% over that period.
Fondsentimentets poäng
Fondsentimentet poängen(fka Ägarackumulation-poäng) visar vilka aktier som är mest köpta av fonder. Det är resultatet av en sofistikerad kvantitativ flerfaktormodell som identifierar företag med de högsta nivåerna av institutionell ackumulering. Poängsättningsmodellen använder en kombination av den totala ökningen av redovisade ägare, förändringarna i portföljallokeringarna för dessa ägare och andra mått. Siffran sträcker sig från 0 till 100, där högre siffror indikerar en högre nivå av ackumulering i förhållande till sina konkurrenter, och 50 är genomsnittet.
Uppdateringsfrekvens: Dagligen
Se Ownership Explorer, som innehåller en lista över de högst rankade företagen.
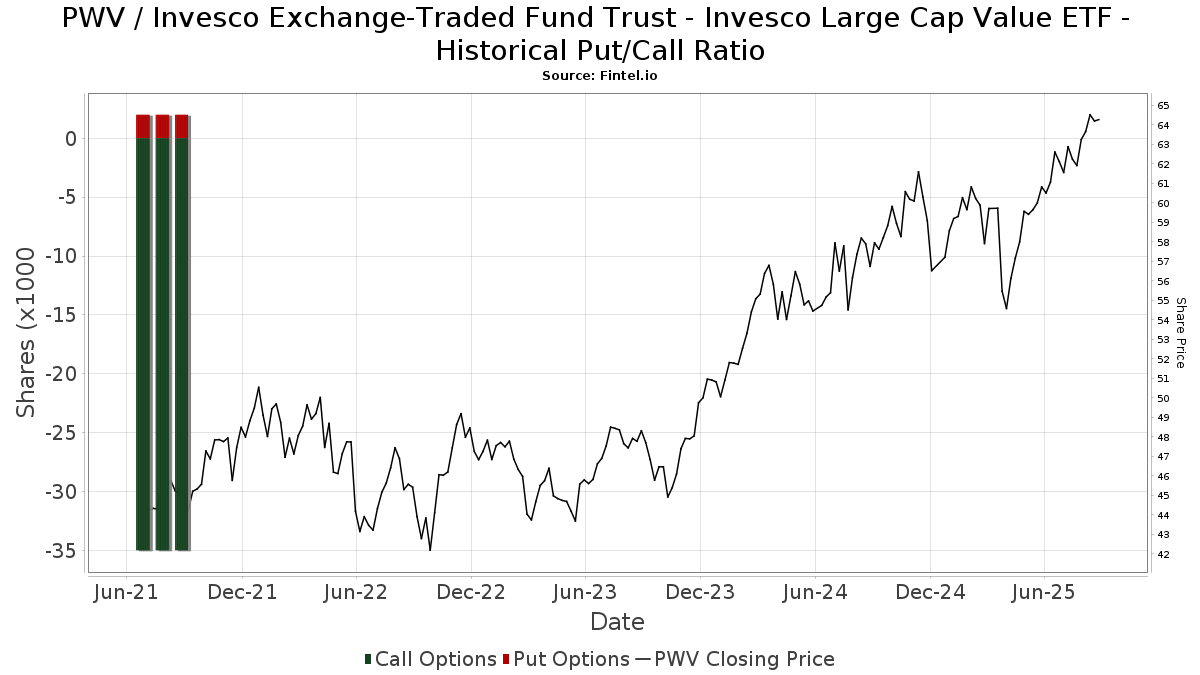
Institutionell sälj/köp-kvot
Förutom att rapportera vanliga eget kapital- och skuldemissioner måste institutioner med mer än 100MM tillgångar under förvaltning också avslöja sina innehav av sälj- och köpoptioner. Eftersom säljoptioner i allmänhet indikerar ett negativt sentiment och köpoptioner indikerar ett positivt sentiment, kan vi få en uppfattning om det övergripande institutionella sentimentet genom att plotta förhållandet mellan säljoptioner och köpoptioner. Diagrammet till höger visar det historiska förhållandet mellan sälj- och köpoptioner för detta instrument.
Genom att använda sälj/köp-kvoten som en indikator på aktieägarnas sentiment undviker man en av de största bristerna med att använda det totala institutionella ägandet, nämligen att en betydande del av de förvaltade tillgångarna investeras passivt för att följa index. Passivt förvaltade fonder köper vanligtvis inte optioner, så indikatorn för sälj/köp-kvoten ger en bättre bild av stämningen i aktivt förvaltade fonder.
13F- och NPORT-arkiveringar
Detaljer om 13F-arkiveringar är gratis. Detaljer om NP-arkiveringar kräver ett premiummedlemskap. Gröna rader indikerar nya positioner. Röda rader indikerar stängda positioner. Klicka på länk symbolen för att se hela transaktionshistoriken.
Uppgradera
för att låsa upp premiumdata och exportera till Excel ![]() .
.
| Fil Datum | Källa | Investerare | Typ | Genomsnittligt pris (beräknat) |
Aktier | Δ Aktier (%) |
Rapporterat värde (1000 USD) |
Δ Värde (%) |
Portföljallokering (%) |
|
|---|---|---|---|---|---|---|---|---|---|---|
| 2025-08-08 | 13F | Cetera Investment Advisers | 75 311 | 103,85 | 4 680 | 112,88 | ||||
| 2025-08-08 | 13F | Capital Investment Advisory Services, LLC | 670 | 0,00 | 42 | 5,13 | ||||
| 2025-07-28 | 13F | Nestegg Advisors, Inc. | 3 630 | 0,72 | 226 | 5,14 | ||||
| 2025-08-12 | 13F | DiMeo Schneider & Associates, L.L.C. | 15 465 | 0,00 | 961 | 4,35 | ||||
| 2025-08-12 | 13F | BlackRock, Inc. | 2 000 | 0,00 | 124 | 4,20 | ||||
| 2025-08-12 | 13F | Howe & Rusling Inc | 2 694 | 167 | ||||||
| 2025-08-14 | 13F | Bnp Paribas Arbitrage, Sa | 10 000 | −50,00 | 621 | −47,82 | ||||
| 2025-07-10 | 13F | Wealth Enhancement Advisory Services, Llc | 24 258 | 241,18 | 1 526 | 260,76 | ||||
| 2025-08-14 | 13F | Bank Of America Corp /de/ | 774 088 | 20,94 | 48 102 | 26,29 | ||||
| 2025-08-14 | 13F | Comerica Bank | 15 471 | −7,17 | 961 | −3,03 | ||||
| 2025-08-12 | 13F | Franklin Resources Inc | 299 | 0,00 | 19 | 5,88 | ||||
| 2025-08-05 | 13F | AGH Wealth Advisors, LLC | 46 317 | 0,83 | 2 879 | 5,27 | ||||
| 2025-08-08 | 13F | Emerald Investment Partners, Llc | 5 953 | −10,79 | 370 | −7,05 | ||||
| 2025-07-10 | 13F | Wedmont Private Capital | 6 223 | 0,00 | 386 | 14,20 | ||||
| 2025-08-14 | 13F | Beacon Investment Advisors Llc | 4 095 | −0,68 | 253 | 2,86 | ||||
| 2025-07-24 | 13F | JNBA Financial Advisors | 20 777 | −2,29 | 1 291 | 2,06 | ||||
| 2025-08-11 | 13F | Western Wealth Management, LLC | 16 368 | −0,30 | 1 017 | 4,09 | ||||
| 2025-08-12 | 13F | O'shaughnessy Asset Management, Llc | 292 | 0,00 | 18 | 5,88 | ||||
| 2025-07-18 | 13F | SimpliFi, Inc. | 9 003 | 0,72 | 559 | 5,27 | ||||
| 2025-07-22 | 13F | IVC Wealth Advisors LLC | 4 290 | 0,00 | 267 | 4,31 | ||||
| 2025-08-12 | 13F | Global Retirement Partners, LLC | 1 552 | 0,00 | 96 | 9,09 | ||||
| 2025-08-11 | 13F | HighTower Advisors, LLC | 16 215 | −0,47 | 1 008 | 3,92 | ||||
| 2025-08-14 | 13F | EP Wealth Advisors, Inc. | 3 155 | 0,00 | 196 | 4,81 | ||||
| 2025-08-14 | 13F | Paragon Private Wealth Management, LLC | 14 265 | 0,00 | 886 | 4,48 | ||||
| 2025-08-12 | 13F | Steward Partners Investment Advisory, Llc | 1 536 | 0,00 | 95 | 4,40 | ||||
| 2025-07-24 | 13F | Eastern Bank | 1 710 | 0,00 | 106 | 4,95 | ||||
| 2025-07-08 | 13F | Morris Retirement Advisors, LLC | 3 675 | 0,55 | 228 | 5,07 | ||||
| 2025-08-14 | 13F | Harmony Asset Management Llc | 8 329 | 0,23 | 518 | 4,66 | ||||
| 2025-08-08 | 13F | Creative Planning | 9 765 | 0,05 | 607 | 4,48 | ||||
| 2025-08-18 | 13F | Geneos Wealth Management Inc. | 6 932 | 0,06 | 431 | 4,37 | ||||
| 2025-07-18 | 13F | Consolidated Planning Corp | 16 251 | −0,71 | 1 010 | 3,59 | ||||
| 2025-08-14 | 13F | Susquehanna International Group, Llp | 0 | −100,00 | 0 | |||||
| 2025-07-14 | 13F | Ridgewood Investments LLC | 350 | 0,00 | 22 | 5,00 | ||||
| 2025-08-08 | 13F | Good Life Advisors, LLC | 85 573 | 10,50 | 5 317 | 15,39 | ||||
| 2025-08-11 | 13F | Private Advisor Group, LLC | 18 662 | 2,44 | 1 160 | 6,92 | ||||
| 2025-08-14 | 13F | Qube Research & Technologies Ltd | 40 | 0,00 | 2 | 0,00 | ||||
| 2025-08-08 | 13F | Condor Capital Management | 14 937 | 0,00 | 928 | 4,50 | ||||
| 2025-08-15 | 13F | Kestra Advisory Services, LLC | 153 455 | 9,09 | 9 536 | 13,92 | ||||
| 2025-08-15 | 13F | Cooksen Wealth, LLC | 51 511 | −1,53 | 3 201 | 7,96 | ||||
| 2025-09-04 | 13F | Beacon Capital Management, Inc. | 1 023 | 64 | ||||||
| 2025-07-24 | 13F | MSH Capital Advisors LLC | 11 887 | −12,32 | 739 | −8,44 | ||||
| 2025-08-12 | 13F | LPL Financial LLC | 1 371 551 | 12,39 | 85 228 | 17,36 | ||||
| 2025-08-07 | 13F | Alpha Cubed Investments, LLC | 5 371 | 18,49 | 334 | 23,79 | ||||
| 2025-07-31 | 13F | Cambridge Investment Research Advisors, Inc. | 77 601 | 33,39 | 5 | 33,33 | ||||
| 2025-07-17 | 13F | Greenleaf Trust | 5 388 | 0,00 | 335 | 4,38 | ||||
| 2025-07-31 | 13F | Oak Harbor Wealth Partners, Llc | 1 175 | 0,00 | 73 | 5,80 | ||||
| 2025-08-14 | 13F | Mercer Global Advisors Inc /adv | 18 658 | −2,09 | 1 159 | 2,20 | ||||
| 2025-07-24 | 13F | IFP Advisors, Inc | 200 | 0,00 | 12 | 9,09 | ||||
| 2025-07-24 | 13F | Blair William & Co/il | 1 325 | −1,85 | 82 | 2,50 | ||||
| 2025-08-08 | 13F | Hartland & Co., LLC | 8 133 | 0,17 | 505 | 4,55 | ||||
| 2025-08-12 | 13F | J.w. Cole Advisors, Inc. | 5 340 | −5,99 | 332 | −2,07 | ||||
| 2025-08-13 | 13F | IAG Wealth Partners, LLC | 310 057 | 6,90 | 19 267 | 11,63 | ||||
| 2025-08-13 | 13F | Cerity Partners LLC | 4 407 | 0,23 | 274 | 4,60 | ||||
| 2025-07-22 | 13F | Grimes & Company, Inc. | 3 871 | 0,00 | 241 | 4,35 | ||||
| 2025-07-25 | 13F | Cwm, Llc | 2 396 | 0,67 | 0 | |||||
| 2025-08-06 | 13F | Commonwealth Equity Services, Llc | 479 940 | 6,93 | 30 | 11,54 | ||||
| 2025-08-15 | 13F | Morgan Stanley | 3 735 207 | 0,05 | 232 106 | 4,47 | ||||
| 2025-07-21 | 13F | Ameritas Advisory Services, LLC | 14 963 | −40,37 | 930 | −35,62 | ||||
| 2025-08-13 | 13F | Northwestern Mutual Wealth Management Co | 23 909 | 6,09 | 1 486 | 10,74 | ||||
| 2025-08-14 | 13F | Evercore Wealth Management, LLC | 17 782 | 0,00 | 1 105 | 4,35 | ||||
| 2025-07-11 | 13F | Farther Finance Advisors, LLC | 4 129 | 8,49 | 257 | 13,78 | ||||
| 2025-08-14 | 13F | Royal Bank Of Canada | 141 194 | −4,49 | 8 774 | −0,27 | ||||
| 2025-07-18 | 13F | Institute for Wealth Management, LLC. | 14 314 | −2,05 | 889 | 2,30 | ||||
| 2025-08-07 | 13F | Resources Investment Advisors, LLC. | 4 207 | −13,08 | 261 | −9,37 | ||||
| 2025-08-14 | 13F | Wharton Business Group, LLC | 170 370 | −4,88 | 11 | 0,00 | ||||
| 2025-07-08 | 13F | Parallel Advisors, LLC | 35 150 | 0,00 | 2 184 | 4,45 | ||||
| 2025-09-04 | 13F/A | Advisor Group Holdings, Inc. | 126 878 | 8,11 | 7 886 | 12,88 | ||||
| 2025-08-15 | 13F | Tower Research Capital LLC (TRC) | 737 | −31,76 | 46 | −29,69 | ||||
| 2025-07-16 | 13F | Wealth Group Ltd | 3 300 | 205 | ||||||
| 2025-08-04 | 13F | Assetmark, Inc | 413 | 0,00 | 26 | 4,17 | ||||
| 2025-05-13 | 13F | PFG Private Wealth Management, LLC | 0 | −100,00 | 0 | |||||
| 2025-08-14 | 13F | Wells Fargo & Company/mn | 174 323 | 11,81 | 10 832 | 16,75 | ||||
| 2025-08-08 | 13F | Tanglewood Legacy Advisors, LLC | 517 | 0,00 | 32 | 6,67 | ||||
| 2025-07-15 | 13F | MCF Advisors LLC | 6 500 | 0,00 | 404 | 4,40 | ||||
| 2025-08-14 | 13F | Main Street Financial Solutions, LLC | 39 322 | −0,25 | 2 443 | 4,13 | ||||
| 2025-07-29 | 13F | Goldstein Advisors, LLC | 4 460 | 0,00 | 277 | 4,53 | ||||
| 2025-08-14 | 13F | Garden State Investment Advisory Services LLC | 3 630 | 0,39 | 226 | 4,65 | ||||
| 2025-08-13 | 13F | Northern Trust Corp | 0 | −100,00 | 0 | |||||
| 2025-08-06 | 13F | Prospera Financial Services Inc | 7 576 | −0,24 | 471 | 4,21 | ||||
| 2025-08-14 | 13F | GWM Advisors LLC | 247 | −55,33 | 15 | −53,12 | ||||
| 2025-08-13 | 13F | Summit Financial, LLC | 4 619 | 287 | ||||||
| 2025-08-14 | 13F | Ameriprise Financial Inc | 56 163 | −3,37 | 3 490 | 0,90 | ||||
| 2025-08-06 | 13F | AE Wealth Management LLC | 1 192 | 0,00 | 74 | 5,71 | ||||
| 2025-05-15 | 13F | Newbridge Financial Services Group, Inc. | 0 | −100,00 | 0 | |||||
| 2025-07-08 | 13F | Nbc Securities, Inc. | 650 | 0,00 | 0 | |||||
| 2025-07-29 | 13F | Private Trust Co Na | 3 263 | 262,15 | 203 | 281,13 | ||||
| 2025-08-14 | 13F | Goldman Sachs Group Inc | 0 | −100,00 | 0 | |||||
| 2025-07-07 | 13F | Wesbanco Bank Inc | 4 569 | 0,00 | 284 | 4,43 | ||||
| 2025-08-11 | 13F | Mill Creek Capital Advisors, LLC | 69 013 | 0,00 | 4 288 | 4,43 | ||||
| 2025-08-14 | 13F | Smartleaf Asset Management LLC | 516 | 0,00 | 32 | 3,33 | ||||
| 2025-08-05 | 13F | Key FInancial Inc | 2 785 | 0,00 | 173 | 4,85 | ||||
| 2025-04-29 | 13F | Bank of New York Mellon Corp | 0 | −100,00 | 0 | |||||
| 2025-08-05 | 13F | Prosperity Consulting Group, LLC | 26 498 | 0,00 | 1 647 | 4,44 | ||||
| 2025-08-12 | 13F | TCTC Holdings, LLC | 6 547 | 0,00 | 407 | 4,37 | ||||
| 2025-08-14 | 13F | Benjamin Edwards Inc | 9 808 | 0,00 | 609 | 4,46 | ||||
| 2025-07-15 | 13F | Fifth Third Bancorp | 518 | 0,00 | 32 | 6,67 | ||||
| 2025-08-06 | 13F | SOUTH STATE Corp | 695 | 0,00 | 43 | 4,88 | ||||
| 2025-07-25 | 13F | Evolution Advisers, Inc. | 24 300 | 0,00 | 2 | 0,00 | ||||
| 2025-08-12 | 13F | NFP Retirement, Inc. | 11 315 | 0,00 | 703 | 4,46 | ||||
| 2025-07-24 | 13F | Stonebridge Financial Group, LLC | 107 396 | −0,92 | 6 674 | 3,46 | ||||
| 2025-08-08 | 13F | Horizon Family Wealth, Inc. | 51 664 | 0,71 | 3 210 | 5,18 | ||||
| 2025-04-21 | 13F | O'Dell Group, LLC | 0 | −100,00 | 0 | |||||
| 2025-08-06 | 13F | True Wealth Design, LLC | 5 206 | 0,00 | 324 | 4,53 | ||||
| 2025-08-12 | 13F | Bedel Financial Consulting, Inc. | 8 832 | 0,00 | 549 | 7,87 | ||||
| 2025-07-11 | 13F | Seacrest Wealth Management, Llc | 4 168 | −4,49 | 259 | 0,00 | ||||
| 2025-08-12 | 13F | Jpmorgan Chase & Co | 44 544 | 49,75 | 2 768 | 56,33 | ||||
| 2025-08-07 | 13F | Commerce Bank | 4 119 | 0,00 | 256 | 4,08 | ||||
| 2025-08-14 | 13F | UBS Group AG | 497 818 | −0,22 | 30 934 | 4,19 | ||||
| 2025-08-07 | 13F | Retirement Investment Advisors, Inc. | 10 393 | −0,08 | 646 | 4,37 | ||||
| 2025-07-23 | 13F | Armbruster Capital Management, Inc. | 10 117 | 0,00 | 629 | 4,32 | ||||
| 2025-08-11 | 13F | Bellwether Advisors, LLC | 430 | 0,70 | 27 | 4,00 | ||||
| 2025-08-01 | 13F | Envestnet Asset Management Inc | 194 151 | 4,24 | 12 065 | 8,85 | ||||
| 2025-08-13 | 13F | EverSource Wealth Advisors, LLC | 1 295 | 0,00 | 80 | 3,90 | ||||
| 2025-07-11 | 13F | Ullmann Financial Group, Inc. | 110 267 | 0,02 | 6 852 | 4,45 | ||||
| 2025-07-31 | 13F | Oppenheimer & Co Inc | 9 665 | −1,22 | 601 | 3,09 | ||||
| 2025-08-11 | 13F | Independent Advisor Alliance | 4 192 | 260 | ||||||
| 2025-08-12 | 13F | Proequities, Inc. | 0 | 0 | ||||||
| 2025-08-14 | 13F | Fmr Llc | 16 812 | −10,98 | 1 045 | −7,03 | ||||
| 2025-08-14 | 13F | Mariner, LLC | 19 024 | 2,70 | 1 182 | 7,26 | ||||
| 2025-07-14 | 13F | Farmers & Merchants Investments Inc | 320 | 0,00 | 20 | 0,00 | ||||
| 2025-07-29 | 13F | Fundamentun, Llc | 122 026 | 7 583 | ||||||
| 2025-08-08 | 13F | Pnc Financial Services Group, Inc. | 538 770 | −0,09 | 33 479 | 4,33 | ||||
| 2025-08-14 | 13F/A | Rockefeller Capital Management L.P. | 144 025 | −1,72 | 8 950 | 2,61 | ||||
| 2025-07-11 | 13F | Rockwood Wealth Management, LLC | 6 049 | 0,00 | 376 | 4,46 | ||||
| 2025-08-11 | 13F | Citigroup Inc | 15 273 | 29,70 | 949 | 35,57 | ||||
| 2025-08-12 | 13F | Cornerstone Wealth Management, LLC | 10 808 | 0,49 | 672 | 4,84 | ||||
| 2025-08-05 | 13F | Plante Moran Financial Advisors, LLC | 229 | 0,00 | 14 | 7,69 | ||||
| 2025-08-14 | 13F | Colony Group, LLC | 8 047 | 0,00 | 500 | 4,60 | ||||
| 2025-08-15 | 13F | Captrust Financial Advisors | 105 442 | −4,16 | 6 552 | 0,08 | ||||
| 2025-05-15 | 13F | Glenmede Trust Co Na | 1 908 | 3,25 | 114 | 7,62 | ||||
| 2025-08-05 | 13F | Atlas Private Wealth Advisors | 449 363 | −1,58 | 27 925 | 2,76 | ||||
| 2025-08-13 | 13F | Baird Financial Group, Inc. | 36 789 | −0,37 | 2 286 | 4,05 | ||||
| 2025-07-17 | 13F | Sound Income Strategies, LLC | 120 | 0,00 | 7 | 0,00 | ||||
| 2025-08-13 | 13F | Maia Wealth LLC | 3 660 | −84,52 | 227 | −82,55 | ||||
| 2025-07-30 | 13F | Financial Perspectives, Inc | 5 406 | 0,37 | 336 | 4,69 | ||||
| 2025-07-28 | 13F | Harbour Investments, Inc. | 44 | 0,00 | 3 | 0,00 | ||||
| 2025-07-28 | 13F | Frazier Financial Advisors, LLC | 684 | 0,59 | 43 | 5,00 | ||||
| 2025-08-11 | 13F | Howard Wealth Management, Llc | 13 447 | 0,00 | 836 | 4,38 | ||||
| 2025-08-14 | 13F | Aqr Capital Management Llc | 12 148 | 0,00 | 755 | 4,43 | ||||
| 2025-08-14 | 13F | Warren Averett Asset Management, LLC | 18 576 | 0,15 | 1 154 | 4,62 | ||||
| 2025-08-07 | 13F | Kestra Private Wealth Services, Llc | 3 930 | −3,53 | 244 | 0,83 | ||||
| 2025-08-12 | 13F | MAI Capital Management | 1 338 | 0,00 | 83 | 5,06 | ||||
| 2025-07-16 | 13F | ORG Wealth Partners, LLC | 758 | −2,94 | 47 | 2,17 | ||||
| 2025-08-15 | 13F | Equitable Holdings, Inc. | 104 422 | −0,59 | 6 489 | 3,81 | ||||
| 2025-04-15 | 13F | Noble Wealth Management PBC | 350 | −8,85 | 21 | −4,76 | ||||
| 2025-08-11 | 13F | Advisor Resource Council | 4 192 | 260 | ||||||
| 2025-08-12 | 13F | SRS Capital Advisors, Inc. | 450 | 28 | ||||||
| 2025-08-07 | 13F | Alpha Financial Advisors, LLC | 3 405 | 212 | ||||||
| 2025-08-08 | 13F | Avantax Advisory Services, Inc. | 3 840 | 239 | ||||||
| 2025-08-27 | 13F/A | Brinker Capital Investments, LLC | 3 787 | 235 | ||||||
| 2025-04-21 | 13F | ORG Partners LLC | 0 | −100,00 | 0 | |||||
| 2025-08-14 | 13F | Mml Investors Services, Llc | 26 034 | 24,11 | 2 | 0,00 | ||||
| 2025-08-04 | 13F | NBZ Investment Advisors LLC | 335 | 0,00 | 21 | 5,26 | ||||
| 2025-07-24 | 13F | Us Bancorp \de\ | 2 859 | 57,61 | 178 | 65,42 | ||||
| 2025-08-14 | 13F | Glenmede Investment Management, LP | 1 848 | 115 | ||||||
| 2025-07-22 | 13F | Willner & Heller, Llc | 22 482 | −6,22 | 1 397 | −2,03 | ||||
| 2025-07-25 | 13F | Parker Financial LLC | 6 678 | −12,92 | 415 | −8,99 | ||||
| 2025-07-30 | 13F | Cullen/frost Bankers, Inc. | 151 182 | 1,10 | 9 394 | 5,56 | ||||
| 2025-05-14 | 13F | Mission Creek Capital Partners, Inc. | 0 | −100,00 | 0 | |||||
| 2025-07-29 | 13F | Harbor Asset Planning, Inc. | 2 577 | 160 | ||||||
| 2025-08-11 | 13F | Wescott Financial Advisory Group, LLC | 7 119 | 0,00 | 442 | 4,49 | ||||
| 2025-07-07 | 13F | RDA Financial Network | 6 350 | 0,00 | 395 | 4,51 | ||||
| 2025-08-14 | 13F | McIlrath & Eck, LLC | 100 | 0,00 | 6 | 20,00 | ||||
| 2025-08-11 | 13F | Regal Investment Advisors LLC | 131 708 | 1,98 | 8 184 | 6,49 | ||||
| 2025-08-13 | 13F | Jones Financial Companies Lllp | 3 676 | 82,61 | 227 | 91,53 | ||||
| 2025-08-08 | 13F | Firestone Capital Management | 37 513 | 2 331 | ||||||
| 2025-07-31 | 13F | Mason & Associates Inc | 3 460 | 0,00 | 215 | 4,88 | ||||
| 2025-05-01 | 13F | Quest 10 Wealth Builders, Inc. | 58 | 0,00 | 3 | 0,00 | ||||
| 2025-07-17 | 13F | Janney Montgomery Scott LLC | 10 291 | 8,57 | 1 | |||||
| 2025-08-14 | 13F | Betterment LLC | 3 369 | −9,92 | 0 | |||||
| 2025-08-05 | 13F | Bank Of Montreal /can/ | 3 123 | 0,00 | 194 | 4,86 | ||||
| 2025-05-01 | 13F | Stephens Inc /ar/ | 0 | −100,00 | 0 | −100,00 | ||||
| 2025-08-14 | 13F | Raymond James Financial Inc | 263 460 | 0,45 | 16 371 | 4,90 | ||||
| 2025-08-15 | 13F | Strategic Investment Advisors / MI | 7 985 | −1,78 | 496 | 2,69 | ||||
| 2025-08-04 | 13F | Spire Wealth Management | 33 377 | 0,38 | 2 074 | 4,85 | ||||
| 2025-08-14 | 13F | Stifel Financial Corp | 12 480 | −26,29 | 776 | −23,04 | ||||
| 2025-08-04 | 13F | Arkadios Wealth Advisors | 100 174 | −10,96 | 6 225 | −7,02 | ||||
| 2025-08-13 | 13F | Solutions 4 Wealth, Ltd | 4 756 | 2,74 | 296 | 7,27 | ||||
| 2025-07-18 | 13F | Philip James Wealth Mangement, LLC | 23 827 | 0,70 | 1 481 | 5,11 | ||||
| 2025-08-07 | 13F | Sound View Wealth Advisors Group, LLC | 4 938 | 0,00 | 307 | 4,44 | ||||
| 2025-07-17 | 13F | Hanson & Doremus Investment Management | 0 | −100,00 | 0 | |||||
| 2025-07-25 | 13F | Atria Wealth Solutions, Inc. | 0 | −100,00 | 0 | |||||
| 2025-08-15 | 13F/A | Florida Financial Advisors, Llc | 3 318 | 206 |
Other Listings
| MX:PWV |