Grundläggande statistik
| Institutionella ägare | 169 total, 169 long only, 0 short only, 0 long/short - change of −3,43% MRQ |
| Genomsnittlig portföljallokering | 0.3288 % - change of −13,78% MRQ |
| Institutionella aktier (lång) | 15 735 335 (ex 13D/G) - change of 1,05MM shares 7,14% MRQ |
| Institutionellt värde (lång) | $ 439 869 USD ($1000) |
Institutionellt ägande och aktieägare
SPDR Series Trust - SPDR ICE Preferred Securities ETF (US:PSK) har 169 Institutionella ägare och aktieägare som har lämnat in 13D/G- eller 13F-formulär till Securities Exchange Commission (SEC). Dessa institut innehar totalt 15,735,335 aktier. Största aktieägare inkluderar Wells Fargo & Company/mn, Kingstone Capital Partners Texas, LLC, Morgan Stanley, Bank of New York Mellon Corp, Royal Bank Of Canada, State of Wisconsin - Board of Commissioners of Public Lands, CNO Financial Group, Inc., Envestnet Asset Management Inc, LPL Financial LLC, and Park Avenue Securities Llc .
SPDR Series Trust - SPDR ICE Preferred Securities ETF (ARCA:PSK) Institutionell ägarstruktur visar institutioners och fonders nuvarande positioner i företaget, samt de senaste förändringarna i positionernas storlek. Större aktieägare kan vara enskilda investerare, fonder, hedgefonder eller institutioner. Bilaga 13D visar att investeraren äger (eller ägde) mer än 5% av företaget och avser (eller avsåg) att aktivt eftersträva en förändring av affärsstrategin. Schedule 13G indikerar en passiv investering på över 5%.
The share price as of September 10, 2025 is 33,29 / share. Previously, on September 11, 2024, the share price was 35,31 / share. This represents a decline of 5,72% over that period.

Fondsentimentets poäng
Fondsentimentet poängen(fka Ägarackumulation-poäng) visar vilka aktier som är mest köpta av fonder. Det är resultatet av en sofistikerad kvantitativ flerfaktormodell som identifierar företag med de högsta nivåerna av institutionell ackumulering. Poängsättningsmodellen använder en kombination av den totala ökningen av redovisade ägare, förändringarna i portföljallokeringarna för dessa ägare och andra mått. Siffran sträcker sig från 0 till 100, där högre siffror indikerar en högre nivå av ackumulering i förhållande till sina konkurrenter, och 50 är genomsnittet.
Uppdateringsfrekvens: Dagligen
Se Ownership Explorer, som innehåller en lista över de högst rankade företagen.
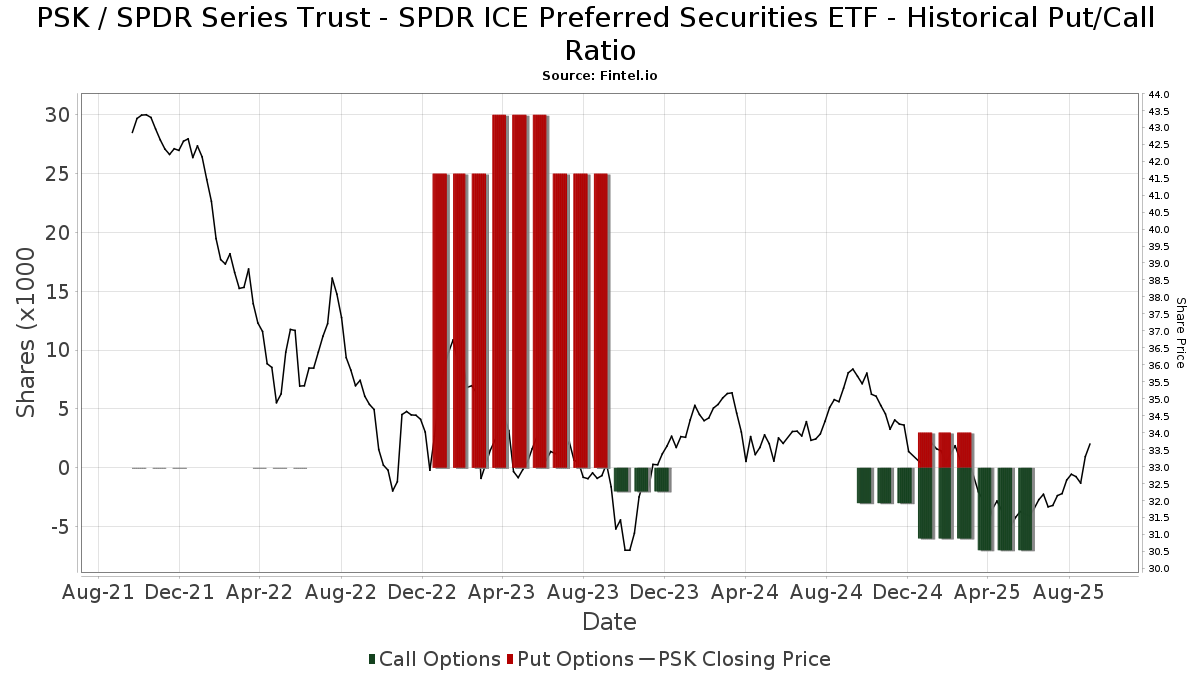
Institutionell sälj/köp-kvot
Förutom att rapportera vanliga eget kapital- och skuldemissioner måste institutioner med mer än 100MM tillgångar under förvaltning också avslöja sina innehav av sälj- och köpoptioner. Eftersom säljoptioner i allmänhet indikerar ett negativt sentiment och köpoptioner indikerar ett positivt sentiment, kan vi få en uppfattning om det övergripande institutionella sentimentet genom att plotta förhållandet mellan säljoptioner och köpoptioner. Diagrammet till höger visar det historiska förhållandet mellan sälj- och köpoptioner för detta instrument.
Genom att använda sälj/köp-kvoten som en indikator på aktieägarnas sentiment undviker man en av de största bristerna med att använda det totala institutionella ägandet, nämligen att en betydande del av de förvaltade tillgångarna investeras passivt för att följa index. Passivt förvaltade fonder köper vanligtvis inte optioner, så indikatorn för sälj/köp-kvoten ger en bättre bild av stämningen i aktivt förvaltade fonder.
13F- och NPORT-arkiveringar
Detaljer om 13F-arkiveringar är gratis. Detaljer om NP-arkiveringar kräver ett premiummedlemskap. Gröna rader indikerar nya positioner. Röda rader indikerar stängda positioner. Klicka på länk symbolen för att se hela transaktionshistoriken.
Uppgradera
för att låsa upp premiumdata och exportera till Excel ![]() .
.
| Fil Datum | Källa | Investerare | Typ | Genomsnittligt pris (beräknat) |
Aktier | Δ Aktier (%) |
Rapporterat värde (1000 USD) |
Δ Värde (%) |
Portföljallokering (%) |
|
|---|---|---|---|---|---|---|---|---|---|---|
| 2025-08-06 | 13F | Prospera Financial Services Inc | 6 530 | −37,55 | 207 | −38,76 | ||||
| 2025-08-12 | 13F | Putnam Fl Investment Management Co | 19 036 | −96,97 | 605 | −97,03 | ||||
| 2025-08-04 | 13F | Keybank National Association/oh | 8 100 | 0,00 | 257 | −1,91 | ||||
| 2025-07-21 | 13F | Crews Bank & Trust | 286 753 | −2,33 | 9 107 | −4,23 | ||||
| 2025-07-11 | 13F | Kingstone Capital Partners Texas, LLC | 1 203 024 | 41 | ||||||
| 2025-08-14 | 13F | Betterment LLC | 24 739 | 3,23 | 1 | |||||
| 2025-07-22 | 13F | Checchi Capital Advisers, LLC | 0 | −100,00 | 0 | |||||
| 2025-07-25 | 13F | Apollon Wealth Management, LLC | 12 335 | −21,60 | 392 | −23,18 | ||||
| 2025-07-16 | 13F | FORM Wealth Advisors, LLC | 9 825 | 1,35 | 312 | −0,32 | ||||
| 2025-08-15 | 13F | Morgan Stanley | 1 168 821 | −14,40 | 37 122 | −16,07 | ||||
| 2025-07-21 | 13F | Fortis Capital Advisors, LLC | 0 | −100,00 | 0 | |||||
| 2025-08-12 | 13F | Coldstream Capital Management Inc | 0 | −100,00 | 0 | |||||
| 2025-08-15 | 13F | Tower Research Capital LLC (TRC) | 3 | −50,00 | 0 | |||||
| 2025-07-22 | 13F | Iron Horse Wealth Management, LLC | 2 067 | −6,17 | 66 | −8,45 | ||||
| 2025-08-05 | 13F | Artemis Wealth Advisors, LLC | 10 371 | 1,68 | 329 | −0,30 | ||||
| 2025-08-12 | 13F | Steward Partners Investment Advisory, Llc | 2 142 | −36,72 | 68 | −37,61 | ||||
| 2025-08-18 | 13F | Geneos Wealth Management Inc. | 6 224 | −5,37 | 198 | −7,51 | ||||
| 2025-07-25 | 13F | Envestnet Portfolio Solutions, Inc. | 30 754 | −9,31 | 977 | −11,11 | ||||
| 2025-07-22 | 13F | Wealthcare Advisory Partners LLC | 38 194 | 1,19 | 1 213 | −0,74 | ||||
| 2025-07-18 | 13F | Truist Financial Corp | 211 217 | −22,73 | 6 708 | −24,23 | ||||
| 2025-08-04 | 13F | Assetmark, Inc | 0 | −100,00 | 0 | |||||
| 2025-08-11 | 13F | State of Wisconsin - Board of Commissioners of Public Lands | 840 093 | 0,00 | 26 681 | −1,94 | ||||
| 2025-08-01 | 13F | Austin Private Wealth, LLC | 7 240 | 13,69 | 230 | 11,17 | ||||
| 2025-07-24 | 13F | IFP Advisors, Inc | 398 | 5,01 | 13 | 0,00 | ||||
| 2025-08-28 | NP | INKM - SPDR SSGA Income Allocation ETF This fund is a listed as child fund of State Street Corp and if that institution has disclosed ownership in this security, then these positions will not be double counted when calculating total shares and total value | 128 189 | −3,65 | 4 071 | −5,52 | ||||
| 2025-07-10 | 13F | Wedmont Private Capital | 11 780 | 1,72 | 379 | 5,57 | ||||
| 2025-07-23 | 13F | Fulton Breakefield Broenniman Llc | 34 617 | −3,66 | 1 099 | −5,50 | ||||
| 2025-07-10 | 13F | Bath Savings Trust Co | 32 072 | −2,95 | 1 019 | −4,86 | ||||
| 2025-08-18 | 13F | Front Row Advisors LLC | 139 | −35,35 | 4 | −33,33 | ||||
| 2025-08-14 | 13F | Sunbelt Securities, Inc. | 2 298 | 0,00 | 76 | 1,35 | ||||
| 2025-08-11 | 13F | Delta Asset Management Llc/tn | 56 | 0,00 | 2 | 0,00 | ||||
| 2025-08-05 | 13F | GPS Wealth Strategies Group, LLC | 103 | 0,00 | 3 | 0,00 | ||||
| 2025-07-21 | 13F | Ameritas Advisory Services, LLC | 54 452 | −28,04 | 1 729 | −29,46 | ||||
| 2025-08-12 | 13F | Jpmorgan Chase & Co | 25 649 | −52,17 | 815 | −53,14 | ||||
| 2025-07-16 | 13F | Twelve Points Wealth Management LLC | 153 924 | 6,55 | 4 889 | 4,47 | ||||
| 2025-08-06 | 13F | Aspetuck Financial Management LLC | 57 970 | 0,00 | 1 841 | −1,92 | ||||
| 2025-08-11 | 13F | Hexagon Capital Partners LLC | 0 | −100,00 | 0 | |||||
| 2025-08-11 | 13F | Strategic Wealth Partners, Ltd. | 3 045 | 97 | ||||||
| 2025-05-15 | 13F/A | Orion Portfolio Solutions, LLC | 62 116 | −3,91 | 2 012 | −5,68 | ||||
| 2025-07-17 | 13F | Greenleaf Trust | 37 951 | 1 205 | ||||||
| 2025-07-16 | 13F | Signaturefd, Llc | 1 | 0,00 | 0 | |||||
| 2025-08-14 | 13F | Transamerica Financial Advisors, Inc. | 198 | 0,00 | 6 | |||||
| 2025-05-14 | 13F | First Trust Advisors Lp | 0 | −100,00 | 0 | |||||
| 2025-08-06 | 13F | AE Wealth Management LLC | 615 | 20 | ||||||
| 2025-08-05 | 13F | Atlas Private Wealth Advisors | 369 431 | −1,86 | 11 733 | −3,76 | ||||
| 2025-07-17 | 13F | Vermillion Wealth Management, Inc. | 492 | 1,44 | 16 | 0,00 | ||||
| 2025-08-14 | 13F/A | Rockefeller Capital Management L.P. | 17 789 | 22,08 | 565 | 19,75 | ||||
| 2025-08-04 | 13F | JDM Financial Group LLC | 1 350 | 0,00 | 43 | −2,33 | ||||
| 2025-08-07 | 13F | Allworth Financial LP | 125 398 | −19,67 | 3 983 | −20,10 | ||||
| 2025-04-24 | 13F | Falcon Wealth Planning | 0 | −100,00 | 0 | |||||
| 2025-08-14 | 13F | Financial Network Wealth Advisors LLC | 57 | 0,00 | 2 | 0,00 | ||||
| 2025-04-28 | 13F | Strategic Financial Concepts, LLC | 0 | −100,00 | 0 | −100,00 | ||||
| 2025-08-14 | 13F | Hrt Financial Lp | 14 747 | 0 | ||||||
| 2025-08-15 | 13F | WFA of San Diego, LLC | 2 649 | −15,07 | 84 | −24,32 | ||||
| 2025-08-12 | 13F | PSI Advisors, LLC | 0 | −100,00 | 0 | |||||
| 2025-08-14 | 13F | Qube Research & Technologies Ltd | 1 900 | 3,26 | 60 | 1,69 | ||||
| 2025-08-08 | 13F | Foundations Investment Advisors, LLC | 6 941 | 220 | ||||||
| 2025-07-23 | 13F | Nbt Bank N A /ny | 22 216 | 45,96 | 706 | 43,00 | ||||
| 2025-04-25 | 13F | WASHINGTON TRUST Co | 0 | −100,00 | 0 | |||||
| 2025-05-12 | 13F | Independent Advisor Alliance | 0 | −100,00 | 0 | |||||
| 2025-05-12 | 13F | BEAM Asset Management, LLC | 0 | −100,00 | 0 | −100,00 | ||||
| 2025-07-11 | 13F | Farther Finance Advisors, LLC | 4 442 | −13,28 | 141 | −14,02 | ||||
| 2025-07-24 | 13F | Costello Asset Management, INC | 79 | −22,55 | 3 | −33,33 | ||||
| 2025-08-14 | 13F | Mariner, LLC | 66 099 | −20,06 | 2 099 | −21,62 | ||||
| 2025-05-13 | 13F | Prudential Plc | 0 | −100,00 | 0 | |||||
| 2025-07-31 | 13F | Topsail Wealth Management, LLC | 1 158 | 0,00 | 37 | −2,70 | ||||
| 2025-09-04 | 13F/A | Advisor Group Holdings, Inc. | 54 067 | 54,41 | 1 718 | 51,41 | ||||
| 2025-07-15 | 13F | Garrett Investment Advisors LLC | 22 898 | 4,60 | 727 | 2,54 | ||||
| 2025-08-14 | 13F | Ameriprise Financial Inc | 84 149 | 8,32 | 2 673 | 6,20 | ||||
| 2025-05-09 | 13F | GeoWealth Management, LLC | 0 | −100,00 | 0 | |||||
| 2025-08-07 | 13F | Midwest Trust Co | 162 972 | 5 176 | ||||||
| 2025-08-12 | 13F | SRS Capital Advisors, Inc. | 83 | 0,00 | 3 | 0,00 | ||||
| 2025-07-14 | 13F | Park Avenue Securities Llc | 464 183 | −0,28 | 15 | −6,67 | ||||
| 2025-08-06 | 13F | Rialto Wealth Management, LLC | 1 087 | 0,00 | 35 | −2,86 | ||||
| 2025-07-14 | 13F | Matrix Trust Co | 23 275 | 1,20 | 1 | |||||
| 2025-04-09 | 13F | RFG Advisory, LLC | 0 | −100,00 | 0 | |||||
| 2025-07-08 | 13F | Parallel Advisors, LLC | 2 756 | 0,00 | 88 | −2,25 | ||||
| 2025-07-07 | 13F | Trust Co | 500 | 0,00 | 16 | −6,25 | ||||
| 2025-07-10 | 13F | SK Wealth Management, LLC | 0 | −100,00 | 0 | |||||
| 2025-08-11 | 13F | Aptus Capital Advisors, LLC | 100 | 0,00 | 3 | 0,00 | ||||
| 2025-08-12 | 13F | Franklin Resources Inc | 4 489 | 143 | ||||||
| 2025-08-08 | 13F | TD Capital Management LLC | 9 104 | 0,19 | 289 | −1,70 | ||||
| 2025-07-15 | 13F | McAdam, LLC | 20 111 | −8,57 | 639 | −10,39 | ||||
| 2025-04-22 | 13F | PFG Investments, LLC | 0 | −100,00 | 0 | |||||
| 2025-08-06 | 13F | Sage Advisory Services, Ltd.Co. | 331 489 | 20,34 | 10 528 | 18,00 | ||||
| 2025-08-08 | 13F | Tanglewood Legacy Advisors, LLC | 0 | −100,00 | 0 | |||||
| 2025-08-12 | 13F | Inscription Capital, LLC | 13 073 | 0,00 | 415 | −8,79 | ||||
| 2025-08-04 | 13F | Mayflower Financial Advisors, LLC | 7 875 | 0,00 | 250 | −1,96 | ||||
| 2025-08-01 | 13F | Shilanski & Associates, Inc. | 146 118 | 4,45 | 4 641 | 2,41 | ||||
| 2025-07-23 | 13F/A | Euro Pacific Asset Management, LLC | 15 965 | 0,00 | 1 | |||||
| 2025-04-23 | 13F | Creative Financial Designs Inc /adv | 0 | −100,00 | 0 | |||||
| 2025-08-14 | 13F | Boston Private Wealth Llc | 0 | −100,00 | 0 | |||||
| 2025-08-14 | 13F | Destination Wealth Management | 8 507 | 11,63 | 270 | 9,76 | ||||
| 2025-08-12 | 13F | AlphaCore Capital LLC | 1 966 | 0,00 | 62 | −1,59 | ||||
| 2025-04-29 | 13F | Pensionmark Financial Group, Llc | 0 | −100,00 | 0 | |||||
| 2025-08-12 | 13F | Charles Schwab Investment Management Inc | 112 599 | −4,29 | 3 576 | −6,14 | ||||
| 2025-08-13 | 13F | Jones Financial Companies Lllp | 11 185 | −4,45 | 355 | −6,58 | ||||
| 2025-08-05 | 13F | Bank Of Montreal /can/ | 42 800 | 0,42 | 1 359 | −1,52 | ||||
| 2025-08-07 | 13F | FDx Advisors, Inc. | 61 523 | 0,11 | 2 | 0,00 | ||||
| 2025-08-06 | 13F | Long Run Wealth Advisors, LLC | 201 124 | 8,64 | 6 388 | 6,52 | ||||
| 2025-08-08 | 13F | Capital Investment Advisory Services, LLC | 853 | 132,43 | 27 | 145,45 | ||||
| 2025-08-14 | 13F | GWM Advisors LLC | 18 584 | −5,77 | 590 | −7,52 | ||||
| 2025-08-11 | 13F | Private Advisor Group, LLC | 45 259 | −24,84 | 1 437 | −26,31 | ||||
| 2025-07-22 | 13F | Rocky Mountain Advisers, Llc | 1 620 | 0,00 | 51 | −1,92 | ||||
| 2025-08-14 | 13F | Susquehanna International Group, Llp | 15 893 | 18,69 | 505 | 16,40 | ||||
| 2025-08-12 | 13F | Zacks Investment Management | 108 397 | 234,10 | 3 443 | 227,81 | ||||
| 2025-08-11 | 13F | Cornerstone Planning Group LLC | 1 007 | 1,72 | 33 | 3,23 | ||||
| 2025-08-11 | 13F | Citigroup Inc | 300 | 0,00 | 10 | 0,00 | ||||
| 2025-07-31 | 13F | GLOBALT Investments LLC / GA | 14 306 | −10,39 | 454 | −12,19 | ||||
| 2025-07-24 | 13F | Us Bancorp \de\ | 9 683 | 6,35 | 308 | 4,42 | ||||
| 2025-08-12 | 13F | NFP Retirement, Inc. | 41 436 | −13,46 | 1 316 | −15,10 | ||||
| 2025-08-14 | 13F | Wiley Bros.-aintree Capital, Llc | 116 753 | 31,59 | 3 723 | 29,06 | ||||
| 2025-08-05 | 13F | NewSquare Capital LLC | 485 | 0,00 | 15 | 0,00 | ||||
| 2025-08-14 | 13F | Wells Fargo & Company/mn | 1 742 070 | 81,86 | 55 328 | 78,33 | ||||
| 2025-08-05 | 13F | Crestwood Advisors Group LLC | 19 646 | −13,91 | 624 | −15,70 | ||||
| 2025-07-17 | 13F | Chatham Capital Group, Inc. | 0 | −100,00 | 0 | |||||
| 2025-08-13 | 13F | Northwestern Mutual Wealth Management Co | 10 838 | 30,85 | 344 | 28,36 | ||||
| 2025-08-13 | 13F | Lido Advisors, LLC | 280 403 | 32,24 | 8 906 | 29,68 | ||||
| 2025-07-17 | 13F | Sound Income Strategies, LLC | 161 023 | −1,21 | 5 114 | −3,13 | ||||
| 2025-07-29 | 13F | Tradewinds Capital Management, LLC | 6 693 | 0,00 | 213 | −1,85 | ||||
| 2025-08-14 | 13F | Synovus Financial Corp | 21 986 | 3,60 | 698 | 1,60 | ||||
| 2025-08-15 | 13F | Provenance Wealth Advisors, LLC | 31 535 | 0,00 | 1 002 | −1,96 | ||||
| 2025-07-17 | 13F | Eclectic Associates Inc /adv | 11 653 | 0,21 | 370 | −1,60 | ||||
| 2025-08-14 | 13F | Citadel Advisors Llc | 50 363 | 1 600 | ||||||
| 2025-04-28 | 13F | D.a. Davidson & Co. | 0 | −100,00 | 0 | |||||
| 2025-08-01 | 13F | Envestnet Asset Management Inc | 582 101 | 2,71 | 18 488 | 0,71 | ||||
| 2025-08-06 | 13F | Commonwealth Equity Services, Llc | 20 589 | −17,92 | 1 | |||||
| 2025-08-14 | 13F | Sequent Planning LLC | 17 639 | 35,08 | 560 | 32,70 | ||||
| 2025-08-14 | 13F | Citadel Advisors Llc | Call | 7 500 | 22,95 | 238 | 20,81 | |||
| 2025-07-08 | 13F | Nbc Securities, Inc. | 3 019 | 40,75 | 0 | |||||
| 2025-07-17 | 13F | Barry Investment Advisors, LLC | 104 355 | −47,30 | 3 314 | −48,32 | ||||
| 2025-07-31 | 13F | Sharper & Granite LLC | 18 075 | 12,79 | 579 | 11,37 | ||||
| 2025-08-13 | 13F | Vermillion & White Wealth Management Group, LLC | 1 414 | 0,00 | 45 | −2,22 | ||||
| 2025-08-14 | 13F | Aureus Asset Management, LLC | 0 | −100,00 | 0 | |||||
| 2025-07-28 | 13F | Rosenberg Matthew Hamilton | 59 989 | −2,97 | 1 905 | −4,85 | ||||
| 2025-08-08 | 13F | Wiser Advisor Group LLC | 0 | −100,00 | 0 | |||||
| 2025-08-13 | 13F/A | StoneX Group Inc. | 0 | −100,00 | 0 | −100,00 | ||||
| 2025-08-05 | 13F | Bank of New York Mellon Corp | 1 094 854 | −1,41 | 34 773 | −3,33 | ||||
| 2025-08-15 | 13F | Equitable Holdings, Inc. | 8 281 | −53,02 | 263 | −53,86 | ||||
| 2025-05-14 | 13F | Jane Street Group, Llc | 0 | −100,00 | 0 | |||||
| 2025-08-11 | 13F | HighTower Advisors, LLC | 6 968 | −1,37 | 221 | −3,07 | ||||
| 2025-08-14 | 13F | UBS Group AG | 284 976 | 3,04 | 9 051 | 1,04 | ||||
| 2025-07-16 | 13F | St Germain D J Co Inc | 187 190 | −30,24 | 5 945 | −31,59 | ||||
| 2025-08-08 | 13F | SBI Securities Co., Ltd. | 23 | −28,12 | 1 | −100,00 | ||||
| 2025-08-14 | 13F | CoreCap Advisors, LLC | 1 299 | −4,34 | 41 | −4,65 | ||||
| 2025-07-28 | 13F | Duncker Streett & Co Inc | 2 000 | 0,00 | 64 | −1,56 | ||||
| 2025-08-11 | 13F | Principal Securities, Inc. | 56 | 366,67 | 2 | |||||
| 2025-05-02 | 13F | Larson Financial Group LLC | 0 | −100,00 | 0 | |||||
| 2025-08-12 | 13F | Deutsche Bank Ag\ | 40 050 | 1 272 | ||||||
| 2025-08-12 | 13F | Proequities, Inc. | 0 | 0 | ||||||
| 2025-08-01 | 13F | Financial Counselors Inc | 0 | −100,00 | 0 | |||||
| 2025-08-18 | 13F/A | National Bank Of Canada /fi/ | 450 | 0,00 | 14 | 0,00 | ||||
| 2025-08-08 | 13F | Pnc Financial Services Group, Inc. | 110 432 | −5,22 | 3 507 | −7,05 | ||||
| 2025-05-13 | 13F | Elevation Capital Advisory, LLC | 0 | −100,00 | 0 | |||||
| 2025-07-18 | 13F | Pure Financial Advisors, Inc. | 24 323 | 64,92 | 772 | 61,84 | ||||
| 2025-08-12 | 13F | Global Retirement Partners, LLC | 0 | −100,00 | 0 | |||||
| 2025-05-02 | 13F | BlackRock, Inc. | 0 | −100,00 | 0 | −100,00 | ||||
| 2025-07-10 | 13F | HF Advisory Group, LLC | 7 372 | 1,36 | 234 | −0,43 | ||||
| 2025-07-14 | 13F | Sowell Financial Services LLC | 16 010 | 4,27 | 508 | 2,21 | ||||
| 2025-08-15 | 13F | Kestra Advisory Services, LLC | 11 650 | 24,07 | 370 | 21,71 | ||||
| 2025-07-17 | 13F | Fifth Third Securities, Inc. | 21 028 | 9,34 | 668 | 7,23 | ||||
| 2025-07-10 | 13F | Wealth Enhancement Advisory Services, Llc | 75 966 | −4,64 | 2 437 | −5,58 | ||||
| 2025-07-22 | 13F | Financial Insights, Inc. | 10 640 | −62,70 | 338 | −63,53 | ||||
| 2025-08-15 | 13F | Cornerstone Financial Group, LLC /NE/ | 18 194 | 1,93 | 578 | 2,30 | ||||
| 2025-08-08 | 13F | Cetera Investment Advisers | 98 114 | −3,64 | 3 116 | −5,49 | ||||
| 2025-08-12 | 13F | LPL Financial LLC | 496 300 | −11,50 | 15 762 | −13,22 | ||||
| 2025-07-07 | 13F | Thurston, Springer, Miller, Herd & Titak, Inc. | 11 185 | 14,69 | 355 | 12,70 | ||||
| 2025-08-14 | 13F | Gotham Asset Management, LLC | 7 273 | 231 | ||||||
| 2025-08-27 | 13F/A | Brinker Capital Investments, LLC | 58 405 | −5,97 | 1 855 | −7,81 | ||||
| 2025-07-22 | 13F | DAVENPORT & Co LLC | 8 171 | 19,79 | 260 | 17,73 | ||||
| 2025-04-16 | 13F | Caldwell Securities, Inc | 0 | −100,00 | 0 | −100,00 | ||||
| 2025-08-11 | 13F | Parr Mcknight Wealth Management Group, Llc | 10 000 | 0,00 | 318 | −1,86 | ||||
| 2025-08-13 | 13F | Townsquare Capital Llc | 8 429 | −13,65 | 268 | −15,51 | ||||
| 2025-08-14 | 13F | Bank Of America Corp /de/ | 212 346 | −1,15 | 6 744 | −3,08 | ||||
| 2025-08-14 | 13F | Comerica Bank | 9 455 | −5,13 | 300 | −6,83 | ||||
| 2025-08-12 | 13F | MAI Capital Management | 1 149 | 0,00 | 36 | −2,70 | ||||
| 2025-04-28 | 13F | Financial Advocates Investment Management | 0 | −100,00 | 0 | |||||
| 2025-07-15 | 13F | Shulman DeMeo Asset Management LLC | 111 752 | −0,60 | 3 549 | −2,53 | ||||
| 2025-07-07 | 13F | Investors Research Corp | 93 623 | −0,92 | 2 973 | −2,84 | ||||
| 2025-07-22 | 13F | Belpointe Asset Management LLC | 0 | −100,00 | 0 | |||||
| 2025-08-01 | 13F | Vision Financial Markets Llc | 145 | 2,11 | 5 | 0,00 | ||||
| 2025-08-14 | 13F | Mercer Global Advisors Inc /adv | 48 324 | −38,08 | 1 535 | −39,30 | ||||
| 2025-08-07 | 13F | Parkside Financial Bank & Trust | 693 | 0,00 | 22 | 0,00 | ||||
| 2025-07-17 | 13F | Mokosak Advisory Group, LLC | 7 657 | 1,71 | 243 | 0,00 | ||||
| 2025-07-25 | 13F | Cwm, Llc | 1 747 | 5,18 | 0 | |||||
| 2025-08-08 | 13F | CNO Financial Group, Inc. | 700 000 | 0,00 | 22 232 | −1,95 | ||||
| 2025-08-14 | 13F | Raymond James Financial Inc | 305 707 | 7,55 | 9 709 | 5,45 | ||||
| 2025-08-14 | 13F | MGB Wealth Management, LLC | 485 | 0,00 | 15 | 0,00 | ||||
| 2025-08-27 | NP | Mason Capital Fund Trust - Fundamentals First ETF | 1 424 | 0,00 | 45 | −2,17 | ||||
| 2025-07-22 | 13F | Diligent Investors, LLC | 23 449 | 0,01 | 745 | −1,98 | ||||
| 2025-08-14 | 13F | Royal Bank Of Canada | 932 939 | −5,44 | 29 630 | −7,28 | ||||
| 2025-07-08 | 13F | Lowe Wealth Advisors, LLC | 3 538 | 0,00 | 112 | −1,75 | ||||
| 2025-07-17 | 13F | XML Financial, LLC | 30 655 | −5,41 | 974 | −7,24 | ||||
| 2025-04-22 | 13F | Nilsine Partners, LLC | 0 | −100,00 | 0 | |||||
| 2025-07-14 | 13F | Armstrong Advisory Group, Inc | 0 | −100,00 | 0 | |||||
| 2025-07-29 | 13F | Stratos Wealth Partners, LTD. | 6 370 | −16,92 | 202 | −18,55 | ||||
| 2025-05-02 | 13F | Wealthfront Advisers Llc | 0 | −100,00 | 0 | −100,00 | ||||
| 2025-08-05 | 13F | Key FInancial Inc | 1 618 | −58,71 | 51 | −59,52 | ||||
| 2025-08-12 | 13F | Wayfinding Financial, LLC | 7 266 | 171,02 | 0 | |||||
| 2025-08-14 | 13F | Fmr Llc | 100 | 3 | ||||||
| 2025-08-14 | 13F | Hilton Capital Management, LLC | 0 | −100,00 | 0 | |||||
| 2025-08-14 | 13F | Harvest Investment Services, LLC | 6 746 | 0,69 | 214 | −1,38 | ||||
| 2025-04-17 | 13F | Monticello Wealth Management, Llc | 0 | −100,00 | 0 | |||||
| 2025-08-14 | 13F | Voya Financial Advisors, Inc. | 56 383 | 6,51 | 1 792 | 4,13 | ||||
| 2025-08-01 | 13F | Alexander Labrunerie & Co., Inc. | 26 274 | −4,03 | 834 | −5,87 | ||||
| 2025-07-29 | 13F | Private Trust Co Na | 12 701 | −28,26 | 403 | −29,67 | ||||
| 2025-08-08 | 13F | Hartland & Co., LLC | 773 | 12,03 | 25 | 9,09 | ||||
| 2025-08-14 | 13F | Citadel Advisors Llc | Put | 0 | −100,00 | 0 | ||||
| 2025-08-15 | 13F | Captrust Financial Advisors | 14 717 | 467 | ||||||
| 2025-08-13 | 13F | Capital Analysts, Inc. | 91 | 0,00 | 0 | |||||
| 2025-04-24 | 13F | Mirae Asset Global Investments Co., Ltd. | 0 | −100,00 | 0 | |||||
| 2025-08-14 | 13F | Mml Investors Services, Llc | 17 880 | −13,06 | 1 | |||||
| 2025-07-31 | 13F | Cambridge Investment Research Advisors, Inc. | 29 935 | 2,12 | 1 |