Grundläggande statistik
| Institutionella ägare | 244 total, 244 long only, 0 short only, 0 long/short - change of 0,41% MRQ |
| Genomsnittlig portföljallokering | 0.3348 % - change of 2,90% MRQ |
| Institutionella aktier (lång) | 23 100 762 (ex 13D/G) - change of 0,60MM shares 2,66% MRQ |
| Institutionellt värde (lång) | $ 824 095 USD ($1000) |
Institutionellt ägande och aktieägare
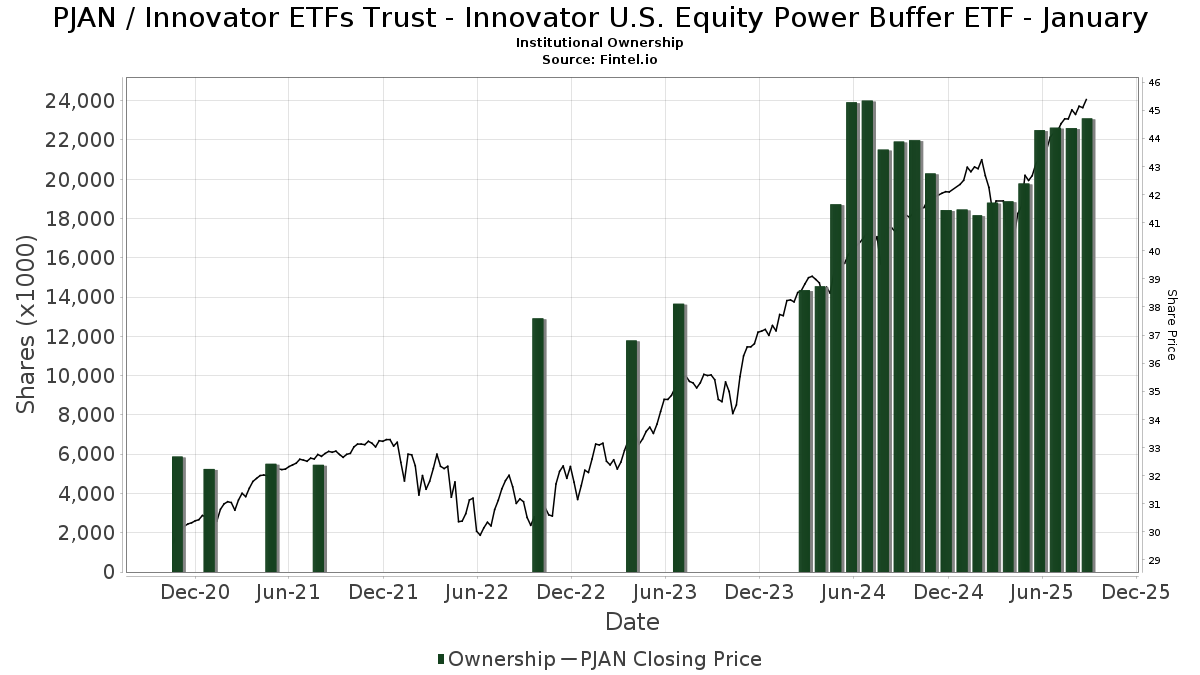
Innovator ETFs Trust - Innovator U.S. Equity Power Buffer ETF - January (US:PJAN) har 244 Institutionella ägare och aktieägare som har lämnat in 13D/G- eller 13F-formulär till Securities Exchange Commission (SEC). Dessa institut innehar totalt 23,100,762 aktier. Största aktieägare inkluderar Alliancebernstein L.p., Commonwealth Equity Services, Llc, Penserra Capital Management LLC, Innovator ETFs Trust - Innovator Laddered Fund of U.S. Equity Power Buffer ETFs, Advisor Group Holdings, Inc., Mml Investors Services, Llc, Brookstone Capital Management, Raymond James Financial Inc, LPL Financial LLC, and Southland Equity Partners LLC .
Innovator ETFs Trust - Innovator U.S. Equity Power Buffer ETF - January (BATS:PJAN) Institutionell ägarstruktur visar institutioners och fonders nuvarande positioner i företaget, samt de senaste förändringarna i positionernas storlek. Större aktieägare kan vara enskilda investerare, fonder, hedgefonder eller institutioner. Bilaga 13D visar att investeraren äger (eller ägde) mer än 5% av företaget och avser (eller avsåg) att aktivt eftersträva en förändring av affärsstrategin. Schedule 13G indikerar en passiv investering på över 5%.
The share price as of September 12, 2025 is 45,48 / share. Previously, on September 16, 2024, the share price was 41,00 / share. This represents an increase of 10,93% over that period.
Fondsentimentets poäng
Fondsentimentet poängen(fka Ägarackumulation-poäng) visar vilka aktier som är mest köpta av fonder. Det är resultatet av en sofistikerad kvantitativ flerfaktormodell som identifierar företag med de högsta nivåerna av institutionell ackumulering. Poängsättningsmodellen använder en kombination av den totala ökningen av redovisade ägare, förändringarna i portföljallokeringarna för dessa ägare och andra mått. Siffran sträcker sig från 0 till 100, där högre siffror indikerar en högre nivå av ackumulering i förhållande till sina konkurrenter, och 50 är genomsnittet.
Uppdateringsfrekvens: Dagligen
Se Ownership Explorer, som innehåller en lista över de högst rankade företagen.
Institutionell sälj/köp-kvot
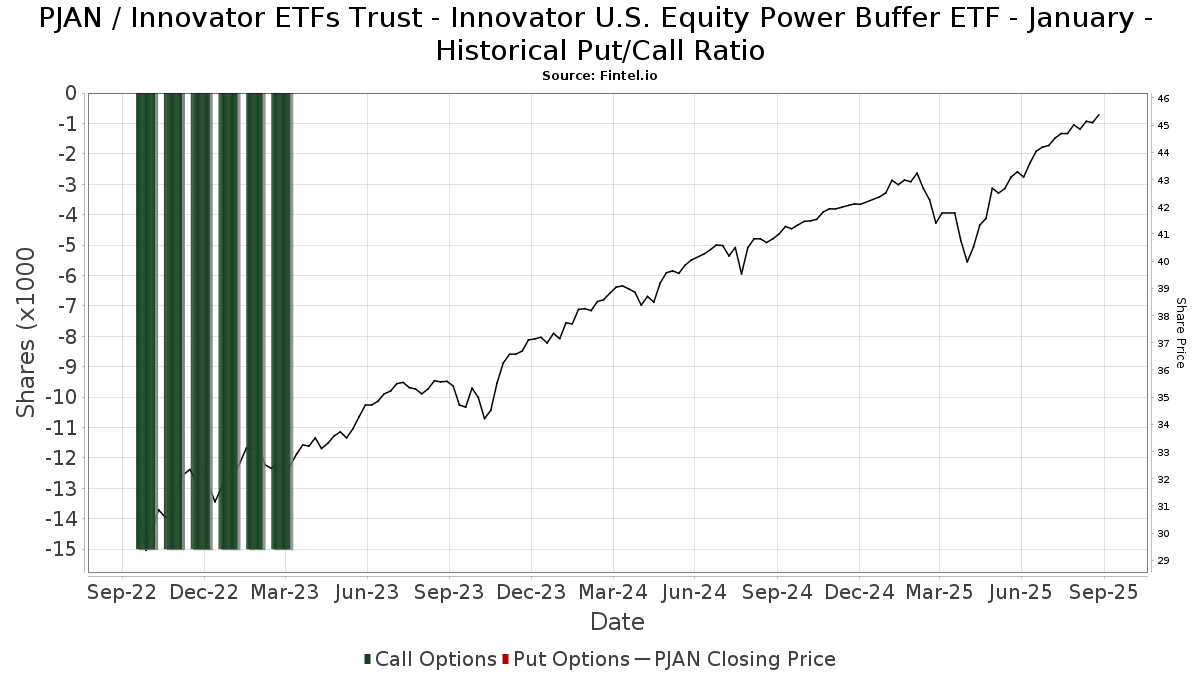
Förutom att rapportera vanliga eget kapital- och skuldemissioner måste institutioner med mer än 100MM tillgångar under förvaltning också avslöja sina innehav av sälj- och köpoptioner. Eftersom säljoptioner i allmänhet indikerar ett negativt sentiment och köpoptioner indikerar ett positivt sentiment, kan vi få en uppfattning om det övergripande institutionella sentimentet genom att plotta förhållandet mellan säljoptioner och köpoptioner. Diagrammet till höger visar det historiska förhållandet mellan sälj- och köpoptioner för detta instrument.
Genom att använda sälj/köp-kvoten som en indikator på aktieägarnas sentiment undviker man en av de största bristerna med att använda det totala institutionella ägandet, nämligen att en betydande del av de förvaltade tillgångarna investeras passivt för att följa index. Passivt förvaltade fonder köper vanligtvis inte optioner, så indikatorn för sälj/köp-kvoten ger en bättre bild av stämningen i aktivt förvaltade fonder.
13F- och NPORT-arkiveringar
Detaljer om 13F-arkiveringar är gratis. Detaljer om NP-arkiveringar kräver ett premiummedlemskap. Gröna rader indikerar nya positioner. Röda rader indikerar stängda positioner. Klicka på länk symbolen för att se hela transaktionshistoriken.
Uppgradera
för att låsa upp premiumdata och exportera till Excel ![]() .
.
| Fil Datum | Källa | Investerare | Typ | Genomsnittligt pris (beräknat) |
Aktier | Δ Aktier (%) |
Rapporterat värde (1000 USD) |
Δ Värde (%) |
Portföljallokering (%) |
|
|---|---|---|---|---|---|---|---|---|---|---|
| 2025-07-25 | 13F | Apollon Wealth Management, LLC | 36 867 | 0,00 | 1 624 | 6,22 | ||||
| 2025-07-28 | 13F | Sterling Financial Planning, Inc. | 16 260 | −0,39 | 716 | 5,92 | ||||
| 2025-08-08 | 13F | Hartland & Co., LLC | 1 032 | 216,56 | 44 | 238,46 | ||||
| 2025-07-16 | 13F | Evergreen Private Wealth LLC | 3 547 | 0,00 | 156 | 6,12 | ||||
| 2025-08-14 | 13F | Susquehanna International Group, Llp | 0 | −100,00 | 0 | |||||
| 2025-08-14 | 13F | Ambassador Advisors, LLC | 13 609 | −0,36 | 599 | 5,83 | ||||
| 2025-08-14 | 13F | Helium Advisors LLC | 19 433 | 0,00 | 856 | 6,34 | ||||
| 2025-05-13 | 13F | Measured Risk Portfolios, Inc. | 0 | −100,00 | 0 | |||||
| 2025-07-25 | 13F | Atria Wealth Solutions, Inc. | 30 894 | −15,91 | 1 361 | −10,70 | ||||
| 2025-08-12 | 13F | J.w. Cole Advisors, Inc. | 7 299 | 0,00 | 322 | 6,29 | ||||
| 2025-08-13 | 13F | EverSource Wealth Advisors, LLC | 4 589 | 0,00 | 202 | 6,32 | ||||
| 2025-05-15 | 13F | Bank Of America Corp /de/ | 0 | −100,00 | 0 | |||||
| 2025-07-22 | 13F | Berkshire Money Management, Inc. | 8 204 | 0,00 | 361 | 6,18 | ||||
| 2025-07-29 | 13F | Goldstein Advisors, LLC | 0 | −100,00 | 0 | |||||
| 2025-07-22 | 13F | Merit Financial Group, LLC | 6 832 | 301 | ||||||
| 2025-07-23 | 13F | Valmark Advisers, Inc. | 22 751 | 0,00 | 1 002 | 6,26 | ||||
| 2025-08-12 | 13F | Coldstream Capital Management Inc | 6 369 | 0,00 | 281 | 6,06 | ||||
| 2025-08-13 | 13F | BCJ Capital Management, LLC | 47 776 | −2,80 | 2 105 | 3,24 | ||||
| 2025-07-14 | 13F | AdvisorNet Financial, Inc | 49 122 | 5,71 | 2 164 | 12,25 | ||||
| 2025-08-11 | 13F | Blue Bell Private Wealth Management, Llc | 60 813 | −0,07 | 2 679 | 6,14 | ||||
| 2025-08-14 | 13F | IHT Wealth Management, LLC | 4 756 | 210 | ||||||
| 2025-08-13 | 13F | Maia Wealth LLC | 7 408 | −11,04 | 326 | −3,26 | ||||
| 2025-08-08 | 13F | Collaborative Wealth Managment Inc. | 5 772 | 254 | ||||||
| 2025-08-14 | 13F | CoreCap Advisors, LLC | 134 446 | 1,64 | 5 922 | 7,97 | ||||
| 2025-07-11 | 13F | SILVER OAK SECURITIES, Inc | 21 889 | −12,97 | 964 | −7,31 | ||||
| 2025-04-10 | 13F | Sugar Maple Asset Management, LLC | 0 | −100,00 | 0 | |||||
| 2025-08-14 | 13F | Money Concepts Capital Corp | 5 724 | 0,00 | 252 | 6,33 | ||||
| 2025-07-10 | 13F | Marshall Financial Group LLC | 14 041 | 0,00 | 618 | 6,19 | ||||
| 2025-08-08 | 13F | Avantax Advisory Services, Inc. | 25 880 | −0,44 | 1 140 | 5,75 | ||||
| 2025-07-29 | 13F | Stephens Inc /ar/ | 15 830 | 0,00 | 697 | 6,25 | ||||
| 2025-07-21 | 13F | Ameriflex Group, Inc. | 345 | 0,00 | 15 | 7,14 | ||||
| 2025-08-14 | 13F | Financial Network Wealth Advisors LLC | 3 033 | 261,50 | 134 | 291,18 | ||||
| 2025-08-11 | 13F | Rothschild Investment Llc | 16 | 0,00 | 1 | |||||
| 2025-07-08 | 13F | Nbc Securities, Inc. | 3 421 | 0,00 | 0 | |||||
| 2025-07-09 | 13F | Pallas Capital Advisors LLC | 132 013 | −15,95 | 5 815 | −10,72 | ||||
| 2025-07-15 | 13F | First City Capital Management, Inc. | 30 200 | 0,00 | 1 330 | 6,23 | ||||
| 2025-08-12 | 13F | Ascent Wealth Partners, LLC | 243 170 | −0,70 | 10 712 | 5,49 | ||||
| 2025-08-11 | 13F | Nations Financial Group Inc, /ia/ /adv | 7 829 | −0,06 | 345 | 6,17 | ||||
| 2025-08-12 | 13F | CIBC Private Wealth Group, LLC | 319 | 14 | ||||||
| 2025-08-14 | 13F/A | Skopos Labs, Inc. | 114 | 5 | ||||||
| 2025-07-31 | 13F | 3EDGE Asset Management, LP | 19 113 | 842 | ||||||
| 2025-08-11 | 13F | Brown Brothers Harriman & Co | 5 505 | 0,00 | 242 | 6,14 | ||||
| 2025-08-14 | 13F | Main Street Financial Solutions, LLC | 14 100 | 0,00 | 621 | 6,34 | ||||
| 2025-08-15 | 13F | Morgan Stanley | 11 095 | 81,47 | 489 | 92,89 | ||||
| 2025-07-09 | 13F | Keystone Wealth Services, LLC | 17 063 | 0,00 | 752 | 6,22 | ||||
| 2025-08-14 | 13F | Arete Wealth Advisors, LLC | 6 596 | 0,00 | 0 | |||||
| 2025-08-06 | 13F | Valtinson Bruner Financial Planning LLC | 20 123 | −1,48 | 886 | 4,60 | ||||
| 2025-05-05 | 13F | PCA Investment Advisory Services Inc. | 0 | −100,00 | 0 | −100,00 | ||||
| 2025-07-03 | 13F | City Center Advisors, LLC | 11 073 | −6,64 | 488 | −0,81 | ||||
| 2025-07-10 | 13F | Oliver Lagore Vanvalin Investment Group | 9 530 | 76,94 | 395 | 74,01 | ||||
| 2025-07-22 | 13F | Global Strategic Investment Solutions, LLC | 14 736 | 0,00 | 649 | 6,22 | ||||
| 2025-07-24 | 13F | Weaver Capital Management LLC | 323 549 | −4,72 | 14 252 | 1,21 | ||||
| 2025-08-08 | 13F | Pnc Financial Services Group, Inc. | 12 746 | 561 | ||||||
| 2025-07-16 | 13F | Dakota Wealth Management | 37 262 | 0,00 | 1 641 | 6,21 | ||||
| 2025-08-13 | 13F | Per Stirling Capital Management, LLC. | 12 533 | 0,76 | 552 | 7,18 | ||||
| 2025-08-06 | 13F | Penserra Capital Management LLC | 1 334 566 | 15,42 | 59 | 23,40 | ||||
| 2025-08-12 | 13F | Proequities, Inc. | 0 | 0 | ||||||
| 2025-07-16 | 13F | Cambridge Advisors Inc. | 9 879 | −0,24 | 435 | 6,10 | ||||
| 2025-08-13 | 13F | SCS Capital Management LLC | 26 044 | 0,00 | 1 147 | 6,20 | ||||
| 2025-04-22 | 13F | Synergy Financial Management, LLC | 0 | −100,00 | 0 | |||||
| 2025-07-22 | 13F | MBL Wealth, LLC | 6 760 | 0,00 | 298 | 6,07 | ||||
| 2025-06-24 | NP | Innovator ETFs Trust - Innovator Laddered Fund of U.S. Equity Power Buffer ETFs | 1 166 112 | 12,06 | 48 184 | 8,06 | ||||
| 2025-08-06 | 13F | Commonwealth Equity Services, Llc | 1 403 353 | 27,65 | 62 | 35,56 | ||||
| 2025-07-28 | 13F | RFG Advisory, LLC | 36 341 | −13,87 | 1 601 | −8,52 | ||||
| 2025-07-21 | 13F | DHJJ Financial Advisors, Ltd. | 16 230 | −0,22 | 715 | 5,93 | ||||
| 2025-07-11 | 13F | Cypress Financial Planning Llc | 0 | −100,00 | 0 | |||||
| 2025-08-14 | 13F | Diversify Wealth Management, Llc | 9 276 | 0,00 | 417 | 8,62 | ||||
| 2025-07-10 | 13F | Kmg Fiduciary Partners, Llc | 43 907 | 0,00 | 1 934 | 6,26 | ||||
| 2025-08-04 | 13F | Spire Wealth Management | 5 112 | 0,00 | 225 | 6,64 | ||||
| 2025-07-29 | 13F | Signature Estate & Investment Advisors Llc | 6 819 | 22,86 | 300 | 30,43 | ||||
| 2025-08-14 | 13F | Wells Fargo & Company/mn | 0 | −100,00 | 0 | |||||
| 2025-07-29 | 13F | Koshinski Asset Management, Inc. | 24 195 | −1,33 | 1 066 | 4,82 | ||||
| 2025-08-14 | 13F | Talon Private Wealth, LLC | 44 547 | −7,28 | 1 962 | −1,51 | ||||
| 2025-08-14 | 13F | Raymond James Financial Inc | 700 049 | −4,67 | 30 837 | 1,27 | ||||
| 2025-07-25 | 13F | Yarger Wealth Strategies, Llc | 21 857 | −13,88 | 963 | −8,56 | ||||
| 2025-08-12 | 13F | Insigneo Advisory Services, Llc | 6 277 | −0,08 | 277 | 6,15 | ||||
| 2025-07-17 | 13F | City Holding Co | 74 750 | −8,19 | 3 292 | −2,52 | ||||
| 2025-07-25 | 13F | Cwm, Llc | 246 556 | 23,61 | 11 | 25,00 | ||||
| 2025-08-19 | 13F | National Asset Management, Inc. | 0 | −100,00 | 0 | |||||
| 2025-08-19 | 13F | Cape Investment Advisory, Inc. | 7 550 | 0,00 | 333 | 6,07 | ||||
| 2025-07-10 | 13F | Focus Financial Network, Inc. | 22 015 | −6,80 | 970 | −1,02 | ||||
| 2025-07-31 | 13F | Orion Capital Management LLC | 36 786 | 4,07 | 1 620 | 10,58 | ||||
| 2025-05-15 | 13F | Royal Bank Of Canada | 0 | −100,00 | 0 | |||||
| 2025-05-01 | 13F | Quest 10 Wealth Builders, Inc. | 6 953 | −26,73 | 288 | −28,00 | ||||
| 2025-08-06 | 13F | Atlantic Union Bankshares Corp | 4 730 | 208 | ||||||
| 2025-07-29 | 13F | Madison Wealth Partners, Inc | 5 715 | 0,00 | 252 | 5,91 | ||||
| 2025-08-04 | 13F | JDM Financial Group LLC | 58 000 | 0,00 | 2 555 | 6,20 | ||||
| 2025-07-28 | 13F | WealthPlan Investment Management, LLC | 43 978 | 0,57 | 1 937 | 6,84 | ||||
| 2025-08-12 | 13F | Bedel Financial Consulting, Inc. | 20 926 | −0,32 | 922 | 5,74 | ||||
| 2025-07-18 | 13F | Truist Financial Corp | 103 065 | 0,97 | 4 540 | 7,25 | ||||
| 2025-08-06 | 13F | Soltis Investment Advisors LLC | 17 933 | −0,90 | 790 | 5,20 | ||||
| 2025-07-08 | 13F | Range Financial Group LLC | 160 171 | −2,55 | 7 056 | 3,51 | ||||
| 2025-07-15 | 13F | Retirement Income Solutions, Inc | 21 486 | 0,40 | 946 | 6,65 | ||||
| 2025-08-12 | 13F | Steward Partners Investment Advisory, Llc | 122 013 | 0,75 | 5 375 | 7,01 | ||||
| 2025-08-04 | 13F | Creative Financial Designs Inc /adv | 8 500 | −7,71 | 374 | −1,84 | ||||
| 2025-08-29 | 13F | Centaurus Financial, Inc. | 62 021 | −0,78 | 3 | 0,00 | ||||
| 2025-07-28 | 13F | WealthPLAN Partners, LLC | 8 838 | 0,00 | 389 | 6,28 | ||||
| 2025-08-05 | 13F | Jessup Wealth Management, Inc | 38 202 | −2,16 | 1 683 | 3,89 | ||||
| 2025-07-17 | 13F | Clay Northam Wealth Management, LLC | 23 310 | −1,96 | 1 027 | 4,16 | ||||
| 2025-08-04 | 13F | Assetmark, Inc | 445 | 595,31 | 20 | 850,00 | ||||
| 2025-07-30 | 13F | Drive Wealth Management, Llc | 5 973 | 263 | ||||||
| 2025-08-04 | 13F | Arkadios Wealth Advisors | 22 955 | 12,32 | 1 011 | 19,36 | ||||
| 2025-08-07 | 13F | Encompass More Asset Management | 45 255 | 19,75 | 1 993 | 27,19 | ||||
| 2025-08-14 | 13F | GWM Advisors LLC | 34 362 | 0,00 | 1 514 | 6,25 | ||||
| 2025-07-16 | 13F | Kathmere Capital Management, LLC | 11 906 | 0,00 | 524 | 6,29 | ||||
| 2025-08-06 | 13F | Capasso Planning Partners LLC | 6 747 | −89,57 | 297 | −88,93 | ||||
| 2025-05-16 | 13F | Coppell Advisory Solutions LLC | 0 | −100,00 | 0 | |||||
| 2025-08-04 | 13F | Pensionmark Financial Group, Llc | 196 559 | −1,56 | 8 658 | 4,57 | ||||
| 2025-07-08 | 13F | Ptm Wealth Management, Llc | 24 502 | −14,65 | 1 083 | −2,61 | ||||
| 2025-07-10 | 13F | Wealth Enhancement Advisory Services, Llc | 258 076 | −40,70 | 11 404 | −36,81 | ||||
| 2025-07-28 | 13F | Cornerstone Wealth Group, LLC | 7 879 | 0,00 | 347 | 6,44 | ||||
| 2025-07-31 | 13F | Pinnacle Wealth Management Group, Inc. | 14 636 | −0,34 | 645 | 5,75 | ||||
| 2025-07-21 | 13F | Keystone Financial Group, Inc. | 19 | 0,00 | 1 | |||||
| 2025-08-08 | 13F | Foundations Investment Advisors, LLC | 5 326 | 2,92 | 235 | 9,35 | ||||
| 2025-07-09 | 13F | Lineweaver Wealth Advisors, LLC | 26 723 | −7,37 | 1 177 | −1,59 | ||||
| 2025-08-12 | 13F | SRS Capital Advisors, Inc. | 8 216 | −0,04 | 362 | 6,18 | ||||
| 2025-08-27 | 13F/A | Brinker Capital Investments, LLC | 197 732 | 91,24 | 8 710 | 103,17 | ||||
| 2025-08-12 | 13F | BlackRock, Inc. | 2 639 | 116 | ||||||
| 2025-07-29 | 13F | AssuredPartners Investment Advisors, LLC | 0 | −100,00 | 0 | |||||
| 2025-07-21 | 13F | Patriot Financial Group Insurance Agency, LLC | 40 576 | 1,69 | 1 787 | 8,04 | ||||
| 2025-08-12 | 13F | New Republic Capital, LLC | 11 964 | 0,00 | 527 | 6,25 | ||||
| 2025-07-22 | 13F | Belpointe Asset Management LLC | 9 152 | 17,88 | 403 | 25,55 | ||||
| 2025-08-14 | 13F | Integrated Wealth Concepts LLC | 105 676 | −0,94 | 4 655 | 5,25 | ||||
| 2025-07-28 | 13F | Sagespring Wealth Partners, Llc | 7 407 | 5,48 | 326 | 12,03 | ||||
| 2025-08-14 | 13F | First Commonwealth Financial Corp /pa/ | 80 660 | 0,00 | 3 553 | 6,25 | ||||
| 2025-07-29 | 13F | Stratos Wealth Advisors, LLC | 17 659 | 0,00 | 778 | 6,15 | ||||
| 2025-07-31 | 13F | Cambridge Investment Research Advisors, Inc. | 139 596 | −0,06 | 6 | 20,00 | ||||
| 2025-08-06 | 13F | AE Wealth Management LLC | 43 321 | −23,33 | 1 908 | −18,57 | ||||
| 2025-08-06 | 13F | Savant Capital, LLC | 7 710 | 0,00 | 340 | 6,27 | ||||
| 2025-08-07 | 13F | Lakeridge Wealth Management LLC | 23 865 | −0,09 | 1 051 | 6,16 | ||||
| 2025-07-07 | 13F | Schulz Wealth, LTD. | 19 755 | −6,49 | 870 | −0,68 | ||||
| 2025-07-25 | 13F | Mitchell Capital Management Co | 0 | −100,00 | 0 | |||||
| 2025-07-28 | 13F | Elmwood Wealth Management, Inc. | 86 191 | 2,95 | 3 797 | 9,36 | ||||
| 2025-07-15 | 13F | Armis Advisers, LLC | 37 674 | 0,93 | 1 660 | 7,24 | ||||
| 2025-07-22 | 13F | Berger Financial Group, Inc | 7 924 | 0,00 | 349 | 6,40 | ||||
| 2025-08-06 | 13F | Founders Financial Securities Llc | 40 479 | 25,82 | 1 783 | 34,57 | ||||
| 2025-08-05 | 13F | WorthPointe, LLC | 52 613 | 0,59 | 2 318 | 6,82 | ||||
| 2025-08-11 | 13F | Avantax Planning Partners, Inc. | 8 202 | 0,00 | 361 | 6,18 | ||||
| 2025-07-23 | 13F | Motiv8 Investments LLC | 166 707 | −1,68 | 7 343 | 4,44 | ||||
| 2025-08-01 | 13F | Delta Investment Management, LLC | 10 199 | −15,91 | 449 | −10,56 | ||||
| 2025-08-01 | 13F | Envestnet Asset Management Inc | 354 921 | 10,41 | 15 634 | 17,28 | ||||
| 2025-08-08 | 13F | Wealth Alliance | 71 641 | −0,11 | 3 156 | 6,09 | ||||
| 2025-07-16 | 13F | PFS Partners, LLC | 2 872 | 0,00 | 127 | 5,88 | ||||
| 2025-07-22 | 13F | Diligent Investors, LLC | 69 478 | 0,00 | 3 061 | 6,21 | ||||
| 2025-08-08 | 13F | Bailard, Inc. | 5 650 | 0,00 | 249 | 5,98 | ||||
| 2025-07-16 | 13F | ORG Partners LLC | 1 000 | −23,08 | 44 | −20,37 | ||||
| 2025-08-12 | 13F | LPL Financial LLC | 670 791 | 1,93 | 29 548 | 8,27 | ||||
| 2025-08-15 | 13F | Kestra Advisory Services, LLC | 182 762 | 30,40 | 8 051 | 38,51 | ||||
| 2025-07-23 | 13F | Allegiance Financial Group Advisory Services LLC | 7 585 | −9,92 | 334 | −4,30 | ||||
| 2025-08-11 | 13F | WPWealth LLP | 0 | −100,00 | 0 | −100,00 | ||||
| 2025-08-01 | 13F | Corrado Advisors, Llc | 48 566 | −0,44 | 2 139 | 5,73 | ||||
| 2025-07-25 | 13F | We Are One Seven, LLC | 12 931 | 570 | ||||||
| 2025-08-06 | 13F | Rps Advisory Solutions Llc | 30 396 | 11,60 | 1 339 | 18,51 | ||||
| 2025-08-07 | 13F | Allworth Financial LP | 477 | 0,00 | 21 | 10,53 | ||||
| 2025-07-30 | 13F | Brookstone Capital Management | 782 663 | −5,27 | 34 476 | 0,62 | ||||
| 2025-08-14 | 13F | Jane Street Group, Llc | 0 | −100,00 | 0 | |||||
| 2025-08-11 | 13F | Outlook Wealth Advisors, LLC | 9 005 | 0,00 | 397 | 6,17 | ||||
| 2025-08-01 | 13F | FSA Advisors, Inc. | 47 396 | −0,15 | 2 088 | 6,05 | ||||
| 2025-07-18 | 13F | Northeast Financial Group, Inc. | 0 | −100,00 | 0 | |||||
| 2025-08-07 | 13F | Resources Investment Advisors, LLC. | 100 557 | 63,96 | 4 430 | 74,16 | ||||
| 2025-05-16 | 13F/A | Kestra Investment Management, LLC | 0 | −100,00 | 0 | |||||
| 2025-08-01 | 13F | Integral Investment Advisors, Inc. | 5 080 | 0,00 | 224 | 6,19 | ||||
| 2025-08-11 | 13F | Bellwether Advisors, LLC | 269 012 | −0,02 | 11 850 | 6,20 | ||||
| 2025-08-14 | 13F | Mml Investors Services, Llc | 854 004 | −8,71 | 38 | −2,63 | ||||
| 2025-07-29 | 13F | Commons Capital, Llc | 7 582 | 334 | ||||||
| 2025-08-05 | 13F | Mma Asset Management Llc | 5 393 | 0,00 | 238 | 6,28 | ||||
| 2025-08-12 | 13F | MAI Capital Management | 130 111 | −27,53 | 5 731 | −23,02 | ||||
| 2025-07-11 | 13F | AA Financial Advisors, LLC | 190 959 | −0,10 | 8 412 | 6,12 | ||||
| 2025-05-15 | 13F/A | Orion Portfolio Solutions, LLC | 103 394 | 243,15 | 4 288 | 236,76 | ||||
| 2025-08-01 | 13F | Ashton Thomas Private Wealth, LLC | 11 210 | 13,28 | 494 | 20,24 | ||||
| 2025-08-13 | 13F | Virtue Capital Management, LLC | 0 | −100,00 | 0 | |||||
| 2025-07-28 | 13F | Compass Advisory Group LLC | 72 939 | 11,32 | 3 213 | 18,22 | ||||
| 2025-07-17 | 13F | Wagner Wealth Management, Llc | 2 000 | 0,00 | 88 | 7,32 | ||||
| 2025-07-28 | 13F | Mutual Advisors, LLC | 31 281 | −1,05 | 1 400 | 7,45 | ||||
| 2025-07-28 | 13F | Harbour Investments, Inc. | 46 365 | −1,75 | 2 042 | 4,40 | ||||
| 2025-08-14 | 13F | Citadel Advisors Llc | 18 932 | 834 | ||||||
| 2025-07-28 | 13F | Kiker Wealth Management, LLC | 104 | 0,00 | 5 | 0,00 | ||||
| 2025-08-05 | 13F | Sigma Planning Corp | 10 372 | −13,31 | 457 | −8,06 | ||||
| 2025-08-14 | 13F | Snowden Capital Advisors LLC | 8 497 | 0,00 | 374 | 6,25 | ||||
| 2025-07-10 | 13F | Three Seasons Wealth, LLC | 5 398 | 0,00 | 238 | 6,28 | ||||
| 2025-07-30 | 13F | Evermay Wealth Management Llc | 64 392 | 0,00 | 2 836 | 6,22 | ||||
| 2025-08-12 | 13F | Long Island Wealth Management, Inc. | 401 391 | 286,10 | 17 681 | 310,14 | ||||
| 2025-08-14 | 13F | Kovitz Investment Group Partners, LLC | 370 275 | −1,07 | 16 311 | 5,08 | ||||
| 2025-07-03 | 13F | Fiduciary Financial Group, Llc | 8 432 | 0,00 | 371 | 9,79 | ||||
| 2025-07-10 | 13F | Atticus Wealth Management, Llc | 13 348 | 0,00 | 588 | 6,15 | ||||
| 2025-08-04 | 13F | Integrity Alliance, Llc. | 15 952 | −24,21 | 703 | −19,50 | ||||
| 2025-08-14 | 13F | Aqr Capital Management Llc | 28 300 | −35,01 | 1 247 | −30,97 | ||||
| 2025-07-23 | 13F | Castle Rock Wealth Management, LLC | 32 563 | 0,00 | 1 447 | 7,19 | ||||
| 2025-08-13 | 13F | Continuum Advisory, LLC | 34 571 | −0,20 | 1 523 | 5,99 | ||||
| 2025-08-12 | 13F | Gladstone Institutional Advisory LLC | 0 | −100,00 | 0 | |||||
| 2025-08-13 | 13F | Cresset Asset Management, LLC | 102 529 | 1,77 | 4 516 | 8,12 | ||||
| 2025-08-14 | 13F | Alliancebernstein L.p. | 3 828 314 | −1,77 | 168 637 | 4,34 | ||||
| 2025-07-09 | 13F | Fragasso Group Inc. | 5 022 | 0,00 | 221 | 6,25 | ||||
| 2025-07-24 | 13F | IFP Advisors, Inc | 103 236 | 0,78 | 4 548 | 7,04 | ||||
| 2025-08-15 | 13F | Chapman Financial Group, Llc | 4 275 | 188 | ||||||
| 2025-04-29 | 13F | Capital Investment Advisory Services, LLC | 0 | −100,00 | 0 | |||||
| 2025-08-14 | 13F | Comerica Bank | 2 500 | 0,00 | 110 | 6,80 | ||||
| 2025-08-19 | 13F | Advisory Services Network, LLC | 40 046 | −0,00 | 1 786 | 7,59 | ||||
| 2025-08-13 | 13F | Capital Analysts, Inc. | 1 178 | 0,00 | 0 | |||||
| 2025-07-14 | 13F | Chris Bulman Inc | 24 479 | −1,33 | 1 078 | 4,86 | ||||
| 2025-07-18 | 13F | Parkside Investments, LLC | 11 875 | −2,06 | 523 | 4,18 | ||||
| 2025-08-13 | 13F | VestGen Advisors, LLC | 0 | −100,00 | 0 | |||||
| 2025-08-14 | 13F | UBS Group AG | 10 463 | 76,38 | 461 | 86,99 | ||||
| 2025-07-22 | 13F | My Personal CFO, LLC | 10 205 | 0,00 | 450 | 6,15 | ||||
| 2025-07-30 | 13F | Red Crane Wealth Management, Llc | 38 477 | −65,72 | 1 695 | −63,60 | ||||
| 2025-08-07 | 13F | Runnymede Capital Advisors, Inc. | 0 | −100,00 | 0 | |||||
| 2025-08-08 | 13F | Kingsview Wealth Management, LLC | 5 850 | 0,00 | 258 | 6,20 | ||||
| 2025-07-31 | 13F | Cardinal Point Capital Management, ULC | 7 960 | 0,00 | 351 | 6,06 | ||||
| 2025-04-22 | 13F/A | NorthRock Partners, LLC | 0 | −100,00 | 0 | −100,00 | ||||
| 2025-07-29 | 13F | Straight Path Wealth Management | 6 934 | 14,03 | 305 | 21,03 | ||||
| 2025-07-16 | 13F | Crown Wealth Group, LLC | 28 387 | 10,47 | 1 250 | 17,37 | ||||
| 2025-07-14 | 13F | Southland Equity Partners LLC | 433 565 | −0,30 | 19 099 | 5,90 | ||||
| 2025-07-24 | 13F | Bernard Wealth Management Corp. | 22 935 | −2,15 | 1 010 | 4,02 | ||||
| 2025-08-11 | 13F | HighTower Advisors, LLC | 133 496 | −3,22 | 5 880 | 2,80 | ||||
| 2025-08-12 | 13F | Wood Tarver Financial Group, LLC | 11 972 | 304,19 | 1 | −100,00 | ||||
| 2025-07-02 | 13F | HBW Advisory Services LLC | 54 678 | 1,14 | 2 409 | 7,45 | ||||
| 2025-08-13 | 13F | Townsquare Capital Llc | 20 713 | −73,59 | 912 | −71,96 | ||||
| 2025-08-08 | 13F | Cetera Investment Advisers | 257 903 | 3,60 | 11 361 | 10,05 | ||||
| 2025-08-13 | 13F | Cerity Partners LLC | 6 605 | 291 | ||||||
| 2025-07-15 | 13F | BCS Wealth Management | 23 897 | −4,21 | 1 | 0,00 | ||||
| 2025-08-14 | 13F | Core Wealth Advisors, Inc. | 12 475 | 0,00 | 550 | 6,19 | ||||
| 2025-07-29 | 13F | Chicago Partners Investment Group LLC | 15 577 | 0,00 | 693 | 7,11 | ||||
| 2025-07-10 | 13F | ARS Wealth Advisors Group, LLC | 13 186 | −18,47 | 581 | −13,43 | ||||
| 2025-08-15 | 13F | Nikulski Financial, Inc. | 48 430 | −4,16 | 2 133 | 1,81 | ||||
| 2025-07-21 | 13F | Catalina Capital Group, LLC | 126 543 | 1 096,96 | 5 574 | 1 172,60 | ||||
| 2025-08-14 | 13F | Garden State Investment Advisory Services LLC | 4 886 | −8,18 | 215 | −2,27 | ||||
| 2025-07-14 | 13F | Kfg Wealth Management, Llc | 50 122 | −0,02 | 2 208 | 6,16 | ||||
| 2025-07-17 | 13F | Janney Montgomery Scott LLC | 223 936 | 7,63 | 10 | 12,50 | ||||
| 2025-08-14 | 13F | Sunbelt Securities, Inc. | 17 845 | 266,43 | 754 | 274,63 | ||||
| 2025-08-14 | 13F | Mariner, LLC | 9 382 | 0,00 | 413 | 6,17 | ||||
| 2025-08-08 | 13F | Gts Securities Llc | 0 | −100,00 | 0 | |||||
| 2025-07-25 | 13F | Sequoia Financial Advisors, LLC | 22 427 | 0,00 | 988 | 6,13 | ||||
| 2025-07-21 | 13F | Triad Wealth Partners, LLC | 52 823 | 91,32 | 2 327 | 103,32 | ||||
| 2025-07-25 | 13F | Sovereign Financial Group, Inc. | 5 700 | −4,95 | 251 | 1,21 | ||||
| 2025-07-17 | 13F | Smith Anglin Financial, LLC | 20 116 | 0,00 | 886 | 6,24 | ||||
| 2025-07-21 | 13F | Ameritas Advisory Services, LLC | 8 346 | −50,83 | 368 | −47,80 | ||||
| 2025-08-05 | 13F | BCGM Wealth Management, LLC | 122 471 | 1,11 | 5 395 | 7,41 | ||||
| 2025-07-29 | 13F | BKD Wealth Advisors, LLC | 193 837 | −7,69 | 8 539 | −1,94 | ||||
| 2025-05-27 | 13F | Jacobi Capital Management LLC | 0 | −100,00 | 0 | |||||
| 2025-08-14 | 13F | Colony Group, LLC | 39 361 | −3,34 | 1 734 | 2,67 | ||||
| 2025-08-14 | 13F | Horizon Investments, LLC | 40 361 | 82,54 | 1 778 | 94,00 | ||||
| 2025-07-22 | 13F | Beacon Financial Advisory LLC | 10 758 | −8,50 | 474 | −2,87 | ||||
| 2025-08-12 | 13F | Change Path, LLC | 33 745 | 64,15 | 1 486 | 74,41 | ||||
| 2025-07-11 | 13F | Farther Finance Advisors, LLC | 75 735 | 155,93 | 3 336 | 171,44 | ||||
| 2025-07-21 | 13F | Ascent Group, LLC | 4 611 | 203 | ||||||
| 2025-08-01 | 13F | Stuart Chaussee & Associates, Inc. | 46 625 | −7,53 | 2 054 | −1,77 | ||||
| 2025-08-11 | 13F | Principal Securities, Inc. | 62 955 | 1,37 | 2 773 | 5,72 | ||||
| 2025-07-31 | 13F | Buckingham Strategic Partners | 7 585 | 334 | ||||||
| 2025-07-31 | 13F | Gill Capital Partners, Llc | 112 619 | −3,45 | 4 961 | 2,54 | ||||
| 2025-07-14 | 13F | CRA Financial Services, LLC | 87 359 | −2,18 | 3 848 | 3,92 | ||||
| 2025-08-14 | 13F | Betterment LLC | 5 469 | −2,11 | 0 | |||||
| 2025-08-14 | 13F | Certified Advisory Corp | 13 782 | −0,83 | 607 | 5,38 | ||||
| 2025-08-14 | 13F | Benjamin Edwards Inc | 243 042 | 21,86 | 10 706 | 29,46 | ||||
| 2025-07-30 | 13F | Phoenix Holdings Ltd. | 25 790 | 0,00 | 1 133 | 6,29 | ||||
| 2025-08-12 | 13F | Archer Investment Corp | 7 000 | 0,00 | 308 | 6,21 | ||||
| 2025-07-28 | 13F | Axxcess Wealth Management, Llc | 5 818 | 0,00 | 256 | 6,22 | ||||
| 2025-07-24 | 13F | Stonebridge Financial Group, LLC | 0 | −100,00 | 0 | |||||
| 2025-07-30 | 13F | Strategic Blueprint, LLC | 7 922 | −0,81 | 349 | 5,14 | ||||
| 2025-08-14 | 13F | Ausdal Financial Partners, Inc. | 0 | −100,00 | 0 | |||||
| 2025-07-14 | 13F | U.S. Capital Wealth Advisors, LLC | 35 322 | −2,09 | 1 556 | 3,94 | ||||
| 2025-08-08 | 13F | Firestone Capital Management | 20 535 | −12,38 | 905 | −6,90 | ||||
| 2025-08-12 | 13F | Winnow Wealth Llc | 0 | 0 | ||||||
| 2025-08-01 | 13F | Gwn Securities Inc. | 8 228 | −12,64 | 362 | −7,18 | ||||
| 2025-08-12 | 13F | Tradition Wealth Management, LLC | 20 906 | −0,08 | 921 | 6,11 | ||||
| 2025-07-24 | 13F | Vantage Point Financial LLC | 7 332 | 323 | ||||||
| 2025-07-24 | 13F | Blair William & Co/il | 351 885 | 0,23 | 15 501 | 6,46 | ||||
| 2025-07-11 | 13F | Compass Ion Advisors, LLC | 5 931 | 0,00 | 261 | 6,53 | ||||
| 2025-08-12 | 13F | Jpmorgan Chase & Co | 59 993 | 5,42 | 2 643 | 12,00 | ||||
| 2025-08-15 | 13F | Captrust Financial Advisors | 31 953 | −0,16 | 1 408 | 6,03 | ||||
| 2025-08-12 | 13F | O'shaughnessy Asset Management, Llc | 3 | 0,00 | 0 | |||||
| 2025-08-12 | 13F | Weaver Consulting Group | 26 143 | 20,00 | 1 152 | 27,46 | ||||
| 2025-08-13 | 13F | Beacon Pointe Advisors, LLC | 176 457 | 4,04 | 7 773 | 10,51 | ||||
| 2025-08-11 | 13F | Anfield Capital Management, LLC | 304 | 13 | ||||||
| 2025-09-04 | 13F/A | Advisor Group Holdings, Inc. | 990 360 | −9,06 | 43 625 | −3,40 |