Grundläggande statistik
| Institutionella ägare | 154 total, 154 long only, 0 short only, 0 long/short - change of −3,14% MRQ |
| Genomsnittlig portföljallokering | 0.1516 % - change of 7,74% MRQ |
| Institutionella aktier (lång) | 19 188 172 (ex 13D/G) - change of 0,22MM shares 1,15% MRQ |
| Institutionellt värde (lång) | $ 377 071 USD ($1000) |
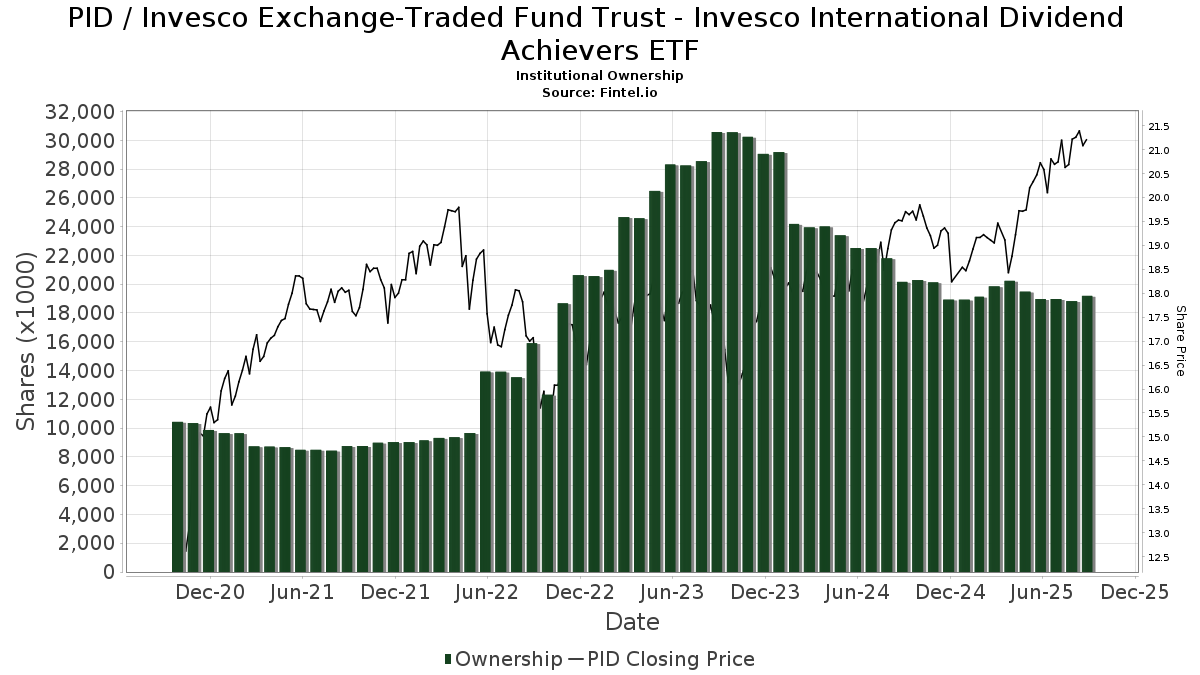
Institutionellt ägande och aktieägare
Invesco Exchange-Traded Fund Trust - Invesco International Dividend Achievers ETF (US:PID) har 154 Institutionella ägare och aktieägare som har lämnat in 13D/G- eller 13F-formulär till Securities Exchange Commission (SEC). Dessa institut innehar totalt 19,188,172 aktier. Största aktieägare inkluderar Morgan Stanley, Wells Fargo & Company/mn, LPL Financial LLC, Modern Wealth Management, LLC, Kaye Capital Management, Strategic Wealth Partners, Ltd., UBS Group AG, Bank Of America Corp /de/, Ameriprise Financial Inc, and Jones Financial Companies Lllp .
Invesco Exchange-Traded Fund Trust - Invesco International Dividend Achievers ETF (NasdaqGM:PID) Institutionell ägarstruktur visar institutioners och fonders nuvarande positioner i företaget, samt de senaste förändringarna i positionernas storlek. Större aktieägare kan vara enskilda investerare, fonder, hedgefonder eller institutioner. Bilaga 13D visar att investeraren äger (eller ägde) mer än 5% av företaget och avser (eller avsåg) att aktivt eftersträva en förändring av affärsstrategin. Schedule 13G indikerar en passiv investering på över 5%.
The share price as of September 8, 2025 is 21,17 / share. Previously, on September 9, 2024, the share price was 19,56 / share. This represents an increase of 8,23% over that period.
Fondsentimentets poäng
Fondsentimentet poängen(fka Ägarackumulation-poäng) visar vilka aktier som är mest köpta av fonder. Det är resultatet av en sofistikerad kvantitativ flerfaktormodell som identifierar företag med de högsta nivåerna av institutionell ackumulering. Poängsättningsmodellen använder en kombination av den totala ökningen av redovisade ägare, förändringarna i portföljallokeringarna för dessa ägare och andra mått. Siffran sträcker sig från 0 till 100, där högre siffror indikerar en högre nivå av ackumulering i förhållande till sina konkurrenter, och 50 är genomsnittet.
Uppdateringsfrekvens: Dagligen
Se Ownership Explorer, som innehåller en lista över de högst rankade företagen.
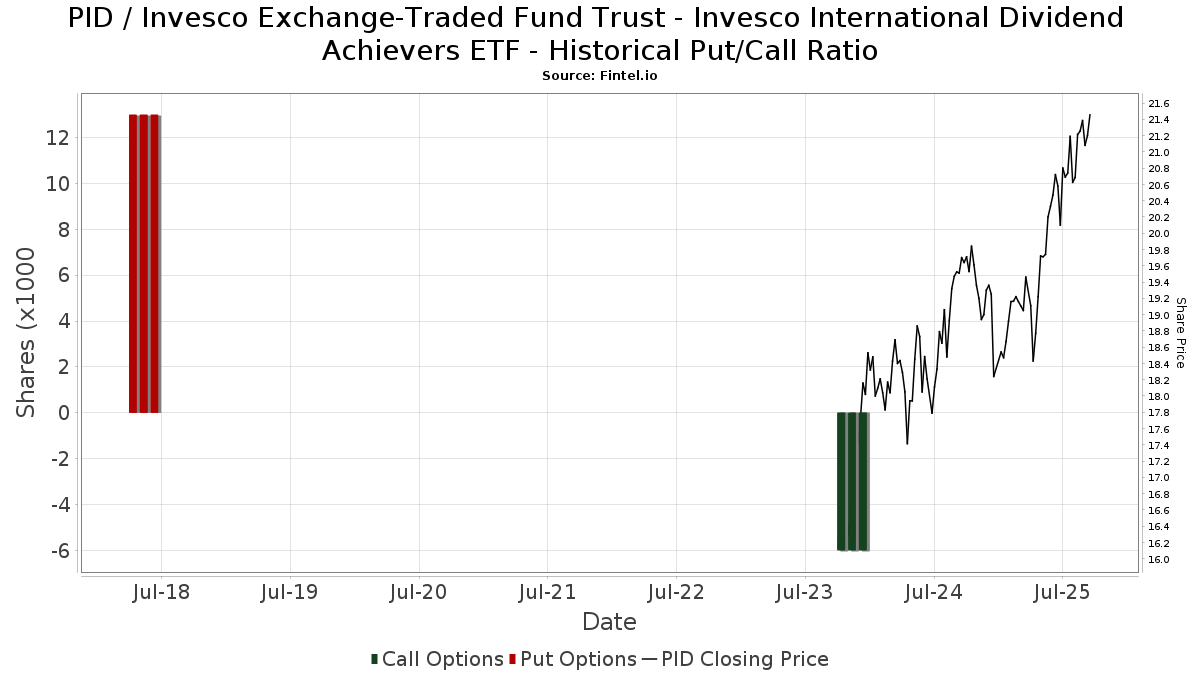
Institutionell sälj/köp-kvot
Förutom att rapportera vanliga eget kapital- och skuldemissioner måste institutioner med mer än 100MM tillgångar under förvaltning också avslöja sina innehav av sälj- och köpoptioner. Eftersom säljoptioner i allmänhet indikerar ett negativt sentiment och köpoptioner indikerar ett positivt sentiment, kan vi få en uppfattning om det övergripande institutionella sentimentet genom att plotta förhållandet mellan säljoptioner och köpoptioner. Diagrammet till höger visar det historiska förhållandet mellan sälj- och köpoptioner för detta instrument.
Genom att använda sälj/köp-kvoten som en indikator på aktieägarnas sentiment undviker man en av de största bristerna med att använda det totala institutionella ägandet, nämligen att en betydande del av de förvaltade tillgångarna investeras passivt för att följa index. Passivt förvaltade fonder köper vanligtvis inte optioner, så indikatorn för sälj/köp-kvoten ger en bättre bild av stämningen i aktivt förvaltade fonder.
13F- och NPORT-arkiveringar
Detaljer om 13F-arkiveringar är gratis. Detaljer om NP-arkiveringar kräver ett premiummedlemskap. Gröna rader indikerar nya positioner. Röda rader indikerar stängda positioner. Klicka på länk symbolen för att se hela transaktionshistoriken.
Uppgradera
för att låsa upp premiumdata och exportera till Excel ![]() .
.
| Fil Datum | Källa | Investerare | Typ | Genomsnittligt pris (beräknat) |
Aktier | Δ Aktier (%) |
Rapporterat värde (1000 USD) |
Δ Värde (%) |
Portföljallokering (%) |
|
|---|---|---|---|---|---|---|---|---|---|---|
| 2025-07-28 | 13F | Nestegg Advisors, Inc. | 55 957 | 1,56 | 1 147 | 9,24 | ||||
| 2025-08-14 | 13F | Jane Street Group, Llc | 0 | −100,00 | 0 | |||||
| 2025-08-04 | 13F | Center for Financial Planning, Inc. | 1 521 | 0,00 | 31 | 6,90 | ||||
| 2025-07-10 | 13F | Wealth Enhancement Advisory Services, Llc | 343 747 | −5,46 | 7 167 | 3,38 | ||||
| 2025-08-11 | 13F | Aptus Capital Advisors, LLC | 1 029 | 0,00 | 21 | 10,53 | ||||
| 2025-08-19 | 13F | National Asset Management, Inc. | 0 | −100,00 | 0 | |||||
| 2025-07-23 | 13F | Bellevue Asset Management, Llc | 359 | 1,41 | 7 | 16,67 | ||||
| 2025-08-08 | 13F | Capital Investment Advisory Services, LLC | 12 563 | 0,00 | 258 | 7,53 | ||||
| 2025-08-14 | 13F | Financial Advisory Service, Inc. | 996 | 1,32 | 20 | 11,11 | ||||
| 2025-08-18 | 13F/A | National Bank Of Canada /fi/ | 1 660 | −28,14 | 34 | −23,26 | ||||
| 2025-07-14 | 13F | GAMMA Investing LLC | 1 792 | 0,00 | 37 | 5,88 | ||||
| 2025-08-08 | 13F | Cetera Investment Advisers | 119 140 | −1,27 | 2 442 | 6,13 | ||||
| 2025-08-14 | 13F | Comerica Bank | 17 994 | 38,79 | 369 | 48,99 | ||||
| 2025-08-04 | 13F | Assetmark, Inc | 12 | 0 | ||||||
| 2025-08-07 | 13F | Addison Advisors LLC | 720 | −5,26 | 15 | 0,00 | ||||
| 2025-07-11 | 13F | Coastwise Capital Group, LLC | 10 408 | −0,14 | 213 | 7,58 | ||||
| 2025-08-15 | 13F | Kestra Advisory Services, LLC | 31 098 | 54,92 | 638 | 66,75 | ||||
| 2025-08-13 | 13F | Continuum Advisory, LLC | 76 691 | 21,96 | 1 572 | 31,11 | ||||
| 2025-08-14 | 13F | Modern Wealth Management, LLC | 1 008 078 | 20 666 | ||||||
| 2025-08-08 | 13F | Emerald Investment Partners, Llc | 40 425 | −1,62 | 829 | 5,75 | ||||
| 2025-07-18 | 13F | SimpliFi, Inc. | 22 238 | 1,29 | 456 | 8,85 | ||||
| 2025-05-12 | 13F | Sandy Spring Bank | 27 382 | 0,00 | 522 | 4,19 | ||||
| 2025-07-15 | 13F | North Star Investment Management Corp. | 0 | −100,00 | 0 | |||||
| 2025-08-14 | 13F | Visionary Wealth Advisors | 13 876 | 0,00 | 284 | 7,58 | ||||
| 2025-07-24 | 13F | Stonebridge Financial Group, LLC | 0 | −100,00 | 0 | |||||
| 2025-05-13 | 13F | Tocqueville Asset Management L.p. | 0 | −100,00 | 0 | −100,00 | ||||
| 2025-08-11 | 13F | HighTower Advisors, LLC | 193 351 | 1,17 | 3 964 | 8,75 | ||||
| 2025-08-13 | 13F | Cheviot Value Management, LLC | 131 064 | 3,92 | 2 733 | 10,47 | ||||
| 2025-07-23 | 13F | Eagle Strategies LLC | 44 024 | −13,32 | 902 | −6,82 | ||||
| 2025-08-11 | 13F | Western Wealth Management, LLC | 12 794 | 0,66 | 262 | 8,26 | ||||
| 2025-07-16 | 13F | Signature Resources Capital Management, LLC | 65 | 0,00 | 1 | 0,00 | ||||
| 2025-08-14 | 13F | Wiley Bros.-aintree Capital, Llc | 81 924 | −21,56 | 1 674 | −15,75 | ||||
| 2025-05-13 | 13F | High Falls Advisors, Inc | 0 | −100,00 | 0 | |||||
| 2025-07-31 | 13F | BIP Wealth, LLC | 21 800 | −11,02 | 447 | −4,50 | ||||
| 2025-04-29 | 13F | Element Wealth, LLC | 0 | −100,00 | 0 | |||||
| 2025-08-13 | 13F | VestGen Advisors, LLC | 112 166 | −1,19 | 2 302 | 6,38 | ||||
| 2025-05-05 | 13F | Riverchase Wealth Management, Llc | 0 | −100,00 | 0 | |||||
| 2025-08-05 | 13F | GHP Investment Advisors, Inc. | 1 710 | 1,30 | 35 | 9,38 | ||||
| 2025-08-05 | 13F | AAFCPAs Wealth Management, LLC | 79 195 | −5,02 | 1 624 | 2,08 | ||||
| 2025-04-21 | 13F | Nelson, Van Denburg & Campbell Wealth Management Group, LLC | 0 | −100,00 | 0 | |||||
| 2025-07-31 | 13F | GLOBALT Investments LLC / GA | 32 079 | −10,30 | 658 | −3,52 | ||||
| 2025-07-08 | 13F | Zrc Wealth Management, Llc | 380 | 0,00 | 8 | 0,00 | ||||
| 2025-08-15 | 13F | Equitable Holdings, Inc. | 452 396 | 11,56 | 9 274 | 19,94 | ||||
| 2025-08-04 | 13F | Flagship Harbor Advisors, Llc | 16 735 | 7,50 | 343 | 15,88 | ||||
| 2025-08-14 | 13F | Qube Research & Technologies Ltd | 21 | 0,00 | 0 | |||||
| 2025-08-07 | 13F | Atala Financial Inc | 11 095 | 227 | ||||||
| 2025-08-12 | 13F | Steward Partners Investment Advisory, Llc | 1 856 | 40,08 | 38 | 52,00 | ||||
| 2025-08-11 | 13F | Private Advisor Group, LLC | 37 794 | −30,99 | 775 | −25,86 | ||||
| 2025-07-28 | 13F | SFG Wealth Management, LLC. | 0 | −100,00 | 0 | |||||
| 2025-05-05 | 13F | Transce3nd, LLC | 0 | −100,00 | 0 | |||||
| 2025-07-18 | 13F | Bartlett & Co. Wealth Management Llc | 265 | 0,00 | 5 | 0,00 | ||||
| 2025-08-12 | 13F | LPL Financial LLC | 1 223 329 | −0,02 | 25 078 | 7,47 | ||||
| 2025-07-25 | 13F | Atria Wealth Solutions, Inc. | 10 836 | 4,33 | 222 | 12,12 | ||||
| 2025-08-11 | 13F | Strategic Wealth Partners, Ltd. | 958 671 | 0,73 | 19 653 | 6,93 | ||||
| 2025-04-23 | 13F | Silver Lake Advisory, LLC | 0 | −100,00 | 0 | |||||
| 2025-07-15 | 13F | BCS Wealth Management | 27 545 | −3,37 | 1 | |||||
| 2025-07-28 | 13F | Mutual Advisors, LLC | 19 440 | −29,28 | 409 | −22,98 | ||||
| 2025-08-07 | 13F | Legacy Financial Advisors, Inc. | 41 118 | 9,51 | 843 | 17,60 | ||||
| 2025-08-08 | 13F | Creative Planning | 112 265 | 4,58 | 2 301 | 12,41 | ||||
| 2025-08-12 | 13F | Proequities, Inc. | 0 | 0 | ||||||
| 2025-07-31 | 13F | Oak Harbor Wealth Partners, Llc | 187 | 4 | ||||||
| 2025-08-13 | 13F | Capital Analysts, Inc. | 42 898 | 0,44 | 1 | |||||
| 2025-07-17 | 13F | Wagner Wealth Management, Llc | 902 | −2,80 | 18 | 5,88 | ||||
| 2025-08-01 | 13F | Envestnet Asset Management Inc | 219 472 | −4,64 | 4 499 | 2,51 | ||||
| 2025-08-05 | 13F | Alexander Randolph Advisory Inc | 25 256 | 0,04 | 518 | 7,48 | ||||
| 2025-08-12 | 13F | Cynosure Management, Llc | 24 523 | 0,00 | 503 | 7,49 | ||||
| 2025-08-13 | 13F | Northwestern Mutual Wealth Management Co | 254 266 | 0,24 | 5 212 | 7,75 | ||||
| 2025-07-24 | 13F | IFP Advisors, Inc | 2 038 | 0,00 | 42 | 7,89 | ||||
| 2025-07-22 | 13F | Accel Wealth Management | 73 810 | −20,37 | 1 513 | −14,37 | ||||
| 2025-07-30 | 13F | Principle Wealth Partners Llc | 38 262 | 0,00 | 784 | 7,54 | ||||
| 2025-05-13 | 13F/A | Magnolia Capital Advisors Llc | 18 171 | 0,00 | 333 | 2,15 | ||||
| 2025-07-11 | 13F | Farther Finance Advisors, LLC | 1 424 | 29 | ||||||
| 2025-08-11 | 13F | Principal Securities, Inc. | 3 525 | 8,39 | 72 | 22,03 | ||||
| 2025-07-21 | 13F | Ameritas Advisory Services, LLC | 9 820 | 201 | ||||||
| 2025-07-24 | 13F | Blair William & Co/il | 4 560 | 0,00 | 93 | 8,14 | ||||
| 2025-08-13 | 13F | Flow Traders U.s. Llc | 96 869 | −46,50 | 2 | −66,67 | ||||
| 2025-07-23 | 13F | Nbt Bank N A /ny | 1 900 | 0,00 | 39 | 5,56 | ||||
| 2025-08-12 | 13F | Global Retirement Partners, LLC | 2 113 | −2,49 | 43 | 10,26 | ||||
| 2025-05-01 | 13F | Schechter Investment Advisors, LLC | 10 274 | 0,00 | 196 | 3,72 | ||||
| 2025-07-22 | 13F | Merit Financial Group, LLC | 36 785 | −4,26 | 754 | 3,01 | ||||
| 2025-07-25 | 13F | NorthRock Partners, LLC | 1 222 | 1,24 | 25 | 8,70 | ||||
| 2025-08-13 | 13F | Cerity Partners LLC | 45 028 | 0,36 | 923 | 7,95 | ||||
| 2025-07-16 | 13F | Strategic Investment Solutions, Inc. /IL | 83 | 1,22 | 2 | 0,00 | ||||
| 2025-08-14 | 13F/A | Rockefeller Capital Management L.P. | 15 959 | 0,15 | 327 | 7,92 | ||||
| 2025-08-15 | 13F | Lantern Wealth Advisors, LLC | 10 000 | 0,00 | 205 | 12,02 | ||||
| 2025-07-24 | 13F | Aurora Private Wealth, Inc. | 0 | −100,00 | 0 | |||||
| 2025-07-08 | 13F | Parallel Advisors, LLC | 1 530 | 0,00 | 31 | 6,90 | ||||
| 2025-05-07 | 13F | Richards, Merrill & Peterson, Inc. | 0 | −100,00 | 0 | |||||
| 2025-08-06 | 13F | Commonwealth Equity Services, Llc | 231 826 | −6,07 | 5 | 0,00 | ||||
| 2025-08-14 | 13F | Wells Fargo & Company/mn | 1 600 290 | −5,04 | 32 806 | 2,08 | ||||
| 2025-08-11 | 13F | First American Trust, Fsb | 117 955 | 2,72 | 2 418 | 10,46 | ||||
| 2025-07-31 | 13F | Cambridge Investment Research Advisors, Inc. | 239 626 | 3,98 | 5 | 0,00 | ||||
| 2025-08-14 | 13F | Federation des caisses Desjardins du Quebec | 15 029 | 0,00 | 308 | 7,69 | ||||
| 2025-08-14 | 13F | GWM Advisors LLC | 67 613 | 0,50 | 1 386 | 8,11 | ||||
| 2025-08-14 | 13F | Bank Of America Corp /de/ | 909 313 | 4,36 | 18 641 | 12,19 | ||||
| 2025-07-23 | 13F | Morton Capital Management LLC/CA | 256 253 | −2,24 | 5 253 | 5,10 | ||||
| 2025-08-14 | 13F | Two Sigma Investments, Lp | 0 | −100,00 | 0 | |||||
| 2025-05-02 | 13F | First Command Advisory Services, Inc. | 0 | −100,00 | 0 | −100,00 | ||||
| 2025-07-18 | 13F | Institute for Wealth Management, LLC. | 50 237 | −2,42 | 1 030 | 4,89 | ||||
| 2025-08-12 | 13F | Founders Financial Alliance, LLC | 9 671 | 0,76 | 198 | 8,20 | ||||
| 2025-07-15 | 13F | Genesis Wealth Advisors, LLC | 10 710 | 0,00 | 220 | 7,35 | ||||
| 2025-08-04 | 13F | Arkadios Wealth Advisors | 23 651 | 485 | ||||||
| 2025-08-12 | 13F | Wood Tarver Financial Group, LLC | 32 964 | −4,14 | 1 | −100,00 | ||||
| 2025-08-14 | 13F | Freedom Financial Partners LLC | 51 884 | 1,05 | 1 064 | 8,58 | ||||
| 2025-08-13 | 13F | Townsquare Capital Llc | 0 | −100,00 | 0 | |||||
| 2025-08-15 | 13F | Northeast Financial Consultants Inc | 61 943 | 0,00 | 1 270 | 7,45 | ||||
| 2025-08-05 | 13F | Bank Of Montreal /can/ | 5 289 | 3,58 | 108 | 11,34 | ||||
| 2025-08-06 | 13F | First Horizon Advisors, Inc. | 28 954 | −21,07 | 594 | −15,16 | ||||
| 2025-08-14 | 13F | Ameriprise Financial Inc | 847 494 | −1,90 | 16 908 | 2,63 | ||||
| 2025-08-14 | 13F | Citadel Advisors Llc | 15 810 | −7,84 | 324 | −0,92 | ||||
| 2025-07-29 | 13F | Private Trust Co Na | 713 | 0,00 | 15 | 7,69 | ||||
| 2025-08-14 | 13F | Guardian Wealth Advisors, Llc / Nc | 1 029 | 0,00 | 21 | 10,53 | ||||
| 2025-07-16 | 13F | Essex Financial Services, Inc. | 17 044 | 0,12 | 349 | 7,72 | ||||
| 2025-08-06 | 13F | AE Wealth Management LLC | 0 | −100,00 | 0 | |||||
| 2025-08-05 | 13F | GPS Wealth Strategies Group, LLC | 1 111 | 1,28 | 23 | 10,00 | ||||
| 2025-08-15 | 13F | Morgan Stanley | 3 131 687 | −9,79 | 64 200 | −3,02 | ||||
| 2025-08-08 | 13F | Gts Securities Llc | 0 | −100,00 | 0 | |||||
| 2025-08-04 | 13F | IFG Advisory, LLC | 30 579 | −0,98 | 627 | 6,46 | ||||
| 2025-08-05 | 13F | Integrity Financial Corp /WA | 273 | 6 | ||||||
| 2025-08-12 | 13F | Park Square Financial Group, LLC | 791 | 0,00 | 16 | 6,67 | ||||
| 2025-08-14 | 13F | Mercer Global Advisors Inc /adv | 0 | −100,00 | 0 | |||||
| 2025-08-05 | 13F | Flynn Zito Capital Management, Llc | 22 001 | 1,29 | 451 | 8,94 | ||||
| 2025-08-05 | 13F | Tsfg, Llc | 6 450 | 0,00 | 0 | |||||
| 2025-08-07 | 13F | Allworth Financial LP | 5 893 | 0,00 | 121 | 5,26 | ||||
| 2025-08-07 | 13F | Cahill Financial Advisors Inc | 227 036 | −2,49 | 4 654 | 4,82 | ||||
| 2025-08-14 | 13F | Mariner, LLC | 123 877 | −0,33 | 2 539 | 7,13 | ||||
| 2025-07-29 | 13F | Stephens Inc /ar/ | 19 800 | 8,79 | 406 | 16,71 | ||||
| 2025-07-31 | 13F | Brinker Capital Investments, LLC | 0 | −100,00 | 0 | −100,00 | ||||
| 2025-07-17 | 13F | Oakworth Capital, Inc. | 0 | −100,00 | 0 | |||||
| 2025-08-12 | 13F | Jpmorgan Chase & Co | 101 861 | 0,03 | 2 088 | 7,57 | ||||
| 2025-07-24 | 13F | Brandywine Oak Private Wealth Llc | 69 911 | 0,00 | 1 433 | 7,50 | ||||
| 2025-08-05 | 13F | Sigma Planning Corp | 14 011 | 20,69 | 287 | 29,86 | ||||
| 2025-08-12 | 13F | SRS Capital Advisors, Inc. | 9 636 | 198 | ||||||
| 2025-08-14 | 13F | UBS Group AG | 912 142 | 0,19 | 18 699 | 7,71 | ||||
| 2025-08-08 | 13F | Pnc Financial Services Group, Inc. | 2 390 | −3,59 | 49 | 2,13 | ||||
| 2025-09-04 | 13F/A | Advisor Group Holdings, Inc. | 322 602 | −6,80 | 6 615 | 0,18 | ||||
| 2025-08-14 | 13F | Fmr Llc | 8 125 | −9,25 | 167 | −2,35 | ||||
| 2025-08-15 | 13F | Captrust Financial Advisors | 12 864 | −2,38 | 264 | 4,78 | ||||
| 2025-08-14 | 13F | Royal Bank Of Canada | 259 480 | −1,19 | 5 320 | 6,25 | ||||
| 2025-07-30 | 13F | Parcion Private Wealth LLC | 63 232 | −1,62 | 1 296 | 5,80 | ||||
| 2025-07-17 | 13F | Sound Income Strategies, LLC | 191 | 0,00 | 4 | 0,00 | ||||
| 2025-07-31 | 13F | Brian Low Financial Group, Llc | 95 371 | 1 955 | ||||||
| 2025-08-01 | 13F | Winebrenner Capital Management Llc | 48 500 | 0,05 | 994 | 7,58 | ||||
| 2025-08-15 | 13F | Tower Research Capital LLC (TRC) | 36 | 1 | ||||||
| 2025-07-22 | 13F | Valley National Advisers Inc | 73 | 0,00 | 0 | |||||
| 2025-07-25 | 13F | Astoria Portfolio Advisors LLC. | 12 210 | 0,00 | 258 | 9,83 | ||||
| 2025-08-07 | 13F | CENTRAL TRUST Co | 733 | 15 | ||||||
| 2025-08-12 | 13F | MAI Capital Management | 1 582 | 0,00 | 32 | 6,67 | ||||
| 2025-03-18 | 13F/A | Bank Of America Corp /de/ | Call | 0 | −100,00 | 0 | −100,00 | |||
| 2025-05-14 | 13F | Susquehanna International Group, Llp | 0 | −100,00 | 0 | |||||
| 2025-08-12 | 13F | Calton & Associates, Inc. | 11 562 | 0,42 | 237 | 8,22 | ||||
| 2025-08-12 | 13F | PSI Advisors, LLC | 0 | −100,00 | 0 | |||||
| 2025-08-06 | 13F | Golden State Wealth Management, LLC | 29 451 | −21,64 | 604 | −15,78 | ||||
| 2025-08-14 | 13F | EP Wealth Advisors, Inc. | 7 560 | 155 | ||||||
| 2025-07-24 | 13F | Us Bancorp \de\ | 2 504 | −7,12 | 51 | 0,00 | ||||
| 2025-07-25 | 13F | Cwm, Llc | 127 | 49,41 | 0 | |||||
| 2025-08-12 | 13F | Kaye Capital Management | 1 008 078 | −6,70 | 20 666 | 0,30 | ||||
| 2025-08-18 | 13F | Geneos Wealth Management Inc. | 4 554 | 0,00 | 93 | 8,14 | ||||
| 2025-07-21 | 13F | DHJJ Financial Advisors, Ltd. | 36 | 0,00 | 1 | |||||
| 2025-08-13 | 13F | Jones Financial Companies Lllp | 551 873 | 54,56 | 11 220 | 64,77 | ||||
| 2025-07-14 | 13F | Southland Equity Partners LLC | 55 478 | −1,57 | 1 137 | 5,87 | ||||
| 2025-07-30 | 13F | Drive Wealth Management, Llc | 29 168 | 3,40 | 598 | 11,17 | ||||
| 2025-07-09 | 13F | Breakwater Capital Group | 40 011 | −2,21 | 820 | 5,13 | ||||
| 2025-07-24 | 13F | JNBA Financial Advisors | 1 025 | 0,00 | 21 | 10,53 | ||||
| 2025-08-21 | 13F | Aveo Capital Partners, LLC | 0 | −100,00 | 0 | |||||
| 2025-07-14 | 13F | Farmers & Merchants Investments Inc | 0 | −100,00 | 0 | |||||
| 2025-07-17 | 13F | Janney Montgomery Scott LLC | 16 447 | 28,37 | 0 | |||||
| 2025-07-29 | 13F | Signature Estate & Investment Advisors Llc | 10 204 | 1,29 | 209 | 8,85 | ||||
| 2025-08-08 | 13F | Kingsview Wealth Management, LLC | 24 685 | −0,02 | 506 | 7,66 | ||||
| 2025-08-08 | 13F | Avantax Advisory Services, Inc. | 36 089 | −9,04 | 740 | −2,25 | ||||
| 2025-07-29 | 13F | Salomon & Ludwin, LLC | 1 212 | 0,00 | 25 | 8,70 | ||||
| 2025-03-12 | 13F/A | Private Capital Management Llc | 0 | −100,00 | 0 | −100,00 | ||||
| 2025-07-24 | 13F | Capital Advisors, Ltd. LLC | 25 741 | −1,94 | 1 | |||||
| 2025-07-29 | 13F | Stratos Wealth Partners, LTD. | 43 934 | 8,41 | 901 | 16,58 | ||||
| 2025-07-21 | 13F | TFG Advisers LLC | 78 852 | 0,58 | 1 616 | 8,09 | ||||
| 2025-08-04 | 13F | Atria Investments Llc | 47 648 | −66,62 | 977 | −64,14 | ||||
| 2025-04-01 | 13F | Massmutual Trust Co Fsb/adv | 0 | −100,00 | 0 | |||||
| 2025-07-10 | 13F | Focus Financial Network, Inc. | 227 498 | 0,52 | 4 664 | 8,06 | ||||
| 2025-05-06 | 13F | Venturi Wealth Management, LLC | 0 | −100,00 | 0 | |||||
| 2025-08-14 | 13F | Raymond James Financial Inc | 205 621 | 6,37 | 4 215 | 14,35 | ||||
| 2025-07-23 | 13F | H&H Retirement Design & Management INC | 79 778 | 8,89 | 1 653 | 19,11 | ||||
| 2025-04-23 | 13F | Fourth Dimension Wealth, LLC | 0 | −100,00 | 0 | |||||
| 2025-07-17 | 13F/A | Capital Investment Advisors, LLC | 58 509 | 0,06 | 1 199 | 7,53 | ||||
| 2025-08-05 | 13F | Dunhill Financial, LLC | 321 | 1,26 | 7 | 0,00 | ||||
| 2025-08-14 | 13F | Mml Investors Services, Llc | 49 196 | −66,65 | 1 | −50,00 | ||||
| 2025-04-30 | 13F | Synergy Investment Management, LLC | 0 | −100,00 | 0 | |||||
| 2025-08-14 | 13F | Stifel Financial Corp | 88 783 | 186,05 | 1 820 | 207,95 |