Grundläggande statistik
| Institutionella ägare | 197 total, 196 long only, 0 short only, 1 long/short - change of 0,00% MRQ |
| Genomsnittlig portföljallokering | 0.0868 % - change of −11,47% MRQ |
| Institutionella aktier (lång) | 20 770 318 (ex 13D/G) - change of −0,80MM shares −3,72% MRQ |
| Institutionellt värde (lång) | $ 405 808 USD ($1000) |
Institutionellt ägande och aktieägare
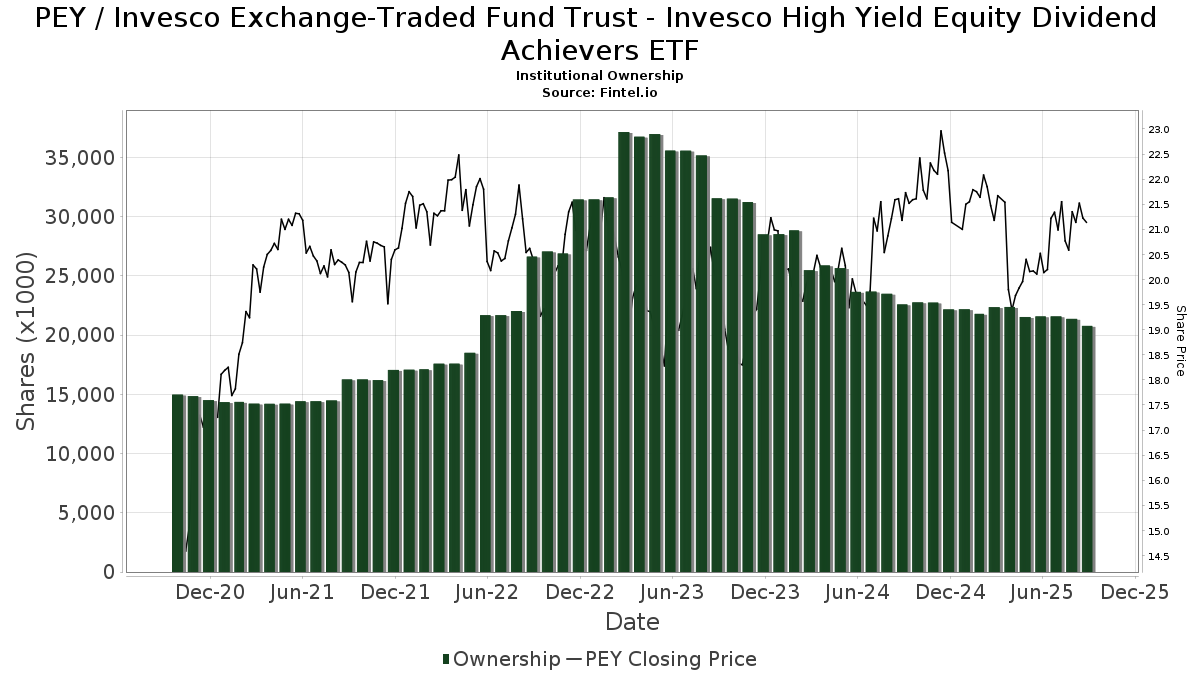
Invesco Exchange-Traded Fund Trust - Invesco High Yield Equity Dividend Achievers ETF (US:PEY) har 197 Institutionella ägare och aktieägare som har lämnat in 13D/G- eller 13F-formulär till Securities Exchange Commission (SEC). Dessa institut innehar totalt 20,770,318 aktier. Största aktieägare inkluderar Bank Of America Corp /de/, Morgan Stanley, LPL Financial LLC, Wells Fargo & Company/mn, Raymond James Financial Inc, Cetera Investment Advisers, Warren Averett Asset Management, LLC, Investors Research Corp, UBS Group AG, and Royal Bank Of Canada .
Invesco Exchange-Traded Fund Trust - Invesco High Yield Equity Dividend Achievers ETF (NasdaqGM:PEY) Institutionell ägarstruktur visar institutioners och fonders nuvarande positioner i företaget, samt de senaste förändringarna i positionernas storlek. Större aktieägare kan vara enskilda investerare, fonder, hedgefonder eller institutioner. Bilaga 13D visar att investeraren äger (eller ägde) mer än 5% av företaget och avser (eller avsåg) att aktivt eftersträva en förändring av affärsstrategin. Schedule 13G indikerar en passiv investering på över 5%.
The share price as of September 9, 2025 is 21,21 / share. Previously, on September 10, 2024, the share price was 21,36 / share. This represents a decline of 0,69% over that period.
Fondsentimentets poäng
Fondsentimentet poängen(fka Ägarackumulation-poäng) visar vilka aktier som är mest köpta av fonder. Det är resultatet av en sofistikerad kvantitativ flerfaktormodell som identifierar företag med de högsta nivåerna av institutionell ackumulering. Poängsättningsmodellen använder en kombination av den totala ökningen av redovisade ägare, förändringarna i portföljallokeringarna för dessa ägare och andra mått. Siffran sträcker sig från 0 till 100, där högre siffror indikerar en högre nivå av ackumulering i förhållande till sina konkurrenter, och 50 är genomsnittet.
Uppdateringsfrekvens: Dagligen
Se Ownership Explorer, som innehåller en lista över de högst rankade företagen.
Institutionell sälj/köp-kvot
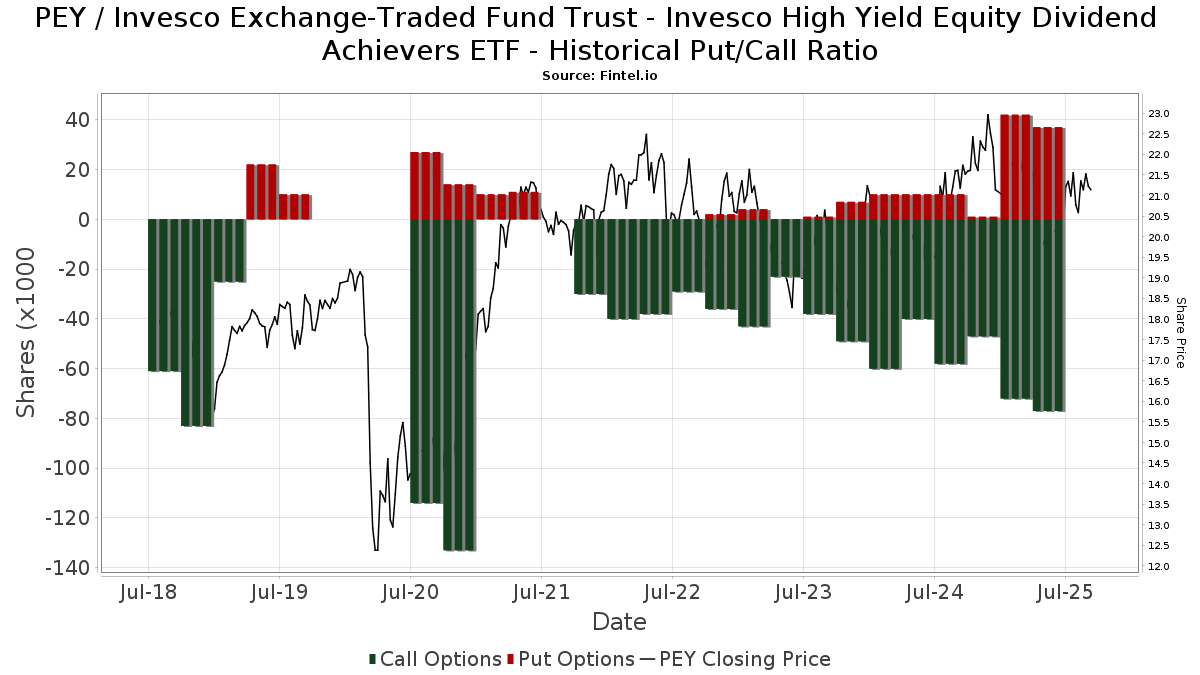
Förutom att rapportera vanliga eget kapital- och skuldemissioner måste institutioner med mer än 100MM tillgångar under förvaltning också avslöja sina innehav av sälj- och köpoptioner. Eftersom säljoptioner i allmänhet indikerar ett negativt sentiment och köpoptioner indikerar ett positivt sentiment, kan vi få en uppfattning om det övergripande institutionella sentimentet genom att plotta förhållandet mellan säljoptioner och köpoptioner. Diagrammet till höger visar det historiska förhållandet mellan sälj- och köpoptioner för detta instrument.
Genom att använda sälj/köp-kvoten som en indikator på aktieägarnas sentiment undviker man en av de största bristerna med att använda det totala institutionella ägandet, nämligen att en betydande del av de förvaltade tillgångarna investeras passivt för att följa index. Passivt förvaltade fonder köper vanligtvis inte optioner, så indikatorn för sälj/köp-kvoten ger en bättre bild av stämningen i aktivt förvaltade fonder.
13F- och NPORT-arkiveringar
Detaljer om 13F-arkiveringar är gratis. Detaljer om NP-arkiveringar kräver ett premiummedlemskap. Gröna rader indikerar nya positioner. Röda rader indikerar stängda positioner. Klicka på länk symbolen för att se hela transaktionshistoriken.
Uppgradera
för att låsa upp premiumdata och exportera till Excel ![]() .
.
| Fil Datum | Källa | Investerare | Typ | Genomsnittligt pris (beräknat) |
Aktier | Δ Aktier (%) |
Rapporterat värde (1000 USD) |
Δ Värde (%) |
Portföljallokering (%) |
|
|---|---|---|---|---|---|---|---|---|---|---|
| 2025-08-14 | 13F | Susquehanna International Group, Llp | Put | 37 900 | 20,70 | 774 | 14,69 | |||
| 2025-07-10 | 13F | Exchange Traded Concepts, Llc | 1 489 | 30 | ||||||
| 2025-08-14 | 13F | Susquehanna International Group, Llp | 50 074 | 1 022 | ||||||
| 2025-08-14 | 13F | Comerica Bank | 77 914 | 0,14 | 1 590 | −4,79 | ||||
| 2025-08-14 | 13F | Susquehanna International Group, Llp | Call | 23 300 | −17,38 | 476 | −21,49 | |||
| 2025-05-01 | 13F | Steel Peak Wealth Management LLC | 0 | −100,00 | 0 | |||||
| 2025-08-11 | 13F | Aptus Capital Advisors, LLC | 3 273 | 0,00 | 67 | −5,71 | ||||
| 2025-08-14 | 13F | Citadel Advisors Llc | Put | 0 | −100,00 | 0 | ||||
| 2025-08-08 | 13F | Cetera Investment Advisers | 425 523 | 5,04 | 8 685 | −0,15 | ||||
| 2025-08-15 | 13F | Kestra Advisory Services, LLC | 15 024 | 14,36 | 307 | 8,51 | ||||
| 2025-07-30 | 13F | First Citizens Bank & Trust Co | 77 440 | 1 581 | ||||||
| 2025-08-06 | 13F | Rialto Wealth Management, LLC | 1 174 | 0,00 | 24 | −8,00 | ||||
| 2025-08-04 | 13F | Bristlecone Advisors, LLC | 5 405 | 0,00 | 110 | −5,17 | ||||
| 2025-08-11 | 13F | Blue Bell Private Wealth Management, Llc | 990 | 0,00 | 20 | −4,76 | ||||
| 2025-07-15 | 13F | North Star Investment Management Corp. | 0 | −100,00 | 0 | |||||
| 2025-08-01 | 13F | Pasadena Private Wealth, LLC | 35 076 | 6,66 | 716 | 1,27 | ||||
| 2025-08-14 | 13F | Herold Advisors, Inc. | 11 216 | 0,12 | 229 | −5,00 | ||||
| 2025-04-18 | 13F | Pacific Capital Wealth Advisors, Inc | 0 | −100,00 | 0 | |||||
| 2025-07-21 | 13F | Precedent Wealth Partners, Llc | 23 963 | −34,17 | 489 | −37,39 | ||||
| 2025-04-21 | 13F | Beacon Capital Management, LLC | 0 | −100,00 | 0 | |||||
| 2025-07-28 | 13F | Founders Grove Wealth Partners, Llc | 222 547 | −2,20 | 4 542 | −7,02 | ||||
| 2025-09-09 | 13F | NWF Advisory Services Inc. | 32 359 | 0,00 | 660 | −4,90 | ||||
| 2025-08-05 | 13F | GHP Investment Advisors, Inc. | 140 562 | −9,51 | 2 869 | −14,00 | ||||
| 2025-08-12 | 13F | O'shaughnessy Asset Management, Llc | 10 060 | 12 168,29 | 205 | 20 400,00 | ||||
| 2025-08-14 | 13F | Wiley Bros.-aintree Capital, Llc | 10 808 | −31,83 | 219 | −34,34 | ||||
| 2025-08-15 | 13F | Equitable Holdings, Inc. | 96 505 | 3,92 | 1 970 | −1,20 | ||||
| 2025-08-05 | 13F | Westside Investment Management, Inc. | 1 000 | 0,00 | 20 | −4,76 | ||||
| 2025-08-12 | 13F | Proequities, Inc. | 0 | 0 | ||||||
| 2025-07-21 | 13F | Ntv Asset Management Llc | 13 340 | 0,00 | 272 | −4,90 | ||||
| 2025-08-18 | 13F | Brick & Kyle, Associates | 105 613 | 0,69 | 2 | 0,00 | ||||
| 2025-08-01 | 13F | Envestnet Asset Management Inc | 121 125 | −2,33 | 2 472 | −7,14 | ||||
| 2025-08-13 | 13F | Capital Analysts, Inc. | 1 249 | −1,03 | 0 | |||||
| 2025-07-10 | 13F | Stolper Co | 29 786 | 3,21 | 1 | |||||
| 2025-08-13 | 13F | Flow Traders U.s. Llc | 34 463 | −42,65 | 1 | −100,00 | ||||
| 2025-08-13 | 13F | Northwestern Mutual Wealth Management Co | 105 887 | −18,86 | 2 161 | −22,85 | ||||
| 2025-07-23 | 13F | Kingswood Wealth Advisors, Llc | 14 540 | −2,72 | 297 | −7,50 | ||||
| 2025-07-24 | 13F | IFP Advisors, Inc | 109 945 | −0,17 | 2 244 | −5,12 | ||||
| 2025-07-21 | 13F | Ameritas Advisory Services, LLC | 12 160 | −52,01 | 248 | −54,16 | ||||
| 2025-07-11 | 13F | Farther Finance Advisors, LLC | 2 477 | −33,81 | 51 | −37,50 | ||||
| 2025-07-09 | 13F | Dynamic Advisor Solutions LLC | 23 822 | 2,30 | 486 | −2,61 | ||||
| 2025-08-11 | 13F | Principal Securities, Inc. | 41 015 | 0,15 | 837 | −3,79 | ||||
| 2025-07-10 | 13F | Capital Advisory Group Advisory Services, LLC | 165 894 | −1,58 | 3 386 | −6,44 | ||||
| 2025-08-08 | 13F | Hartland & Co., LLC | 5 066 | −37,63 | 103 | −40,80 | ||||
| 2025-07-25 | 13F | NorthRock Partners, LLC | 1 000 | 0,00 | 20 | −4,76 | ||||
| 2025-04-25 | 13F | Colonial River Wealth Management, LLC | 0 | −100,00 | 0 | |||||
| 2025-08-13 | 13F | Cerity Partners LLC | 20 190 | 0,00 | 412 | −4,85 | ||||
| 2025-08-05 | 13F | NewSquare Capital LLC | 700 | 0,00 | 14 | −6,67 | ||||
| 2025-05-09 | 13F | GeoWealth Management, LLC | 0 | −100,00 | 0 | |||||
| 2025-08-14 | 13F | Federation des caisses Desjardins du Quebec | 5 180 | 0,00 | 106 | −5,41 | ||||
| 2025-04-09 | 13F | St Germain D J Co Inc | 0 | −100,00 | 0 | −100,00 | ||||
| 2025-08-14 | 13F | Bank Of America Corp /de/ | 5 851 586 | −5,39 | 119 431 | −10,06 | ||||
| 2025-05-06 | 13F | JPL Wealth Management, LLC | 162 810 | 3 362 | ||||||
| 2025-09-04 | 13F/A | Advisor Group Holdings, Inc. | 194 114 | −2,06 | 3 962 | −6,91 | ||||
| 2025-08-06 | 13F | Prospera Financial Services Inc | 39 873 | 6,58 | 814 | 1,25 | ||||
| 2025-07-23 | 13F | 1 North Wealth Services Llc | 125 | 0,00 | 3 | 0,00 | ||||
| 2025-07-29 | 13F | Creekside Partners | 12 394 | −17,36 | 253 | −21,74 | ||||
| 2025-07-15 | 13F | Capital Investment Advisors, LLC | 0 | −100,00 | 0 | |||||
| 2025-07-28 | 13F | Fairman Group, LLC | 641 | 0,00 | 13 | 0,00 | ||||
| 2025-08-14 | 13F | Aft, Forsyth & Company, Inc. | 34 432 | −0,17 | 703 | −5,14 | ||||
| 2025-08-12 | 13F | CIBC Private Wealth Group, LLC | 30 317 | 13,21 | 619 | 23,60 | ||||
| 2025-07-29 | 13F | Private Trust Co Na | 4 099 | −3,55 | 84 | −8,79 | ||||
| 2025-08-07 | 13F | Evoke Wealth, Llc | 171 360 | 0,00 | 3 497 | −4,95 | ||||
| 2025-05-09 | 13F | Pathway Financial Advisers, LLC | 0 | −100,00 | 0 | |||||
| 2025-07-31 | 13F | City State Bank | 20 914 | 0,00 | 427 | −5,12 | ||||
| 2025-08-13 | 13F | Colonial Trust Co / SC | 21 297 | 35,62 | 435 | 29,94 | ||||
| 2025-05-07 | 13F | Foundations Investment Advisors, LLC | 0 | −100,00 | 0 | |||||
| 2025-07-24 | 13F | Aurora Private Wealth, Inc. | 0 | −100,00 | 0 | |||||
| 2025-07-23 | 13F | Sax Wealth Advisors, Llc | 14 500 | 0,00 | 296 | −5,14 | ||||
| 2025-07-29 | 13F | BKM Wealth Management, LLC | 26 799 | −1,34 | 547 | −6,35 | ||||
| 2025-07-08 | 13F | Nbc Securities, Inc. | 3 424 | −18,26 | 0 | |||||
| 2025-07-16 | 13F | Strategic Investment Solutions, Inc. /IL | 300 | 6 | ||||||
| 2025-08-08 | 13F | Compass Financial Services Inc | 12 496 | 0,30 | 255 | −4,49 | ||||
| 2025-08-07 | 13F | PFG Advisors | 34 049 | −4,65 | 695 | −9,40 | ||||
| 2025-08-12 | 13F | Virtu Financial LLC | 54 553 | 1 | ||||||
| 2025-07-18 | 13F | Dogwood Wealth Management LLC | 113 | 1,80 | 2 | 0,00 | ||||
| 2025-08-06 | 13F | SOUTH STATE Corp | 21 986 | 7,45 | 449 | 2,05 | ||||
| 2025-08-12 | 13F | Jpmorgan Chase & Co | 14 031 | −2,35 | 286 | −7,14 | ||||
| 2025-08-14 | 13F | UBS Group AG | 309 523 | −0,08 | 6 317 | −5,01 | ||||
| 2025-08-08 | 13F | Pnc Financial Services Group, Inc. | 12 822 | 0,06 | 262 | −5,09 | ||||
| 2025-07-18 | 13F | SOA Wealth Advisors, LLC. | 1 431 | 1,27 | 29 | −3,33 | ||||
| 2025-08-04 | 13F | Kovack Advisors, Inc. | 10 472 | 214 | ||||||
| 2025-07-15 | 13F | Axis Wealth Partners, LLC | 66 248 | −4,46 | 1 352 | −9,14 | ||||
| 2025-08-12 | 13F | Integrated Advisors Network LLC | 36 744 | −30,50 | 750 | −34,01 | ||||
| 2025-07-22 | 13F | Apexium Financial, Lp | 76 756 | −22,96 | 1 567 | −26,79 | ||||
| 2025-08-14 | 13F | CoreCap Advisors, LLC | 290 | 0,00 | 6 | −16,67 | ||||
| 2025-07-07 | 13F | Bangor Savings Bank | 4 811 | 0,00 | 98 | −4,85 | ||||
| 2025-08-11 | 13F | Cornerstone Planning Group LLC | 9 514 | −6,62 | 197 | −1,50 | ||||
| 2025-07-17 | 13F | Sound Income Strategies, LLC | 671 | 0,30 | 14 | −7,14 | ||||
| 2025-08-04 | 13F | Atria Investments Llc | 34 405 | −67,14 | 702 | −68,76 | ||||
| 2025-08-05 | 13F | Carolinas Wealth Consulting Llc | 0 | −100,00 | 0 | −100,00 | ||||
| 2025-08-14 | 13F | Warren Averett Asset Management, LLC | 362 277 | −4,54 | 7 394 | −9,25 | ||||
| 2025-07-29 | 13F | Novare Capital Management Llc | 10 835 | 0,00 | 221 | −4,74 | ||||
| 2025-08-14 | 13F | Sunbelt Securities, Inc. | 198 | −63,74 | 4 | −63,64 | ||||
| 2025-08-13 | 13F | Jones Financial Companies Lllp | 210 194 | 14,30 | 4 290 | 9,58 | ||||
| 2025-08-12 | 13F | New Republic Capital, LLC | 5 566 | 0,00 | 114 | −5,04 | ||||
| 2025-07-29 | 13F | Signature Estate & Investment Advisors Llc | 46 818 | −5,17 | 956 | −9,82 | ||||
| 2025-04-29 | 13F | Element Wealth, LLC | 0 | −100,00 | 0 | |||||
| 2025-08-14 | 13F | EP Wealth Advisors, Inc. | 6 896 | 32,72 | 141 | 26,13 | ||||
| 2025-08-08 | 13F | Avantax Advisory Services, Inc. | 57 895 | −14,23 | 1 182 | −18,50 | ||||
| 2025-07-25 | 13F | Atria Wealth Solutions, Inc. | 0 | −100,00 | 0 | |||||
| 2025-08-14 | 13F | IHT Wealth Management, LLC | 48 033 | −35,47 | 980 | −38,67 | ||||
| 2025-08-01 | 13F | Capital Investment Counsel, LLC | 13 490 | −9,17 | 275 | −13,52 | ||||
| 2025-08-18 | 13F | Geneos Wealth Management Inc. | 2 502 | 0,00 | 51 | −3,77 | ||||
| 2025-07-10 | 13F | Focus Financial Network, Inc. | 11 448 | 234 | ||||||
| 2025-07-14 | 13F | Hoey Investments, Inc | 500 | −30,65 | 10 | −33,33 | ||||
| 2025-07-15 | 13F | Mather Group, Llc. | 11 496 | 0,00 | 235 | −4,88 | ||||
| 2025-07-25 | 13F | Johnson Investment Counsel Inc | 52 175 | 0,00 | 1 065 | −5,00 | ||||
| 2025-08-11 | 13F | HighTower Advisors, LLC | 0 | −100,00 | 0 | |||||
| 2025-08-13 | 13F | Quadrature Capital Ltd | 0 | −100,00 | 0 | |||||
| 2025-08-11 | 13F | Mindset Wealth Management, Llc | 14 545 | 0,00 | 297 | −5,13 | ||||
| 2025-08-07 | 13F | Addison Advisors LLC | 610 | −18,67 | 12 | −25,00 | ||||
| 2025-08-08 | 13F | Capital Investment Advisory Services, LLC | 15 729 | 0,03 | 321 | −4,75 | ||||
| 2025-07-10 | 13F | Wealth Enhancement Advisory Services, Llc | 35 888 | −4,56 | 764 | −5,45 | ||||
| 2025-07-07 | 13F | Investors Research Corp | 326 848 | 6,91 | 6 671 | 1,63 | ||||
| 2025-08-14 | 13F | Snowden Capital Advisors LLC | 12 014 | 0,00 | 245 | −4,67 | ||||
| 2025-07-24 | 13F | Advanced Asset Management Advisors Inc | 1 880 | 0,00 | 38 | −5,00 | ||||
| 2025-08-14 | 13F | Bnp Paribas Arbitrage, Sa | 4 | −88,89 | 0 | |||||
| 2025-08-06 | 13F | AE Wealth Management LLC | 11 939 | 59,95 | 244 | 51,88 | ||||
| 2025-08-04 | 13F | Assetmark, Inc | 175 | 4 | ||||||
| 2025-07-31 | 13F | Opus Capital Group, LLC | 9 920 | 0,00 | 0 | |||||
| 2025-07-10 | 13F | Wedmont Private Capital | 15 303 | 0,00 | 327 | 10,51 | ||||
| 2025-07-18 | 13F | Truist Financial Corp | 17 123 | 0,25 | 349 | −4,64 | ||||
| 2025-04-22 | 13F | Atticus Wealth Management, Llc | 0 | 0 | ||||||
| 2025-08-08 | 13F | Family Firm, Inc. | 10 536 | 0,00 | 215 | −4,87 | ||||
| 2025-08-14 | 13F | RMB Capital Management, LLC | 24 451 | 0,00 | 499 | −4,77 | ||||
| 2025-07-15 | 13F | Armis Advisers, LLC | 55 470 | 36,86 | 1 182 | 47,07 | ||||
| 2025-08-14 | 13F | Oxford Financial Group Ltd | 34 514 | −9,45 | 704 | −13,94 | ||||
| 2025-07-31 | 13F | GLOBALT Investments LLC / GA | 32 839 | −9,74 | 670 | −14,21 | ||||
| 2025-08-13 | 13F | Cresset Asset Management, LLC | 46 750 | 0,00 | 954 | −4,89 | ||||
| 2025-07-15 | 13F | Fortitude Family Office, LLC | 1 400 | 0,00 | 29 | −6,67 | ||||
| 2025-08-12 | 13F | Steward Partners Investment Advisory, Llc | 23 657 | 0,42 | 483 | −4,55 | ||||
| 2025-08-12 | 13F | Clearwater Capital Advisors, LLC | 11 597 | −3,08 | 237 | −7,81 | ||||
| 2025-08-14 | 13F | Qube Research & Technologies Ltd | 234 | 0,00 | 5 | −20,00 | ||||
| 2025-08-08 | 13F | SageOak Financial, LLC | 0 | −100,00 | 0 | |||||
| 2025-07-11 | 13F | First PREMIER Bank | 38 540 | −3,38 | 1 | |||||
| 2025-07-22 | 13F | Financial Insights, Inc. | 14 100 | 0,00 | 288 | −4,97 | ||||
| 2025-08-11 | 13F | Private Advisor Group, LLC | 79 833 | −2,80 | 1 629 | −7,60 | ||||
| 2025-08-13 | 13F | Millstone Evans Group, LLC | 1 519 | 0,00 | 31 | −3,12 | ||||
| 2025-08-18 | 13F | Tyler-Stone Wealth Management | 0 | −100,00 | 0 | |||||
| 2025-04-25 | 13F | New Wave Wealth Advisors Llc | 0 | −100,00 | 0 | |||||
| 2025-07-17 | 13F | Wagner Wealth Management, Llc | 1 893 | 1,23 | 39 | −5,00 | ||||
| 2025-07-31 | 13F | Cambridge Investment Research Advisors, Inc. | 112 294 | −0,82 | 2 | 0,00 | ||||
| 2025-07-29 | 13F | International Assets Investment Management, Llc | 24 923 | 12,18 | 509 | 6,72 | ||||
| 2025-07-21 | 13F | Crews Bank & Trust | 4 690 | −34,77 | 96 | −38,31 | ||||
| 2025-08-12 | 13F | AlphaCore Capital LLC | 151 335 | −18,80 | 3 089 | −22,82 | ||||
| 2025-08-13 | 13F | First Trust Advisors Lp | 12 732 | 260 | ||||||
| 2025-07-23 | 13F | Nbt Bank N A /ny | 1 142 | 0,00 | 23 | −4,17 | ||||
| 2025-07-14 | 13F | Sowell Financial Services LLC | 13 028 | 0,15 | 266 | −5,02 | ||||
| 2025-05-16 | 13F | Coppell Advisory Solutions LLC | 0 | −100,00 | 0 | |||||
| 2025-07-16 | 13F | Cresta Advisors, Ltd. | 114 411 | 10,87 | 2 335 | 5,42 | ||||
| 2025-08-14 | 13F | MGB Wealth Management, LLC | 52 499 | 0,00 | 1 072 | −4,88 | ||||
| 2025-08-07 | 13F | Resources Investment Advisors, LLC. | 105 749 | −2,32 | 2 158 | −7,14 | ||||
| 2025-07-08 | 13F | Parallel Advisors, LLC | 382 | 1,33 | 8 | −12,50 | ||||
| 2025-08-06 | 13F | Commonwealth Equity Services, Llc | 182 843 | −4,16 | 4 | −25,00 | ||||
| 2025-08-15 | 13F | Tower Research Capital LLC (TRC) | 28 505 | −12,32 | 582 | −16,64 | ||||
| 2025-04-30 | 13F | Axxcess Wealth Management, Llc | 0 | −100,00 | 0 | |||||
| 2025-07-10 | 13F | Kozak & Associates, Inc. | 9 085 | 1,23 | 194 | 9,66 | ||||
| 2025-08-11 | 13F | Lowe Brockenbrough & Co Inc | 512 | 10 | ||||||
| 2025-08-08 | 13F | Creative Planning | 28 150 | 0,87 | 575 | −4,17 | ||||
| 2025-08-14 | 13F | GWM Advisors LLC | 44 634 | 0,40 | 911 | −4,61 | ||||
| 2025-08-14 | 13F | Wells Fargo & Company/mn | 1 288 902 | 0,16 | 26 306 | −4,78 | ||||
| 2025-07-18 | 13F | Institute for Wealth Management, LLC. | 25 156 | 0,00 | 513 | −5,00 | ||||
| 2025-07-07 | 13F | Good Steward Wealth Advisors,LLC | 104 939 | 200,13 | 2 142 | 185,47 | ||||
| 2025-07-21 | 13F | Barrett & Company, Inc. | 39 744 | 0,29 | 811 | −4,59 | ||||
| 2025-08-08 | 13F | Wealth Alliance | 86 953 | 5,01 | 1 775 | −0,17 | ||||
| 2025-07-31 | 13F | CVA Family Office, LLC | 798 | 0,00 | 16 | −5,88 | ||||
| 2025-08-14 | 13F | Citadel Advisors Llc | 11 940 | 244 | ||||||
| 2025-07-29 | 13F | Chicago Partners Investment Group LLC | 12 570 | 0,79 | 271 | 8,87 | ||||
| 2025-07-31 | 13F | Richards, Merrill & Peterson, Inc. | 1 463 | 0,00 | 30 | −6,45 | ||||
| 2025-08-05 | 13F | Key FInancial Inc | 249 | −50,79 | 5 | −50,00 | ||||
| 2025-08-14 | 13F | Ameriprise Financial Inc | 223 032 | −3,27 | 4 561 | −7,88 | ||||
| 2025-08-05 | 13F | Bank Of Montreal /can/ | 1 682 | 0,00 | 34 | −5,56 | ||||
| 2025-08-14 | 13F | Citadel Advisors Llc | Call | 54 400 | 23,92 | 1 110 | 17,83 | |||
| 2025-04-15 | 13F | Noble Wealth Management PBC | 316 | 0,00 | 7 | 0,00 | ||||
| 2025-08-12 | 13F | Global Retirement Partners, LLC | 11 808 | 36,90 | 241 | 31,15 | ||||
| 2025-08-14 | 13F | Benjamin Edwards Inc | 45 597 | −5,14 | 931 | −9,88 | ||||
| 2025-07-29 | 13F | Salomon & Ludwin, LLC | 219 659 | −3,04 | 4 661 | −4,17 | ||||
| 2025-08-12 | 13F | SRS Capital Advisors, Inc. | 8 943 | 183 | ||||||
| 2025-08-05 | 13F | GPS Wealth Strategies Group, LLC | 2 375 | 0,00 | 48 | −4,00 | ||||
| 2025-07-15 | 13F | Fifth Third Bancorp | 1 634 | 0,00 | 33 | −5,71 | ||||
| 2025-08-14 | 13F/A | Rockefeller Capital Management L.P. | 10 393 | −5,86 | 212 | −10,55 | ||||
| 2025-07-25 | 13F | Cwm, Llc | 19 090 | 0,02 | 0 | |||||
| 2025-07-31 | 13F | Brinker Capital Investments, LLC | 0 | −100,00 | 0 | −100,00 | ||||
| 2025-08-11 | 13F | United Capital Financial Advisers, Llc | 155 744 | −11,46 | 3 179 | −15,84 | ||||
| 2025-05-08 | 13F | IFG Advisory, LLC | 0 | −100,00 | 0 | |||||
| 2025-07-30 | 13F | LGT Financial Advisors LLC | 1 000 | 0,00 | 20 | −4,76 | ||||
| 2025-08-07 | 13F | Allworth Financial LP | 813 | 15,65 | 17 | 14,29 | ||||
| 2025-07-17 | 13F | Vermillion Wealth Management, Inc. | 369 | 0,00 | 8 | 0,00 | ||||
| 2025-07-28 | 13F | RFG Advisory, LLC | 0 | −100,00 | 0 | |||||
| 2025-08-14 | 13F | Mariner, LLC | 41 524 | 210,41 | 848 | 195,12 | ||||
| 2025-08-14 | 13F | Royal Bank Of Canada | 233 522 | 18,72 | 4 766 | 12,86 | ||||
| 2025-08-08 | 13F | Larson Financial Group LLC | 1 000 | 0,00 | 20 | −4,76 | ||||
| 2025-08-05 | 13F | Lifeworks Advisors, LLC | 12 180 | −39,24 | 249 | −42,33 | ||||
| 2025-08-14 | 13F | Synovus Financial Corp | 11 628 | 4,83 | 237 | −0,42 | ||||
| 2025-08-13 | 13F | Alerus Financial Na | 337 | 7 | ||||||
| 2025-07-18 | 13F | Consolidated Portfolio Review Corp | 17 819 | 0,10 | 364 | −4,97 | ||||
| 2025-08-04 | 13F | Spire Wealth Management | 215 | −89,36 | 4 | −90,70 | ||||
| 2025-08-14 | 13F | Fmr Llc | 19 954 | −6,57 | 407 | −11,14 | ||||
| 2025-08-15 | 13F | Captrust Financial Advisors | 84 466 | 8,21 | 1 724 | 2,87 | ||||
| 2025-04-30 | 13F | Synergy Investment Management, LLC | 0 | −100,00 | 0 | |||||
| 2025-08-13 | 13F | Beacon Pointe Advisors, LLC | 59 479 | −0,98 | 1 214 | −5,90 | ||||
| 2025-07-25 | 13F | Sovereign Financial Group, Inc. | 20 586 | 14,68 | 420 | 9,09 | ||||
| 2025-07-28 | 13F | Harbour Investments, Inc. | 26 243 | −22,66 | 536 | −26,51 | ||||
| 2025-08-12 | 13F | LPL Financial LLC | 1 929 218 | −0,65 | 39 375 | −5,55 | ||||
| 2025-07-30 | 13F | Cullen/frost Bankers, Inc. | 5 418 | 1,23 | 111 | −3,51 | ||||
| 2025-08-12 | 13F | MAI Capital Management | 1 681 | 0,00 | 34 | −5,56 | ||||
| 2025-08-14 | 13F | Hurley Capital, LLC | 2 000 | 41 | ||||||
| 2025-08-14 | 13F | Mercer Global Advisors Inc /adv | 11 707 | −2,07 | 239 | −7,03 | ||||
| 2025-07-25 | 13F | LRI Investments, LLC | 1 | 0,00 | 0 | |||||
| 2025-08-08 | 13F | Meridian Wealth Management, LLC | 19 718 | −8,72 | 402 | −13,17 | ||||
| 2025-07-24 | 13F | Us Bancorp \de\ | 120 | −79,45 | 2 | −83,33 | ||||
| 2025-08-07 | 13F | Kestra Private Wealth Services, Llc | 16 526 | −28,19 | 337 | −31,78 | ||||
| 2025-07-17 | 13F | Janney Montgomery Scott LLC | 57 835 | −3,26 | 1 | 0,00 | ||||
| 2025-07-16 | 13F | New Insight Wealth Advisors | 140 618 | −17,38 | 2 870 | −21,43 | ||||
| 2025-07-24 | 13F | Capital Advisors, Ltd. LLC | 182 322 | −3,23 | 4 | −25,00 | ||||
| 2025-08-14 | 13F | Two Sigma Investments, Lp | 76 600 | −55,31 | 1 563 | −57,52 | ||||
| 2025-08-15 | 13F | Morgan Stanley | 2 539 270 | −0,27 | 51 827 | −5,20 | ||||
| 2025-08-19 | 13F | National Asset Management, Inc. | 11 585 | −44,56 | 236 | −46,85 | ||||
| 2025-08-05 | 13F | Simplex Trading, Llc | 1 875 | 0 | ||||||
| 2025-07-29 | 13F | Stratos Wealth Partners, LTD. | 11 812 | −47,40 | 241 | −50,00 | ||||
| 2025-07-15 | 13F | Revisor Wealth Management LLC | 15 960 | 0,00 | 343 | 0,29 | ||||
| 2025-07-14 | 13F | AdvisorNet Financial, Inc | 198 020 | 82,90 | 4 042 | 73,88 | ||||
| 2025-07-09 | 13F | David J Yvars Group | 11 800 | 0,00 | 241 | −4,38 | ||||
| 2025-08-14 | 13F | Raymond James Financial Inc | 651 911 | 1,48 | 13 306 | −3,52 | ||||
| 2025-07-18 | 13F | QTR Family Wealth, LLC | 15 166 | 0,00 | 310 | −4,92 | ||||
| 2025-08-14 | 13F | Mml Investors Services, Llc | 67 607 | 1,17 | 1 | 0,00 | ||||
| 2025-08-01 | 13F | Brookwood Investment Group LLC | 11 523 | −1,05 | 235 | −6,00 | ||||
| 2025-08-14 | 13F | Stifel Financial Corp | 73 601 | 22,46 | 1 502 | 16,43 |