Grundläggande statistik
| Institutionella ägare | 201 total, 200 long only, 0 short only, 1 long/short - change of −1,95% MRQ |
| Genomsnittlig portföljallokering | 0.1099 % - change of −7,60% MRQ |
| Institutionella aktier (lång) | 6 581 938 (ex 13D/G) - change of −0,44MM shares −6,31% MRQ |
| Institutionellt värde (lång) | $ 642 080 USD ($1000) |
Institutionellt ägande och aktieägare
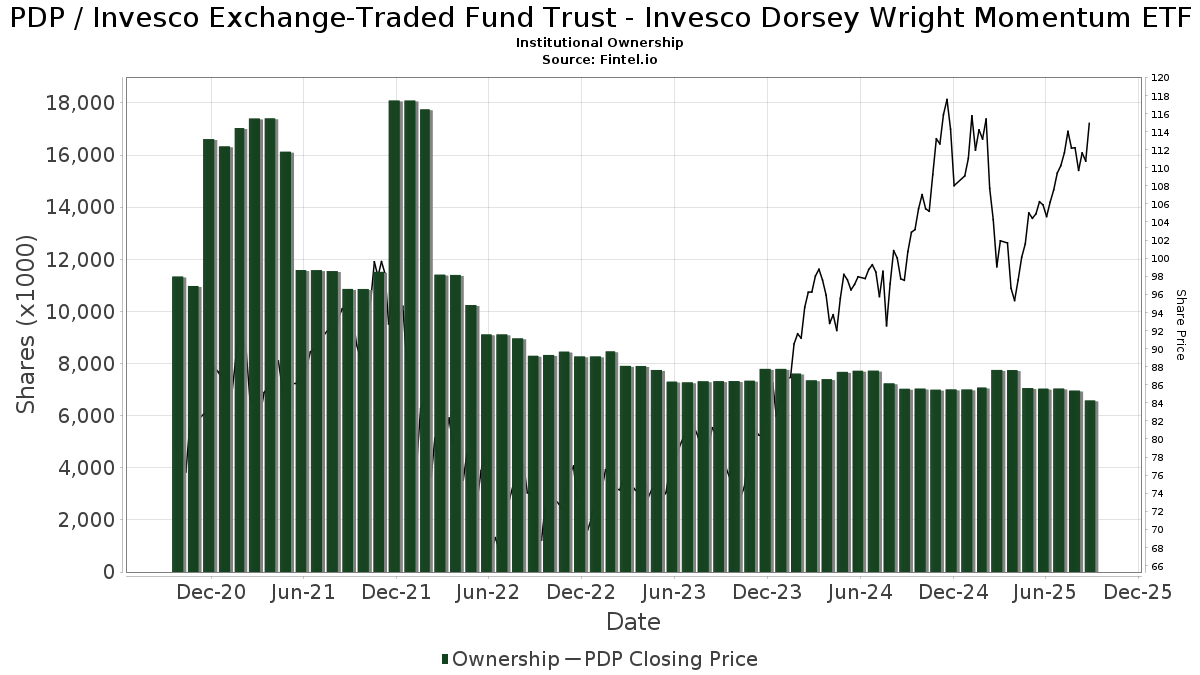
Invesco Exchange-Traded Fund Trust - Invesco Dorsey Wright Momentum ETF (US:PDP) har 201 Institutionella ägare och aktieägare som har lämnat in 13D/G- eller 13F-formulär till Securities Exchange Commission (SEC). Dessa institut innehar totalt 6,581,938 aktier. Största aktieägare inkluderar Morgan Stanley, Raymond James Financial Inc, Wells Fargo & Company/mn, Bank Of America Corp /de/, Commonwealth Equity Services, Llc, LPL Financial LLC, NewSquare Capital LLC, Royal Bank Of Canada, Summit Financial, LLC, and UBS Group AG .
Invesco Exchange-Traded Fund Trust - Invesco Dorsey Wright Momentum ETF (NasdaqGM:PDP) Institutionell ägarstruktur visar institutioners och fonders nuvarande positioner i företaget, samt de senaste förändringarna i positionernas storlek. Större aktieägare kan vara enskilda investerare, fonder, hedgefonder eller institutioner. Bilaga 13D visar att investeraren äger (eller ägde) mer än 5% av företaget och avser (eller avsåg) att aktivt eftersträva en förändring av affärsstrategin. Schedule 13G indikerar en passiv investering på över 5%.
The share price as of September 8, 2025 is 113,78 / share. Previously, on September 9, 2024, the share price was 95,90 / share. This represents an increase of 18,64% over that period.
Fondsentimentets poäng
Fondsentimentet poängen(fka Ägarackumulation-poäng) visar vilka aktier som är mest köpta av fonder. Det är resultatet av en sofistikerad kvantitativ flerfaktormodell som identifierar företag med de högsta nivåerna av institutionell ackumulering. Poängsättningsmodellen använder en kombination av den totala ökningen av redovisade ägare, förändringarna i portföljallokeringarna för dessa ägare och andra mått. Siffran sträcker sig från 0 till 100, där högre siffror indikerar en högre nivå av ackumulering i förhållande till sina konkurrenter, och 50 är genomsnittet.
Uppdateringsfrekvens: Dagligen
Se Ownership Explorer, som innehåller en lista över de högst rankade företagen.
Institutionell sälj/köp-kvot
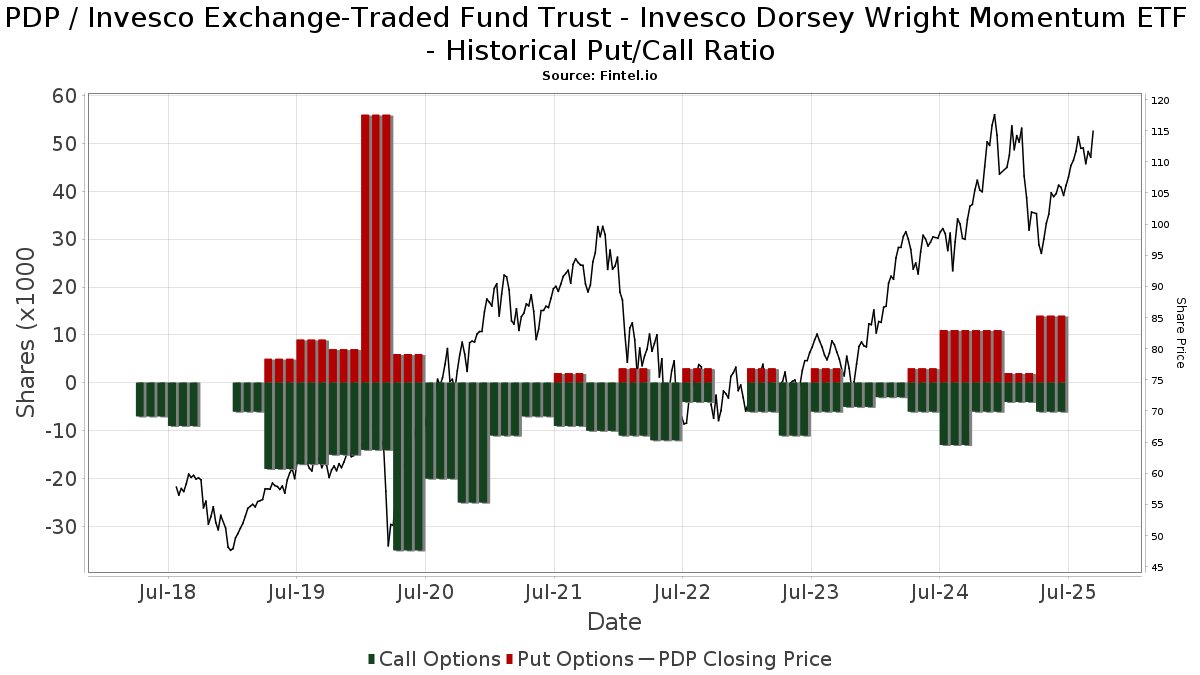
Förutom att rapportera vanliga eget kapital- och skuldemissioner måste institutioner med mer än 100MM tillgångar under förvaltning också avslöja sina innehav av sälj- och köpoptioner. Eftersom säljoptioner i allmänhet indikerar ett negativt sentiment och köpoptioner indikerar ett positivt sentiment, kan vi få en uppfattning om det övergripande institutionella sentimentet genom att plotta förhållandet mellan säljoptioner och köpoptioner. Diagrammet till höger visar det historiska förhållandet mellan sälj- och köpoptioner för detta instrument.
Genom att använda sälj/köp-kvoten som en indikator på aktieägarnas sentiment undviker man en av de största bristerna med att använda det totala institutionella ägandet, nämligen att en betydande del av de förvaltade tillgångarna investeras passivt för att följa index. Passivt förvaltade fonder köper vanligtvis inte optioner, så indikatorn för sälj/köp-kvoten ger en bättre bild av stämningen i aktivt förvaltade fonder.
13F- och NPORT-arkiveringar
Detaljer om 13F-arkiveringar är gratis. Detaljer om NP-arkiveringar kräver ett premiummedlemskap. Gröna rader indikerar nya positioner. Röda rader indikerar stängda positioner. Klicka på länk symbolen för att se hela transaktionshistoriken.
Uppgradera
för att låsa upp premiumdata och exportera till Excel ![]() .
.
| Fil Datum | Källa | Investerare | Typ | Genomsnittligt pris (beräknat) |
Aktier | Δ Aktier (%) |
Rapporterat värde (1000 USD) |
Δ Värde (%) |
Portföljallokering (%) |
|
|---|---|---|---|---|---|---|---|---|---|---|
| 2025-08-14 | 13F | Bank Of America Corp /de/ | 447 994 | 0,16 | 48 648 | 8,78 | ||||
| 2025-08-14 | 13F | Comerica Bank | 10 408 | 138,28 | 1 130 | 159,17 | ||||
| 2025-08-15 | 13F | Kestra Advisory Services, LLC | 11 610 | −3,39 | 1 261 | 4,91 | ||||
| 2025-04-15 | 13F | Transform Wealth, LLC | 0 | −100,00 | 0 | |||||
| 2025-04-29 | 13F | Element Wealth, LLC | 0 | −100,00 | 0 | |||||
| 2025-08-14 | 13F | Susquehanna International Group, Llp | 16 062 | 66,69 | 1 744 | 81,10 | ||||
| 2025-08-14 | 13F | IHT Wealth Management, LLC | 2 016 | −40,98 | 219 | −36,07 | ||||
| 2025-09-09 | 13F | NWF Advisory Services Inc. | 4 200 | 4,48 | 456 | 13,72 | ||||
| 2025-08-14 | 13F | Susquehanna International Group, Llp | Call | 6 300 | 36,96 | 684 | 49,02 | |||
| 2025-08-14 | 13F | Susquehanna International Group, Llp | Put | 14 300 | 450,00 | 1 553 | 499,23 | |||
| 2025-07-17 | 13F | Janney Montgomery Scott LLC | 180 567 | −0,05 | 20 | 5,56 | ||||
| 2025-08-08 | 13F | Emerald Investment Partners, Llc | 700 | 0,00 | 76 | 10,14 | ||||
| 2025-08-01 | 13F | MorganRosel Wealth Management, LLC | 21 943 | −0,32 | 2 383 | 8,27 | ||||
| 2025-08-08 | 13F | Cetera Investment Advisers | 26 304 | 0,77 | 2 856 | 9,47 | ||||
| 2025-08-12 | 13F | O'shaughnessy Asset Management, Llc | 2 357 | 292,83 | 256 | 332,20 | ||||
| 2025-08-11 | 13F | HighTower Advisors, LLC | 2 298 | −35,32 | 250 | −29,86 | ||||
| 2025-07-17 | 13F | PMG Wealth Management, Inc. | 9 615 | 20,07 | 1 044 | 30,50 | ||||
| 2025-08-18 | 13F/A | National Bank Of Canada /fi/ | 2 585 | −6,00 | 281 | 2,19 | ||||
| 2025-04-23 | 13F | Alpine Bank Wealth Management | 0 | −100,00 | 0 | |||||
| 2025-07-08 | 13F | Zrc Wealth Management, Llc | 6 | 0,00 | 1 | |||||
| 2025-08-08 | 13F | MTM Investment Management, LLC | 30 942 | −4,52 | 3 360 | 3,16 | ||||
| 2025-08-15 | 13F | CI Private Wealth, LLC | 3 133 | 20,78 | 340 | 31,27 | ||||
| 2025-07-11 | 13F | Farther Finance Advisors, LLC | 66 358 | −6,73 | 7 206 | 0,78 | ||||
| 2025-07-21 | 13F | Ameritas Advisory Services, LLC | 1 053 | 114 | ||||||
| 2025-04-29 | 13F | Resources Investment Advisors, LLC. | 0 | −100,00 | 0 | −100,00 | ||||
| 2025-08-15 | 13F | Morgan Stanley | 699 375 | 2,85 | 75 945 | 11,71 | ||||
| 2025-07-18 | 13F | Consolidated Planning Corp | 4 815 | 0,00 | 523 | 8,52 | ||||
| 2025-08-14 | 13F | Wiley Bros.-aintree Capital, Llc | 3 525 | −4,42 | 383 | 4,09 | ||||
| 2025-08-08 | 13F | Mv Capital Management, Inc. | 0 | −100,00 | 0 | |||||
| 2025-08-05 | 13F | NewSquare Capital LLC | 311 658 | −4,99 | 33 843 | 3,19 | ||||
| 2025-08-04 | 13F | Creative Financial Designs Inc /adv | 356 | 0,00 | 39 | 8,57 | ||||
| 2025-07-14 | 13F | Abound Wealth Management | 80 | 0,00 | 9 | 14,29 | ||||
| 2025-08-11 | 13F | Principal Securities, Inc. | 109 | 0,00 | 12 | 0,00 | ||||
| 2025-07-24 | 13F | IFP Advisors, Inc | 5 265 | 10,94 | 572 | 20,46 | ||||
| 2025-07-22 | 13F | Merit Financial Group, LLC | 9 254 | −5,37 | 1 005 | 2,76 | ||||
| 2025-08-13 | 13F | Capital Analysts, Inc. | 12 | 0 | ||||||
| 2025-08-13 | 13F | Northwestern Mutual Wealth Management Co | 3 017 | 2,55 | 328 | 11,22 | ||||
| 2025-07-24 | 13F | Blair William & Co/il | 24 920 | −5,14 | 2 706 | 3,05 | ||||
| 2025-07-30 | 13F | Principle Wealth Partners Llc | 4 395 | 0,00 | 477 | 8,66 | ||||
| 2025-07-15 | 13F | First City Capital Management, Inc. | 2 585 | 0,00 | 281 | 8,53 | ||||
| 2025-08-01 | 13F | Envestnet Asset Management Inc | 92 223 | 7,22 | 10 015 | 16,46 | ||||
| 2025-08-07 | 13F | Nwam Llc | 2 336 | −13,00 | 266 | −0,75 | ||||
| 2025-08-19 | 13F | Advisory Services Network, LLC | 0 | −100,00 | 0 | |||||
| 2025-08-12 | 13F | Bokf, Na | 0 | −100,00 | 0 | |||||
| 2025-09-04 | 13F/A | Advisor Group Holdings, Inc. | 64 945 | −3,02 | 7 037 | 5,09 | ||||
| 2025-08-04 | 13F | Spire Wealth Management | 2 418 | −34,52 | 263 | −29,00 | ||||
| 2025-05-09 | 13F | GeoWealth Management, LLC | 0 | −100,00 | 0 | |||||
| 2025-07-01 | 13F | Harbor Investment Advisory, Llc | 1 790 | 0,00 | 194 | 8,99 | ||||
| 2025-07-17 | 13F | HB Wealth Management, LLC | 8 320 | −10,20 | 903 | −2,48 | ||||
| 2025-08-11 | 13F | Morling Financial Advisors, LLC | 2 933 | 0,00 | 318 | 8,53 | ||||
| 2025-08-26 | 13F | Claris Financial LLC | 3 126 | −9,34 | 339 | −8,63 | ||||
| 2025-07-18 | 13F | PFG Investments, LLC | 22 056 | −2,03 | 2 395 | 6,44 | ||||
| 2025-08-08 | 13F | Creative Planning | 5 695 | −4,54 | 618 | 3,69 | ||||
| 2025-08-12 | 13F | Global Retirement Partners, LLC | 18 360 | 2,28 | 1 994 | 3,21 | ||||
| 2025-08-12 | 13F | Founders Financial Alliance, LLC | 802 | 0,00 | 87 | 8,75 | ||||
| 2025-08-14 | 13F | Royal Bank Of Canada | 308 669 | −11,68 | 33 518 | −4,08 | ||||
| 2025-08-11 | 13F | FSC Wealth Advisors, LLC | 203 | 0,00 | 22 | 10,00 | ||||
| 2025-08-05 | 13F | Bridgewater Advisors Inc. | 11 607 | 0,00 | 1 314 | 13,18 | ||||
| 2025-08-06 | 13F | Prospera Financial Services Inc | 178 693 | 1,11 | 19 404 | 9,81 | ||||
| 2025-07-08 | 13F | Nbc Securities, Inc. | 9 930 | 0,00 | 1 | |||||
| 2025-08-13 | 13F | Flow Traders U.s. Llc | 20 615 | 83,70 | 2 | 100,00 | ||||
| 2025-07-15 | 13F | World Equity Group, Inc. | 0 | −100,00 | 0 | |||||
| 2025-07-23 | 13F | BankPlus Trust Department | 1 832 | 0,00 | 199 | 8,20 | ||||
| 2025-07-09 | 13F | Post Resch Tallon Group Inc. | 2 250 | −17,58 | 244 | −10,29 | ||||
| 2025-08-14 | 13F | Smartleaf Asset Management LLC | 101 | 0,00 | 11 | 0,00 | ||||
| 2025-08-14 | 13F | Mercer Global Advisors Inc /adv | 20 316 | −0,05 | 2 206 | 8,56 | ||||
| 2025-08-05 | 13F | Lord & Richards Wealth Management, LLC | 0 | −100,00 | 0 | |||||
| 2025-07-16 | 13F | True North Advisors, LLC | 2 874 | 0,00 | 312 | 8,71 | ||||
| 2025-08-14 | 13F | Harvest Investment Services, LLC | 9 397 | −1,66 | 1 020 | 6,81 | ||||
| 2025-07-11 | 13F | Eagle Bay Advisors LLC | 3 519 | −38,92 | 382 | −33,57 | ||||
| 2025-08-12 | 13F | Park Square Financial Group, LLC | 187 | 0,00 | 20 | 11,11 | ||||
| 2025-07-29 | 13F | Private Trust Co Na | 4 522 | 0,00 | 491 | 8,63 | ||||
| 2025-08-12 | 13F | Jpmorgan Chase & Co | 90 032 | 0,97 | 9 777 | 9,66 | ||||
| 2025-08-01 | 13F | Shilanski & Associates, Inc. | 2 221 | 0,00 | 241 | 8,56 | ||||
| 2025-08-12 | 13F | Heritage Trust Co | 2 095 | 0,00 | 227 | 8,61 | ||||
| 2025-08-08 | 13F | Pnc Financial Services Group, Inc. | 3 261 | 0,00 | 354 | 8,59 | ||||
| 2025-08-14 | 13F | UBS Group AG | 188 948 | −24,78 | 20 518 | −18,30 | ||||
| 2025-04-15 | 13F | Ibex Wealth Advisors | 0 | −100,00 | 0 | |||||
| 2025-08-13 | 13F | Baker Avenue Asset Management, LP | 4 916 | 13,93 | 534 | 23,67 | ||||
| 2025-04-28 | 13F | Astoria Portfolio Advisors LLC. | 0 | −100,00 | 0 | |||||
| 2025-08-12 | 13F | Proequities, Inc. | 0 | 0 | ||||||
| 2025-07-22 | 13F | Global Assets Advisory, LLC | 0 | −100,00 | 0 | |||||
| 2025-07-31 | 13F | WFA Asset Management Corp | 100 | 0,00 | 10 | 0,00 | ||||
| 2025-07-29 | 13F | Stephens Inc /ar/ | 9 855 | 20,74 | 1 070 | 31,13 | ||||
| 2025-08-18 | 13F | Geneos Wealth Management Inc. | 6 152 | −2,84 | 668 | 5,53 | ||||
| 2025-07-25 | 13F | Second Half Financial Partners, LLC | 7 435 | 1,18 | 807 | 9,95 | ||||
| 2025-07-28 | 13F | BRYN MAWR TRUST Co | 800 | 0,00 | 87 | 8,86 | ||||
| 2025-08-11 | 13F | Citigroup Inc | 2 194 | 0,00 | 238 | 8,68 | ||||
| 2025-08-06 | 13F | Wsfs Capital Management, Llc | 4 051 | 440 | ||||||
| 2025-04-21 | 13F | SILVER OAK SECURITIES, Inc | 0 | −100,00 | 0 | |||||
| 2025-08-12 | 13F | Osborne Partners Capital Management, Llc | 36 048 | −0,92 | 3 914 | 7,62 | ||||
| 2025-08-14 | 13F | GWM Advisors LLC | 84 604 | −13,77 | 9 187 | −6,34 | ||||
| 2025-08-08 | 13F | Tortoise Investment Management, LLC | 1 000 | 0,00 | 109 | 9,09 | ||||
| 2025-08-05 | 13F | Plante Moran Financial Advisors, LLC | 96 | 0,00 | 10 | 11,11 | ||||
| 2025-08-08 | 13F | Larson Financial Group LLC | 57 | 0,00 | 6 | 20,00 | ||||
| 2025-08-14 | 13F | Warren Averett Asset Management, LLC | 18 956 | 0,01 | 2 058 | 8,66 | ||||
| 2025-07-15 | 13F | Kelly Financial Group Llc | 11 095 | −34,05 | 1 205 | −28,42 | ||||
| 2025-05-15 | 13F | Old Mission Capital Llc | 0 | −100,00 | 0 | −100,00 | ||||
| 2025-07-02 | 13F | Central Pacific Bank - Trust Division | 9 | 0,00 | 1 | |||||
| 2025-08-14 | 13F | Citadel Advisors Llc | 0 | −100,00 | 0 | |||||
| 2025-08-12 | 13F | Calton & Associates, Inc. | 16 256 | 6,15 | 1 765 | 15,28 | ||||
| 2025-08-15 | 13F | Equitable Holdings, Inc. | 3 517 | 20,61 | 382 | 30,93 | ||||
| 2025-08-06 | 13F | Savant Capital, LLC | 139 701 | −5,69 | 15 170 | 2,43 | ||||
| 2025-07-21 | 13F | Creative Capital Management Investments LLC | 134 | 15 | ||||||
| 2025-08-13 | 13F | Baird Financial Group, Inc. | 7 809 | −9,88 | 848 | −2,19 | ||||
| 2025-05-01 | 13F | Quest 10 Wealth Builders, Inc. | 157 | 0,00 | 16 | −6,25 | ||||
| 2025-07-29 | 13F | Koshinski Asset Management, Inc. | 2 190 | 0,00 | 238 | 8,72 | ||||
| 2025-07-15 | 13F | Financial Management Professionals, Inc. | 0 | −100,00 | 0 | |||||
| 2025-08-11 | 13F | Hexagon Capital Partners LLC | 0 | −100,00 | 0 | |||||
| 2025-08-13 | 13F | Summit Financial, LLC | 208 491 | 1,73 | 22 640 | 10,49 | ||||
| 2025-07-09 | 13F | Mirador Capital Partners LP | 2 000 | 217 | ||||||
| 2025-07-24 | 13F | Cyndeo Wealth Partners, LLC | 4 926 | 0,02 | 535 | 8,54 | ||||
| 2025-08-13 | 13F | Jones Financial Companies Lllp | 2 772 | −0,61 | 299 | 7,58 | ||||
| 2025-08-14 | 13F | EP Wealth Advisors, Inc. | 23 361 | −36,57 | 2 537 | −31,12 | ||||
| 2025-07-25 | 13F | Apollon Financial, LLC | 2 716 | 0,00 | 295 | 8,49 | ||||
| 2025-07-10 | 13F | Focus Financial Network, Inc. | 7 418 | 1,77 | 806 | 10,58 | ||||
| 2025-08-12 | 13F | CIBC Private Wealth Group, LLC | 410 | 0,00 | 45 | 22,22 | ||||
| 2025-08-13 | 13F | Keystone Financial Group | 2 051 | −6,77 | 223 | 1,37 | ||||
| 2025-08-01 | 13F | Delta Investment Management, LLC | 2 068 | 0,05 | 225 | 8,74 | ||||
| 2025-08-12 | 13F | Wealthbridge Capital Management, Llc | 5 575 | 0,00 | 605 | 8,62 | ||||
| 2025-08-13 | 13F/A | StoneX Group Inc. | 0 | −100,00 | 0 | −100,00 | ||||
| 2025-07-30 | 13F | Pacific Sun Financial Corp | 2 972 | 0,00 | 323 | 8,42 | ||||
| 2025-08-12 | 13F | BlackRock, Inc. | 1 | 0 | ||||||
| 2025-08-04 | 13F | Assetmark, Inc | 1 778 | 193 | ||||||
| 2025-08-08 | 13F | Capital Investment Advisory Services, LLC | 20 121 | 0,00 | 2 185 | 8,60 | ||||
| 2025-08-11 | 13F | Strategic Wealth Partners, Ltd. | 220 | 24 | ||||||
| 2025-08-15 | 13F | Tower Research Capital LLC (TRC) | 4 182 | −28,13 | 454 | −21,86 | ||||
| 2025-08-07 | 13F | Strategy Asset Managers Llc | 3 681 | −1,52 | 400 | 6,97 | ||||
| 2025-08-14 | 13F | Bnp Paribas Arbitrage, Sa | 0 | −100,00 | 0 | |||||
| 2025-08-12 | 13F | Steward Partners Investment Advisory, Llc | 15 162 | −5,04 | 1 646 | 3,13 | ||||
| 2025-07-18 | 13F | Truist Financial Corp | 28 552 | −0,49 | 3 100 | 8,09 | ||||
| 2025-08-14 | 13F/A | Rockefeller Capital Management L.P. | 101 258 | 0,13 | 10 996 | 8,75 | ||||
| 2025-08-04 | 13F | Golden Road Advisors Llc | 3 235 | 0,00 | 351 | 8,67 | ||||
| 2025-07-25 | 13F | Keener Financial Planning LLC | 251 | 0,00 | 0 | |||||
| 2025-08-14 | 13F | Goldman Sachs Group Inc | 17 960 | 131,62 | 1 950 | 151,61 | ||||
| 2025-08-07 | 13F | Private Advisory Group LLC | 12 225 | 37,31 | 1 328 | 49,10 | ||||
| 2025-07-10 | 13F | Wealth Enhancement Advisory Services, Llc | 99 237 | −2,01 | 10 829 | 6,94 | ||||
| 2025-08-14 | 13F | Modern Wealth Management, LLC | 2 831 | 0,00 | 307 | 8,48 | ||||
| 2025-08-11 | 13F | Private Advisor Group, LLC | 5 878 | −10,20 | 638 | −2,45 | ||||
| 2025-08-14 | 13F | Kovitz Investment Group Partners, LLC | 1 842 | 200 | ||||||
| 2025-08-06 | 13F | AE Wealth Management LLC | 1 658 | −4,88 | 180 | 3,45 | ||||
| 2025-07-30 | 13F | Prosperity Financial Group, Inc. | 5 160 | 0,04 | 560 | 8,74 | ||||
| 2025-08-04 | 13F | Pensionmark Financial Group, Llc | 3 383 | −0,24 | 367 | 8,26 | ||||
| 2025-07-17 | 13F | Wagner Wealth Management, Llc | 1 186 | 0,00 | 129 | 8,47 | ||||
| 2025-07-22 | 13F | Coastal Investment Advisors, Inc. | 4 541 | 0,00 | 493 | 8,83 | ||||
| 2025-08-04 | 13F | Arkadios Wealth Advisors | 10 242 | 0,03 | 1 112 | 8,70 | ||||
| 2025-04-23 | 13F | Win Advisors, Inc | 0 | −100,00 | 0 | |||||
| 2025-07-25 | 13F | Cwm, Llc | 3 264 | −7,01 | 0 | |||||
| 2025-07-22 | 13F | Cedar Mountain Advisors, LLC | 28 | 0,00 | 3 | 50,00 | ||||
| 2025-07-30 | 13F | Capital Wealth Alliance, LLC | 5 937 | 7,28 | 644 | 16,67 | ||||
| 2025-07-07 | 13F | Investors Research Corp | 75 | 0,00 | 8 | 14,29 | ||||
| 2025-07-10 | 13F | Signal Advisors Wealth, LLC | 0 | −100,00 | 0 | |||||
| 2025-07-17 | 13F | G&S Capital LLC | 23 086 | −14,73 | 2 507 | −7,39 | ||||
| 2025-07-22 | 13F | Strid Group, LLC | 111 644 | −5,96 | 12 123 | 2,14 | ||||
| 2025-07-31 | 13F | Cambridge Investment Research Advisors, Inc. | 36 546 | −0,17 | 4 | 0,00 | ||||
| 2025-07-30 | 13F | Brookstone Capital Management | 2 674 | 1,10 | 290 | 9,85 | ||||
| 2025-08-06 | 13F | Commonwealth Equity Services, Llc | 376 028 | −1,99 | 41 | 5,26 | ||||
| 2025-07-08 | 13F | Parallel Advisors, LLC | 466 | 0,00 | 51 | 8,70 | ||||
| 2025-08-12 | 13F | Atlas Capital Advisors Llc | 44 | 0,00 | 5 | 0,00 | ||||
| 2025-07-14 | 13F | Sowell Financial Services LLC | 11 893 | 3,03 | 1 292 | 11,87 | ||||
| 2025-08-12 | 13F | Journey Strategic Wealth Llc | 3 554 | 0,00 | 386 | 8,45 | ||||
| 2025-08-04 | 13F | Integrity Alliance, Llc. | 8 305 | −4,22 | 902 | 4,04 | ||||
| 2025-08-14 | 13F | MGB Wealth Management, LLC | 19 581 | −0,20 | 2 125 | 8,36 | ||||
| 2025-08-13 | 13F | Smith, Moore & Co. | 2 123 | 0,00 | 231 | 8,49 | ||||
| 2025-08-12 | 13F | Financial Advocates Investment Management | 3 000 | 0,00 | 326 | 8,70 | ||||
| 2025-07-25 | 13F | Hazlett, Burt & Watson, Inc. | 100 | 0,00 | 0 | |||||
| 2025-07-18 | 13F | Institute for Wealth Management, LLC. | 45 817 | −1,67 | 4 975 | 6,81 | ||||
| 2025-07-25 | 13F | SPC Financial, Inc. | 3 830 | 0,00 | 416 | 8,64 | ||||
| 2025-08-27 | 13F/A | Putney Financial Group LLC | 133 | 0,00 | 14 | 7,69 | ||||
| 2025-07-21 | 13F | Barrett & Company, Inc. | 300 | 0,00 | 33 | 10,34 | ||||
| 2025-08-14 | 13F | Snowden Capital Advisors LLC | 16 293 | −2,51 | 1 769 | 5,93 | ||||
| 2025-07-15 | 13F | MCF Advisors LLC | 1 140 | 0,00 | 124 | 8,85 | ||||
| 2025-07-11 | 13F | Trinity Wealth Management, LLC | 3 482 | −0,20 | 378 | 8,62 | ||||
| 2025-07-28 | 13F | Kiker Wealth Management, LLC | 5 469 | −2,08 | 594 | 6,27 | ||||
| 2025-07-29 | 13F | Dale Q Rice Investment Management Ltd | 0 | −100,00 | 0 | |||||
| 2025-08-13 | 13F | Scotia Capital Inc. | 7 973 | −0,13 | 865 | 8,40 | ||||
| 2025-08-14 | 13F | Wells Fargo & Company/mn | 477 156 | −10,64 | 51 814 | −2,94 | ||||
| 2025-08-05 | 13F | EPG Wealth Management LLC | 0 | −100,00 | 0 | |||||
| 2025-07-29 | 13F | Salomon & Ludwin, LLC | 528 | 0,00 | 57 | 7,69 | ||||
| 2025-08-14 | 13F | Hrt Financial Lp | 3 051 | 0 | ||||||
| 2025-07-24 | 13F | Costello Asset Management, INC | 631 | 0,16 | 68 | 7,94 | ||||
| 2025-07-10 | 13F | Selective Wealth Management, Inc. | 2 798 | 0,00 | 306 | 14,61 | ||||
| 2025-08-14 | 13F | Ameriprise Financial Inc | 116 039 | −8,99 | 12 601 | −1,49 | ||||
| 2025-07-30 | 13F | Bogart Wealth, LLC | 114 | 0,00 | 12 | 9,09 | ||||
| 2025-08-11 | 13F | Mill Creek Capital Advisors, LLC | 6 574 | 0,00 | 714 | 8,52 | ||||
| 2025-07-17 | 13F | Sound Income Strategies, LLC | 0 | −100,00 | 0 | |||||
| 2025-08-14 | 13F | Jane Street Group, Llc | 0 | −100,00 | 0 | |||||
| 2025-08-14 | 13F | Stifel Financial Corp | 94 102 | 18,93 | 10 219 | 29,16 | ||||
| 2025-07-25 | 13F | LRI Investments, LLC | 200 | 0,00 | 22 | 10,53 | ||||
| 2025-08-14 | 13F | Fmr Llc | 7 838 | 2,06 | 851 | 10,95 | ||||
| 2025-08-14 | 13F | Benjamin Edwards Inc | 11 288 | 10,45 | 1 226 | 19,98 | ||||
| 2025-07-24 | 13F | Eastern Bank | 0 | −100,00 | 0 | |||||
| 2025-07-23 | 13F | Castle Rock Wealth Management, LLC | 3 130 | −3,10 | 350 | 8,05 | ||||
| 2025-07-30 | 13F | D.a. Davidson & Co. | 22 508 | −1,87 | 2 444 | 6,59 | ||||
| 2025-07-15 | 13F | Fifth Third Bancorp | 927 | 0,00 | 101 | 8,70 | ||||
| 2025-08-08 | 13F | Capital Investment Counsel, Inc | 392 | 0,00 | 43 | 7,69 | ||||
| 2025-07-15 | 13F | Affinity Wealth Management Llc | 2 057 | 0,00 | 223 | 8,78 | ||||
| 2025-08-07 | 13F | Allworth Financial LP | 1 615 | 0,00 | 175 | 10,06 | ||||
| 2025-08-13 | 13F | Transce3nd, LLC | 49 | 0,00 | 5 | 25,00 | ||||
| 2025-08-07 | 13F | Runnymede Capital Advisors, Inc. | 0 | −100,00 | 0 | |||||
| 2025-07-23 | 13F | Mullooly Asset Management, Inc. | 6 552 | 0,05 | 711 | 8,72 | ||||
| 2025-08-12 | 13F | J.w. Cole Advisors, Inc. | 0 | −100,00 | 0 | |||||
| 2025-07-25 | 13F | Sovereign Financial Group, Inc. | 16 763 | −1,29 | 1 820 | 7,25 | ||||
| 2025-08-14 | 13F | Colony Group, LLC | 13 197 | 1,46 | 1 433 | 10,23 | ||||
| 2025-08-14 | 13F | Vista Capital Partners, Inc. | 2 000 | 217 | ||||||
| 2025-08-12 | 13F | LPL Financial LLC | 324 446 | −8,37 | 35 232 | −0,47 | ||||
| 2025-05-07 | 13F | WMS Partners, LLC | 0 | −100,00 | 0 | |||||
| 2025-07-15 | 13F | Main Street Group, LTD | 0 | −100,00 | 0 | |||||
| 2025-08-11 | 13F | HHM Wealth Advisors, LLC | 943 | −6,63 | 102 | 2,00 | ||||
| 2025-07-28 | 13F | Frazier Financial Advisors, LLC | 174 | 0,00 | 19 | 5,88 | ||||
| 2025-08-14 | 13F | Fort Point Capital Partners LLC | 16 262 | −1,38 | 1 766 | 7,10 | ||||
| 2025-07-25 | 13F | Atria Wealth Solutions, Inc. | 0 | −100,00 | 0 | |||||
| 2025-08-06 | 13F | TKG Advisors, LLC | 3 427 | −11,19 | 372 | −3,38 | ||||
| 2025-07-23 | 13F | Trueblood Wealth Management, LLC | 1 910 | 207 | ||||||
| 2025-07-28 | 13F | Harbour Investments, Inc. | 594 | 0,00 | 65 | 8,47 | ||||
| 2025-08-05 | 13F | Carolinas Wealth Consulting Llc | 0 | −100,00 | 0 | −100,00 | ||||
| 2025-08-12 | 13F | MAI Capital Management | 300 | 0,00 | 33 | 10,34 | ||||
| 2025-08-14 | 13F | CIBC World Markets Inc. | 4 596 | 0,00 | 499 | 8,71 | ||||
| 2025-08-08 | 13F | Kingsview Wealth Management, LLC | 2 926 | 1,74 | 318 | 10,45 | ||||
| 2025-08-14 | 13F | Visionary Wealth Advisors | 1 950 | 212 | ||||||
| 2025-07-16 | 13F | Register Financial Advisors LLC | 12 | 0,00 | 1 | 0,00 | ||||
| 2025-08-12 | 13F | Tradition Wealth Management, LLC | 62 518 | −4,70 | 6 789 | 3,49 | ||||
| 2025-08-05 | 13F | Welch & Forbes Llc | 2 419 | 0,00 | 263 | 8,71 | ||||
| 2025-07-31 | 13F | LJI Wealth Management, LLC | 73 556 | 4,01 | 7 987 | 12,97 | ||||
| 2025-08-14 | 13F | Two Sigma Investments, Lp | 24 933 | 2 707 | ||||||
| 2025-07-09 | 13F | Sapient Capital Llc | 3 454 | 0,00 | 375 | 8,70 | ||||
| 2025-08-19 | 13F | National Asset Management, Inc. | 28 877 | 12,31 | 3 136 | 13,30 | ||||
| 2025-07-10 | 13F | CWC Advisors, LLC. | 2 006 | 0,00 | 218 | 8,50 | ||||
| 2025-07-29 | 13F | Stratos Wealth Partners, LTD. | 4 790 | 8,37 | 520 | 17,91 | ||||
| 2025-07-22 | 13F | Red Tortoise LLC | 245 | 27 | ||||||
| 2025-08-06 | 13F | Golden State Wealth Management, LLC | 45 | 0,00 | 5 | 0,00 | ||||
| 2025-08-19 | 13F | Anchor Investment Management, LLC | 855 | 0,00 | 93 | 8,24 | ||||
| 2025-08-14 | 13F | Mml Investors Services, Llc | 39 463 | 1,00 | 4 | 33,33 | ||||
| 2025-08-05 | 13F | Bank Of Montreal /can/ | 251 | 0,00 | 27 | 8,00 | ||||
| 2025-08-13 | 13F | Russell Investments Group, Ltd. | 295 | 0,00 | 32 | 10,34 | ||||
| 2025-08-14 | 13F | Raymond James Financial Inc | 506 116 | −25,81 | 54 959 | −19,42 | ||||
| 2025-08-13 | 13F | JBR Co Financial Management Inc | 30 012 | −3,07 | 3 259 | 5,30 |