Grundläggande statistik
| Institutionella ägare | 154 total, 154 long only, 0 short only, 0 long/short - change of 8,45% MRQ |
| Genomsnittlig portföljallokering | 0.1462 % - change of −9,33% MRQ |
| Institutionella aktier (lång) | 3 301 511 (ex 13D/G) - change of 0,04MM shares 1,25% MRQ |
| Institutionellt värde (lång) | $ 360 063 USD ($1000) |
Institutionellt ägande och aktieägare
Vanguard Admiral Funds - Vanguard S&P Mid-Cap 400 Growth ETF (US:IVOG) har 154 Institutionella ägare och aktieägare som har lämnat in 13D/G- eller 13F-formulär till Securities Exchange Commission (SEC). Dessa institut innehar totalt 3,301,511 aktier. Största aktieägare inkluderar Mariner, LLC, Raymond James Financial Inc, LPL Financial LLC, Morgan Stanley, Octavia Wealth Advisors, LLC, Stordahl Capital Management, Inc., Moneta Group Investment Advisors Llc, LJI Wealth Management, LLC, UBS Group AG, and Ameriprise Financial Inc .
Vanguard Admiral Funds - Vanguard S&P Mid-Cap 400 Growth ETF (ARCA:IVOG) Institutionell ägarstruktur visar institutioners och fonders nuvarande positioner i företaget, samt de senaste förändringarna i positionernas storlek. Större aktieägare kan vara enskilda investerare, fonder, hedgefonder eller institutioner. Bilaga 13D visar att investeraren äger (eller ägde) mer än 5% av företaget och avser (eller avsåg) att aktivt eftersträva en förändring av affärsstrategin. Schedule 13G indikerar en passiv investering på över 5%.
The share price as of September 8, 2025 is 120,50 / share. Previously, on September 9, 2024, the share price was 107,96 / share. This represents an increase of 11,62% over that period.

Fondsentimentets poäng
Fondsentimentet poängen(fka Ägarackumulation-poäng) visar vilka aktier som är mest köpta av fonder. Det är resultatet av en sofistikerad kvantitativ flerfaktormodell som identifierar företag med de högsta nivåerna av institutionell ackumulering. Poängsättningsmodellen använder en kombination av den totala ökningen av redovisade ägare, förändringarna i portföljallokeringarna för dessa ägare och andra mått. Siffran sträcker sig från 0 till 100, där högre siffror indikerar en högre nivå av ackumulering i förhållande till sina konkurrenter, och 50 är genomsnittet.
Uppdateringsfrekvens: Dagligen
Se Ownership Explorer, som innehåller en lista över de högst rankade företagen.
Institutionell sälj/köp-kvot
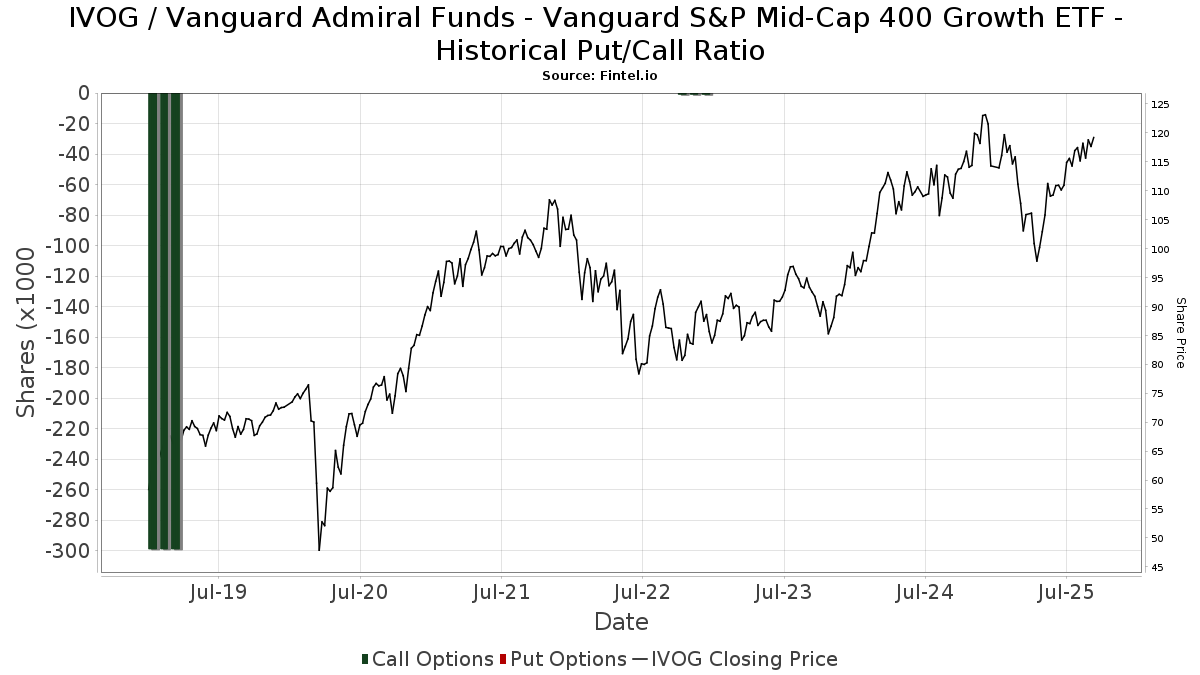
Förutom att rapportera vanliga eget kapital- och skuldemissioner måste institutioner med mer än 100MM tillgångar under förvaltning också avslöja sina innehav av sälj- och köpoptioner. Eftersom säljoptioner i allmänhet indikerar ett negativt sentiment och köpoptioner indikerar ett positivt sentiment, kan vi få en uppfattning om det övergripande institutionella sentimentet genom att plotta förhållandet mellan säljoptioner och köpoptioner. Diagrammet till höger visar det historiska förhållandet mellan sälj- och köpoptioner för detta instrument.
Genom att använda sälj/köp-kvoten som en indikator på aktieägarnas sentiment undviker man en av de största bristerna med att använda det totala institutionella ägandet, nämligen att en betydande del av de förvaltade tillgångarna investeras passivt för att följa index. Passivt förvaltade fonder köper vanligtvis inte optioner, så indikatorn för sälj/köp-kvoten ger en bättre bild av stämningen i aktivt förvaltade fonder.
13F- och NPORT-arkiveringar
Detaljer om 13F-arkiveringar är gratis. Detaljer om NP-arkiveringar kräver ett premiummedlemskap. Gröna rader indikerar nya positioner. Röda rader indikerar stängda positioner. Klicka på länk symbolen för att se hela transaktionshistoriken.
Uppgradera
för att låsa upp premiumdata och exportera till Excel ![]() .
.
| Fil Datum | Källa | Investerare | Typ | Genomsnittligt pris (beräknat) |
Aktier | Δ Aktier (%) |
Rapporterat värde (1000 USD) |
Δ Värde (%) |
Portföljallokering (%) |
|
|---|---|---|---|---|---|---|---|---|---|---|
| 2025-07-28 | 13F | Harbour Investments, Inc. | 39 915 | 10,75 | 4 512 | 21,33 | ||||
| 2025-08-11 | 13F | Aptus Capital Advisors, LLC | 3 215 | 6,56 | 363 | 16,72 | ||||
| 2025-08-06 | 13F | AE Wealth Management LLC | 2 380 | 0,38 | 269 | 10,25 | ||||
| 2025-08-06 | 13F | Adviser Investments LLC | 35 545 | −14,48 | 4 018 | −6,32 | ||||
| 2025-08-15 | 13F | CI Private Wealth, LLC | 3 230 | 365 | ||||||
| 2025-08-05 | 13F | Sunburst Financial Group, LLC | 2 129 | 241 | ||||||
| 2025-07-29 | 13F | Private Trust Co Na | 507 | 0,00 | 57 | 9,62 | ||||
| 2025-08-06 | 13F | Round Rock Advisors, LLC | 6 476 | 0,00 | 732 | 9,43 | ||||
| 2025-08-19 | 13F | Cape Investment Advisory, Inc. | 178 | 0,00 | 20 | 11,11 | ||||
| 2025-07-28 | 13F | IFG Advisors, LLC | 2 508 | 0,00 | 283 | 9,69 | ||||
| 2025-08-11 | 13F | Ritter Daniher Financial Advisory LLC / DE | 300 | −12,54 | 34 | −5,71 | ||||
| 2025-07-18 | 13F | SOA Wealth Advisors, LLC. | 344 | 0,00 | 39 | 8,57 | ||||
| 2025-07-30 | 13F | Whittier Trust Co | 150 | 0,00 | 17 | 6,67 | ||||
| 2025-08-08 | 13F | Cetera Investment Advisers | 71 953 | 11,08 | 8 133 | 21,68 | ||||
| 2025-08-11 | 13F | Goodman Financial Corp | 14 278 | 1 614 | ||||||
| 2025-08-12 | 13F | MAI Capital Management | 1 209 | −4,58 | 137 | 4,62 | ||||
| 2025-08-01 | 13F | American Financial & Tax Strategies Inc | 4 491 | 0,00 | 508 | 9,50 | ||||
| 2025-08-29 | 13F | Centaurus Financial, Inc. | 9 793 | −2,26 | 1 | 0,00 | ||||
| 2025-08-11 | 13F | Mosaic Family Wealth Partners, Llc | 2 220 | 0,00 | 251 | 9,17 | ||||
| 2025-04-28 | 13F | FSR Wealth Management Ltd. | 0 | −100,00 | 0 | |||||
| 2025-08-13 | 13F | Valued Retirements, Inc. | 2 402 | 0,00 | 271 | 9,72 | ||||
| 2025-08-13 | 13F | Jones Financial Companies Lllp | 2 628 | 130,53 | 297 | 152,99 | ||||
| 2025-05-15 | 13F | GWM Advisors LLC | 0 | −100,00 | 0 | |||||
| 2025-07-22 | 13F | Miracle Mile Advisors, LLC | 56 365 | −0,04 | 6 371 | 9,51 | ||||
| 2025-08-08 | 13F | Avantax Advisory Services, Inc. | 4 358 | 54,10 | 493 | 69,07 | ||||
| 2025-08-13 | 13F | Baird Financial Group, Inc. | 68 433 | 0,55 | 7 735 | 10,16 | ||||
| 2025-08-14 | 13F | Financial Network Wealth Advisors LLC | 61 | 7 | ||||||
| 2025-07-28 | 13F | Sagace Wealth Management LLC | 0 | −100,00 | 0 | |||||
| 2025-08-08 | 13F | Meridian Wealth Management, LLC | 4 450 | 0,16 | 503 | 9,61 | ||||
| 2025-07-07 | 13F | Nova Wealth Management, Inc. | 7 462 | −17,97 | 843 | −10,13 | ||||
| 2025-07-31 | 13F | LJI Wealth Management, LLC | 113 975 | 11,80 | 12 883 | 22,48 | ||||
| 2025-08-14 | 13F | Goldman Sachs Group Inc | 6 627 | −28,57 | 749 | −21,73 | ||||
| 2025-08-08 | 13F | Pnc Financial Services Group, Inc. | 2 873 | 0,00 | 325 | 9,46 | ||||
| 2025-08-14 | 13F | Hrt Financial Lp | 2 344 | 0 | ||||||
| 2025-07-31 | 13F | Brinker Capital Investments, LLC | 0 | −100,00 | 0 | −100,00 | ||||
| 2025-07-16 | 13F | Perigon Wealth Management, LLC | 1 907 | 216 | ||||||
| 2025-09-04 | 13F/A | Advisor Group Holdings, Inc. | 8 661 | −2,89 | 978 | 6,20 | ||||
| 2025-08-14 | 13F | UBS Group AG | 93 046 | 7,74 | 10 517 | 18,04 | ||||
| 2025-08-13 | 13F | Cary Street Partners Financial Llc | 15 681 | −73,17 | 1 772 | −70,61 | ||||
| 2025-08-14 | 13F | Colony Group, LLC | 1 807 | 204 | ||||||
| 2025-07-16 | 13F | Embree Financial Group | 6 659 | 0,00 | 753 | 9,62 | ||||
| 2025-07-24 | 13F | Conning Inc. | 2 726 | 308 | ||||||
| 2025-07-31 | 13F | City State Bank | 100 | 0,00 | 11 | 10,00 | ||||
| 2025-07-25 | 13F | Cwm, Llc | 6 | 0 | ||||||
| 2025-04-07 | 13F | GoalVest Advisory LLC | 0 | −100,00 | 0 | |||||
| 2025-08-04 | 13F | Quaker Wealth Management, LLC | 277 | 31 | ||||||
| 2025-07-24 | 13F | Bernard Wealth Management Corp. | 56 | 0,00 | 6 | 20,00 | ||||
| 2025-08-12 | 13F | O'shaughnessy Asset Management, Llc | 424 | −9,21 | 48 | −2,08 | ||||
| 2025-07-14 | 13F | AdvisorNet Financial, Inc | 8 | 0,00 | 1 | |||||
| 2025-07-21 | 13F | Ameritas Advisory Services, LLC | 270 | 31 | ||||||
| 2025-07-15 | 13F | North Star Investment Management Corp. | 102 | 0,00 | 12 | 10,00 | ||||
| 2025-08-05 | 13F | Key FInancial Inc | 356 | 0,00 | 40 | 11,11 | ||||
| 2025-08-13 | 13F | ESG Planning | 17 600 | 1 989 | ||||||
| 2025-08-11 | 13F | Citigroup Inc | 954 | −98,43 | 108 | −98,29 | ||||
| 2025-08-15 | 13F | Kestra Advisory Services, LLC | 64 516 | 4,11 | 7 292 | 14,06 | ||||
| 2025-07-24 | 13F | Financial Security Advisor, Inc. | 4 190 | 0,00 | 474 | 9,49 | ||||
| 2025-08-14 | 13F | Mariner, LLC | 691 859 | 0,07 | 78 201 | 9,63 | ||||
| 2025-04-23 | 13F | Creative Financial Designs Inc /adv | 0 | 0 | ||||||
| 2025-08-04 | 13F | Spire Wealth Management | 439 | 48,31 | 50 | 63,33 | ||||
| 2025-07-02 | 13F | Central Pacific Bank - Trust Division | 6 | 0,00 | 1 | |||||
| 2025-07-18 | 13F | Founders Capital Management | 673 | 0,00 | 76 | 10,14 | ||||
| 2025-08-12 | 13F | CIBC Private Wealth Group, LLC | 5 718 | 0,00 | 646 | 23,52 | ||||
| 2025-07-08 | 13F/A | Salem Investment Counselors Inc | 10 | −71,43 | 1 | −66,67 | ||||
| 2025-08-12 | 13F | Bokf, Na | 103 | 12 | ||||||
| 2025-04-17 | 13F | Breakwater Investment Management | 0 | −100,00 | 0 | |||||
| 2025-08-07 | 13F | Montag A & Associates Inc | 12 790 | −0,66 | 1 446 | 8,81 | ||||
| 2025-08-14 | 13F | Mendel Capital Management LLC | 20 113 | −3,76 | 2 273 | 5,48 | ||||
| 2025-07-24 | 13F | Us Bancorp \de\ | 305 | 0,00 | 34 | 9,68 | ||||
| 2025-08-12 | 13F | Clark Financial Services Group Inc /bd | 37 144 | 0,54 | 4 198 | 10,15 | ||||
| 2025-08-14 | 13F | Two Sigma Securities, Llc | 0 | −100,00 | 0 | |||||
| 2025-08-08 | 13F | SBI Securities Co., Ltd. | 19 | 0,00 | 2 | 100,00 | ||||
| 2025-08-12 | 13F | Jpmorgan Chase & Co | 36 695 | −0,19 | 4 148 | 9,33 | ||||
| 2025-05-05 | 13F | Eagle Bay Advisors LLC | 0 | −100,00 | 0 | |||||
| 2025-08-06 | 13F | Savant Capital, LLC | 25 224 | −2,01 | 2 851 | 7,38 | ||||
| 2025-08-14 | 13F | Raymond James Financial Inc | 194 729 | −0,55 | 22 010 | 8,96 | ||||
| 2025-08-14 | 13F | Warren Averett Asset Management, LLC | 3 519 | 5,90 | 398 | 16,08 | ||||
| 2025-07-08 | 13F | Parallel Advisors, LLC | 1 000 | 113 | ||||||
| 2025-07-17 | 13F | Heritage Investment Group, Inc. | 8 502 | 0,00 | 961 | 9,58 | ||||
| 2025-08-14 | 13F | Bank Of America Corp /de/ | 69 874 | −1,79 | 7 898 | 7,59 | ||||
| 2025-08-06 | 13F | Rialto Wealth Management, LLC | 3 194 | −16,78 | 361 | −8,61 | ||||
| 2025-08-12 | 13F | SRS Capital Advisors, Inc. | 597 | 239,20 | 67 | 272,22 | ||||
| 2025-08-14 | 13F | Wells Fargo & Company/mn | 56 604 | −25,48 | 6 398 | −18,36 | ||||
| 2025-05-15 | 13F | Captrust Financial Advisors | 0 | −100,00 | 0 | |||||
| 2025-05-16 | 13F/A | Atlanta Consulting Group Advisors, LLC | 0 | −100,00 | 0 | |||||
| 2025-07-24 | 13F | Drucker Wealth 3.0, LLC | 14 549 | 1 681 | ||||||
| 2025-07-18 | 13F | Consolidated Portfolio Review Corp | 2 956 | −1,17 | 334 | 8,44 | ||||
| 2025-08-07 | 13F | Allworth Financial LP | 31 893 | −3,12 | 3 605 | 7,13 | ||||
| 2025-08-04 | 13F | Keybank National Association/oh | 29 786 | 4,64 | 3 367 | 14,65 | ||||
| 2025-04-17 | 13F | Abound Wealth Management | 0 | −100,00 | 0 | |||||
| 2025-08-12 | 13F | Franklin Resources Inc | 27 394 | 0,00 | 3 096 | 9,55 | ||||
| 2025-07-10 | 13F | Wealth Enhancement Advisory Services, Llc | 6 172 | 30,16 | 713 | 45,60 | ||||
| 2025-08-04 | 13F | BLB&B Advisors, LLC | 2 822 | 0,00 | 319 | 9,28 | ||||
| 2025-08-14 | 13F | Betterment LLC | 7 176 | −8,68 | 1 | |||||
| 2025-07-31 | 13F | Oppenheimer & Co Inc | 0 | −100,00 | 0 | |||||
| 2025-08-14 | 13F | Royal Bank Of Canada | 17 937 | −5,09 | 2 028 | 4,05 | ||||
| 2025-07-29 | 13F | Stordahl Capital Management, Inc. | 141 778 | 1,32 | 16 025 | 11,01 | ||||
| 2025-08-04 | 13F | Assetmark, Inc | 491 | −90,83 | 55 | −90,04 | ||||
| 2025-08-11 | 13F | Advisor Resource Council | 0 | −100,00 | 0 | |||||
| 2025-07-11 | 13F | Farther Finance Advisors, LLC | 663 | 0,00 | 75 | 7,25 | ||||
| 2025-07-25 | 13F | Sequoia Financial Advisors, LLC | 1 795 | 203 | ||||||
| 2025-08-14 | 13F | Moneta Group Investment Advisors Llc | 128 829 | 159,75 | 14 561 | 184,62 | ||||
| 2025-08-12 | 13F | Global Retirement Partners, LLC | 1 728 | 0,00 | 195 | 0,52 | ||||
| 2025-08-12 | 13F | Virtu Financial LLC | 7 335 | −18,64 | 1 | |||||
| 2025-07-21 | 13F | Crews Bank & Trust | 80 | 0,00 | 9 | 12,50 | ||||
| 2025-08-14 | 13F | EP Wealth Advisors, Inc. | 950 | 107 | ||||||
| 2025-08-11 | 13F | Private Advisor Group, LLC | 16 483 | −3,25 | 1 863 | 6,03 | ||||
| 2025-07-22 | 13F | Integrated Capital Management, LLC | 33 452 | 13,35 | 4 | 0,00 | ||||
| 2025-08-14 | 13F | CIBC World Markets Inc. | 9 340 | 0,31 | 1 056 | 9,90 | ||||
| 2025-08-01 | 13F | Envestnet Asset Management Inc | 17 753 | −4,92 | 2 007 | 4,15 | ||||
| 2025-08-12 | 13F | Proequities, Inc. | 0 | 0 | ||||||
| 2025-08-08 | 13F | Gts Securities Llc | 8 107 | 916 | ||||||
| 2025-07-31 | 13F | Hobart Private Capital, LLC | 4 738 | 0,00 | 536 | 9,63 | ||||
| 2025-08-26 | 13F/A | Thrivent Financial For Lutherans | 17 623 | 2 | ||||||
| 2025-05-09 | 13F | Wealthspire Advisors, LLC | 0 | −100,00 | 0 | |||||
| 2025-04-21 | 13F | Ronald Blue Trust, Inc. | 0 | −100,00 | 0 | |||||
| 2025-08-15 | 13F | Morgan Stanley | 169 543 | 29,83 | 19 164 | 42,23 | ||||
| 2025-08-07 | 13F | PFG Advisors | 0 | −100,00 | 0 | |||||
| 2025-08-15 | 13F | Equitable Holdings, Inc. | 7 957 | 1,97 | 899 | 11,68 | ||||
| 2025-08-14 | 13F | Citadel Advisors Llc | 5 294 | −74,02 | 598 | −71,55 | ||||
| 2025-07-21 | 13F | Ameriflex Group, Inc. | 596 | 0,68 | 67 | 9,84 | ||||
| 2025-08-11 | 13F | Insight 2811, Inc. | 2 301 | 260 | ||||||
| 2025-08-14 | 13F | Safeguard Investment Advisory Group, LLC | 2 600 | 0,00 | 294 | 9,33 | ||||
| 2025-08-08 | 13F | Creative Planning | 14 708 | 1,49 | 1 662 | 11,17 | ||||
| 2025-07-28 | 13F | Bridges Investment Management Inc | 3 860 | 0,00 | 436 | 9,55 | ||||
| 2025-07-22 | 13F | Merit Financial Group, LLC | 5 439 | −6,48 | 615 | 2,33 | ||||
| 2025-08-04 | 13F | Quaker Wealth Management, LLC | Put | 0 | −100,00 | 0 | −100,00 | |||
| 2025-08-14 | 13F | Mercer Global Advisors Inc /adv | 8 298 | 3,54 | 941 | 15,89 | ||||
| 2025-07-16 | 13F | Octavia Wealth Advisors, LLC | 143 862 | −11,04 | 16 261 | −2,54 | ||||
| 2025-08-06 | 13F | Commonwealth Equity Services, Llc | 16 418 | −19,02 | 2 | −50,00 | ||||
| 2025-07-10 | 13F | Weinberger Asset Management, Inc | 2 161 | 0,00 | 244 | 9,91 | ||||
| 2025-07-17 | 13F | Hanson & Doremus Investment Management | 902 | 0,00 | 0 | |||||
| 2025-03-12 | 13F/A | Private Capital Management Llc | 3 698 | −0,16 | 405 | −3,57 | ||||
| 2025-08-05 | 13F | MidAtlantic Capital Management, Inc. | 3 680 | 0,00 | 416 | 9,50 | ||||
| 2025-08-14 | 13F | Ameriprise Financial Inc | 92 841 | 20,04 | 10 489 | 31,25 | ||||
| 2025-08-12 | 13F | Howe & Rusling Inc | 466 | 0,00 | 53 | 8,33 | ||||
| 2025-07-29 | 13F | Rodgers & Associates, LTD | 3 606 | 2,27 | 408 | 12,12 | ||||
| 2025-08-11 | 13F | Sierra Capital LLC | 2 628 | 0 | ||||||
| 2025-08-13 | 13F | SageView Advisory Group, LLC | 18 087 | −29,94 | 2 129 | −20,09 | ||||
| 2025-07-29 | 13F | Salomon & Ludwin, LLC | 257 | 0,00 | 30 | 11,54 | ||||
| 2025-08-11 | 13F | Principal Securities, Inc. | 1 587 | 3,86 | 179 | 4,07 | ||||
| 2025-07-21 | 13F | Barrett & Company, Inc. | 968 | 0,00 | 109 | 10,10 | ||||
| 2025-08-08 | 13F | Larson Financial Group LLC | 1 | 0,00 | 0 | |||||
| 2025-07-25 | 13F | Atria Wealth Solutions, Inc. | 1 808 | −16,37 | 208 | −6,73 | ||||
| 2025-08-11 | 13F | WPG Advisers, LLC | 256 | 0,00 | 29 | 7,69 | ||||
| 2025-08-14 | 13F | Stifel Financial Corp | 29 598 | −1,66 | 3 345 | 7,73 | ||||
| 2025-07-17 | 13F | Lauterbach Financial Advisors, LLC | 6 125 | 0,00 | 692 | 9,67 | ||||
| 2025-07-24 | 13F | Jfs Wealth Advisors, Llc | 2 188 | 12,38 | 247 | 23,50 | ||||
| 2025-08-06 | 13F | SOUTH STATE Corp | 3 698 | 0,00 | 418 | 9,45 | ||||
| 2025-07-24 | 13F | Morton Brown Family Wealth, LLC | 1 936 | 10,63 | 219 | 21,11 | ||||
| 2025-07-24 | 13F | Blair William & Co/il | 15 819 | −2,99 | 1 788 | 6,24 | ||||
| 2025-07-15 | 13F | Mather Group, Llc. | 0 | −100,00 | 0 | |||||
| 2025-07-17 | 13F | Sound Income Strategies, LLC | 12 | −50,00 | 1 | −50,00 | ||||
| 2025-08-13 | 13F | Financial Freedom, LLC | 2 499 | −14,27 | 282 | −6,00 | ||||
| 2025-08-05 | 13F | Plante Moran Financial Advisors, LLC | 561 | 63 | ||||||
| 2025-08-14 | 13F | Mml Investors Services, Llc | 12 181 | 25,25 | 1 | 0,00 | ||||
| 2025-07-23 | 13F | Stephen J. Garry & Associates, Llc | 36 751 | −0,43 | 4 154 | 9,09 | ||||
| 2025-07-22 | 13F | Coastal Investment Advisors, Inc. | 0 | −100,00 | 0 | |||||
| 2025-08-14 | 13F | Jane Street Group, Llc | 7 676 | −10,07 | 868 | −1,48 | ||||
| 2025-08-04 | 13F | Bristlecone Advisors, LLC | 220 | 0,00 | 25 | 9,09 | ||||
| 2025-07-29 | 13F | Chicago Partners Investment Group LLC | 12 517 | 3,69 | 1 464 | 14,57 | ||||
| 2025-05-05 | 13F | Lindbrook Capital, Llc | 350 | 0,00 | 36 | −7,69 | ||||
| 2025-08-11 | 13F | HighTower Advisors, LLC | 14 888 | −2,41 | 1 683 | 6,93 | ||||
| 2025-07-09 | 13F | Dynamic Advisor Solutions LLC | 1 960 | 222 | ||||||
| 2025-08-19 | 13F | Asset Dedication, LLC | 110 | 0,00 | 12 | 9,09 | ||||
| 2025-07-31 | 13F | Cambridge Investment Research Advisors, Inc. | 7 059 | 0,33 | 1 | |||||
| 2025-08-14 | 13F | Comerica Bank | 150 | −13,79 | 17 | −5,88 | ||||
| 2025-05-08 | 13F | Marshall Investment Management, Llc | 0 | −100,00 | 0 | |||||
| 2025-08-14 | 13F | Fmr Llc | 6 360 | 27,58 | 719 | 39,69 | ||||
| 2025-08-14 | 13F | Susquehanna International Group, Llp | 10 157 | 62,72 | 1 148 | 78,54 | ||||
| 2025-08-12 | 13F | LPL Financial LLC | 179 585 | 12,79 | 20 299 | 23,56 | ||||
| 2025-07-25 | 13F | We Are One Seven, LLC | 2 147 | −0,51 | 243 | 9,01 | ||||
| 2025-08-07 | 13F | Commerce Bank | 6 960 | 0,00 | 787 | 9,47 | ||||
| 2025-08-13 | 13F | Balanced Wealth Group Llc | 2 283 | 0,00 | 264 | 11,91 | ||||
| 2025-08-13 | 13F | Russell Investments Group, Ltd. | 390 | 0,00 | 44 | 10,00 | ||||
| 2025-08-14 | 13F | Ausdal Financial Partners, Inc. | 2 478 | 0,85 | 280 | 10,67 | ||||
| 2025-08-13 | 13F | Northwestern Mutual Wealth Management Co | 27 939 | 62,97 | 3 158 | 78,56 | ||||
| 2025-05-15 | 13F | Lido Advisors, LLC | 0 | −100,00 | 0 | −100,00 |