Grundläggande statistik
| Institutionella ägare | 121 total, 121 long only, 0 short only, 0 long/short - change of 19,61% MRQ |
| Genomsnittlig portföljallokering | 0.3440 % - change of −3,02% MRQ |
| Institutionella aktier (lång) | 5 885 683 (ex 13D/G) - change of −0,49MM shares −7,69% MRQ |
| Institutionellt värde (lång) | $ 209 645 USD ($1000) |
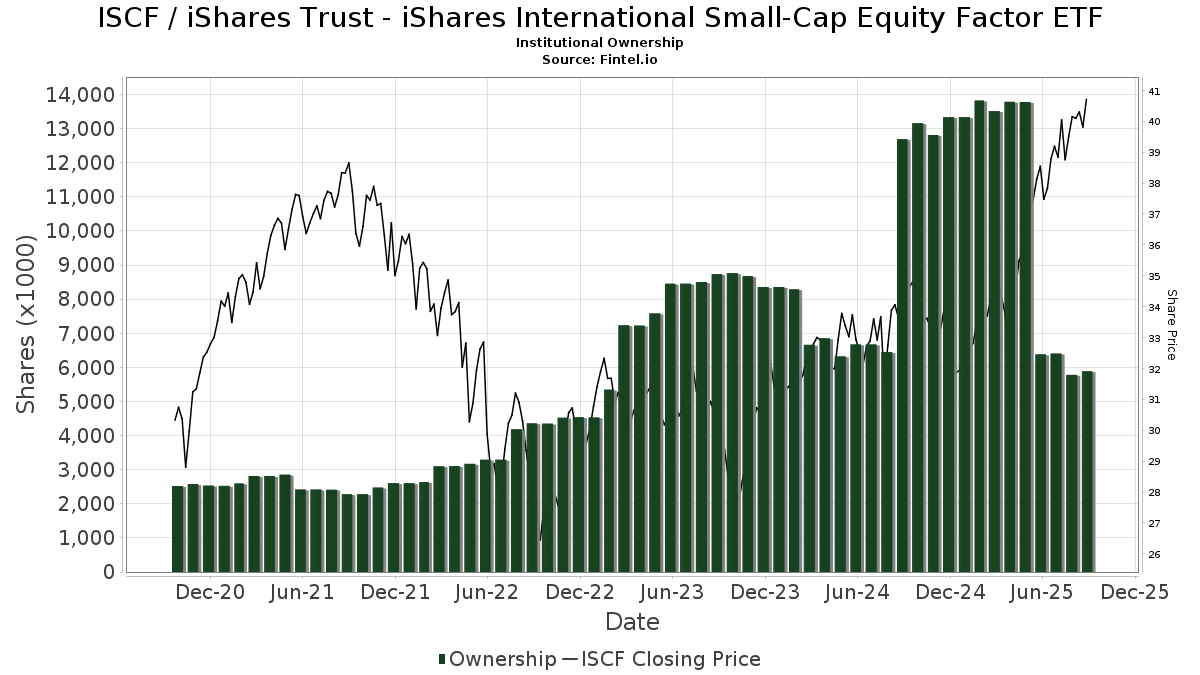
Institutionellt ägande och aktieägare
iShares Trust - iShares International Small-Cap Equity Factor ETF (US:ISCF) har 121 Institutionella ägare och aktieägare som har lämnat in 13D/G- eller 13F-formulär till Securities Exchange Commission (SEC). Dessa institut innehar totalt 5,885,683 aktier. Största aktieägare inkluderar Envestnet Asset Management Inc, Modern Wealth Management, LLC, FGSM - Frontier Asset Global Small Cap Equity ETF, Phoenix Wealth Advisors, Janney Montgomery Scott LLC, Financial Strategies Group, Inc., LPL Financial LLC, Larson Financial Group LLC, Northwestern Mutual Wealth Management Co, and Exchange Traded Concepts, Llc .
iShares Trust - iShares International Small-Cap Equity Factor ETF (ARCA:ISCF) Institutionell ägarstruktur visar institutioners och fonders nuvarande positioner i företaget, samt de senaste förändringarna i positionernas storlek. Större aktieägare kan vara enskilda investerare, fonder, hedgefonder eller institutioner. Bilaga 13D visar att investeraren äger (eller ägde) mer än 5% av företaget och avser (eller avsåg) att aktivt eftersträva en förändring av affärsstrategin. Schedule 13G indikerar en passiv investering på över 5%.
The share price as of September 8, 2025 is 40,90 / share. Previously, on September 9, 2024, the share price was 33,37 / share. This represents an increase of 22,57% over that period.
Fondsentimentets poäng
Fondsentimentet poängen(fka Ägarackumulation-poäng) visar vilka aktier som är mest köpta av fonder. Det är resultatet av en sofistikerad kvantitativ flerfaktormodell som identifierar företag med de högsta nivåerna av institutionell ackumulering. Poängsättningsmodellen använder en kombination av den totala ökningen av redovisade ägare, förändringarna i portföljallokeringarna för dessa ägare och andra mått. Siffran sträcker sig från 0 till 100, där högre siffror indikerar en högre nivå av ackumulering i förhållande till sina konkurrenter, och 50 är genomsnittet.
Uppdateringsfrekvens: Dagligen
Se Ownership Explorer, som innehåller en lista över de högst rankade företagen.
Institutionell sälj/köp-kvot
Förutom att rapportera vanliga eget kapital- och skuldemissioner måste institutioner med mer än 100MM tillgångar under förvaltning också avslöja sina innehav av sälj- och köpoptioner. Eftersom säljoptioner i allmänhet indikerar ett negativt sentiment och köpoptioner indikerar ett positivt sentiment, kan vi få en uppfattning om det övergripande institutionella sentimentet genom att plotta förhållandet mellan säljoptioner och köpoptioner. Diagrammet till höger visar det historiska förhållandet mellan sälj- och köpoptioner för detta instrument.
Genom att använda sälj/köp-kvoten som en indikator på aktieägarnas sentiment undviker man en av de största bristerna med att använda det totala institutionella ägandet, nämligen att en betydande del av de förvaltade tillgångarna investeras passivt för att följa index. Passivt förvaltade fonder köper vanligtvis inte optioner, så indikatorn för sälj/köp-kvoten ger en bättre bild av stämningen i aktivt förvaltade fonder.
13F- och NPORT-arkiveringar
Detaljer om 13F-arkiveringar är gratis. Detaljer om NP-arkiveringar kräver ett premiummedlemskap. Gröna rader indikerar nya positioner. Röda rader indikerar stängda positioner. Klicka på länk symbolen för att se hela transaktionshistoriken.
Uppgradera
för att låsa upp premiumdata och exportera till Excel ![]() .
.
| Fil Datum | Källa | Investerare | Typ | Genomsnittligt pris (beräknat) |
Aktier | Δ Aktier (%) |
Rapporterat värde (1000 USD) |
Δ Värde (%) |
Portföljallokering (%) |
|
|---|---|---|---|---|---|---|---|---|---|---|
| 2025-07-09 | 13F | Breakwater Capital Group | 22 531 | 0,34 | 874 | 15,48 | ||||
| 2025-08-13 | 13F | MONECO Advisors, LLC | 6 245 | −8,30 | 242 | 5,68 | ||||
| 2025-08-13 | 13F | Beacon Pointe Advisors, LLC | 149 510 | −19,34 | 5 797 | −7,15 | ||||
| 2025-04-21 | 13F | Ronald Blue Trust, Inc. | 0 | −100,00 | 0 | |||||
| 2025-07-11 | 13F | Farther Finance Advisors, LLC | 37 267 | −9,02 | 1 445 | 4,64 | ||||
| 2025-07-16 | 13F | Perigon Wealth Management, LLC | 36 792 | −6,16 | 1 426 | 8,03 | ||||
| 2025-07-29 | 13F | Signature Estate & Investment Advisors Llc | 5 504 | 213 | ||||||
| 2025-08-19 | 13F | Anchor Investment Management, LLC | 800 | 0,00 | 31 | 19,23 | ||||
| 2025-08-01 | 13F | Envestnet Asset Management Inc | 410 647 | −27,18 | 15 921 | −16,18 | ||||
| 2025-08-27 | 13F | Stonebridge Wealth Management, LLC | 21 124 | 819 | ||||||
| 2025-08-12 | 13F | Howe & Rusling Inc | 33 | 1 | ||||||
| 2025-08-14 | 13F | Vista Investment Management | 27 550 | 1,88 | 1 068 | 17,36 | ||||
| 2025-08-06 | 13F | Modera Wealth Management, LLC | 34 684 | 0,00 | 1 345 | 15,07 | ||||
| 2025-09-04 | 13F/A | Advisor Group Holdings, Inc. | 36 738 | 8,04 | 1 424 | 24,37 | ||||
| 2025-08-06 | 13F | Adviser Investments LLC | 21 560 | −27,82 | 836 | −17,00 | ||||
| 2025-08-13 | 13F | Flow Traders U.s. Llc | 0 | −100,00 | 0 | |||||
| 2025-08-12 | 13F | LPL Financial LLC | 204 716 | 5,32 | 7 937 | 21,23 | ||||
| 2025-07-23 | 13F | Eagle Strategies LLC | 136 888 | 5,42 | 5 307 | 21,36 | ||||
| 2025-07-14 | 13F | Sowell Financial Services LLC | 5 417 | 210 | ||||||
| 2025-07-24 | 13F | Capital Advisors, Ltd. LLC | 2 600 | 0,00 | 0 | |||||
| 2025-08-08 | 13F | Cetera Investment Advisers | 65 505 | 27,50 | 2 540 | 46,76 | ||||
| 2025-08-08 | 13F | Kingsview Wealth Management, LLC | 6 202 | −12,92 | 240 | 0,42 | ||||
| 2025-08-26 | NP | EVTTX - The E-Valuator Conservative/Moderate (30%-50%) RMS Fund Service Class Shares | 2 008 | −6,34 | 78 | 16,67 | ||||
| 2025-08-26 | NP | EVVLX - The E-Valuator Very Conservative (0%-15%) RMS Fund Service Class Shares | 855 | 33 | ||||||
| 2025-08-08 | 13F | Intrua Financial, LLC | 27 728 | 359,30 | 1 075 | 429,56 | ||||
| 2025-08-08 | 13F | Advyzon Investment Management, LLC | 6 204 | −0,89 | 241 | 14,29 | ||||
| 2025-07-10 | 13F | Exchange Traded Concepts, Llc | 161 595 | −46,72 | 6 265 | −38,66 | ||||
| 2025-07-17 | 13F | Montis Financial, LLC | 26 631 | 33,25 | 1 033 | 53,34 | ||||
| 2025-08-15 | 13F | Morgan Stanley | 4 543 | −2,11 | 176 | 12,82 | ||||
| 2025-08-26 | NP | EVMLX - The E-Valuator Moderate (50%-70%) RMS Fund Service Class Shares | 15 957 | −8,26 | 619 | 15,30 | ||||
| 2025-07-24 | 13F | IFP Advisors, Inc | 224 | 9 | ||||||
| 2025-08-14 | 13F | Royal Bank Of Canada | 7 792 | 1,96 | 302 | 17,51 | ||||
| 2025-07-16 | 13F | Beaumont Financial Advisors, LLC | 6 714 | 0,57 | 260 | 16,07 | ||||
| 2025-04-11 | 13F | Insight Advisors, LLC/ PA | 0 | −100,00 | 0 | |||||
| 2025-07-30 | 13F | Bogart Wealth, LLC | 326 | 44,89 | 13 | 71,43 | ||||
| 2025-08-08 | 13F | Avantax Advisory Services, Inc. | 5 332 | 207 | ||||||
| 2025-07-28 | 13F | Courier Capital Llc | 156 817 | 2,22 | 6 080 | 17,67 | ||||
| 2025-08-14 | 13F | Jane Street Group, Llc | 17 014 | −83,53 | 660 | −81,06 | ||||
| 2025-05-14 | 13F | Susquehanna International Group, Llp | 0 | −100,00 | 0 | |||||
| 2025-08-08 | 13F | JBF Capital, Inc. | 56 312 | 2 183 | ||||||
| 2025-07-30 | 13F | Exencial Wealth Advisors, Llc | 11 257 | 0,75 | 436 | 15,96 | ||||
| 2025-08-13 | 13F | Financial Freedom, LLC | 30 477 | 12,66 | 1 182 | 29,64 | ||||
| 2025-08-14 | 13F | Financial Strategies Group, Inc. | 208 182 | 2,58 | 8 117 | 18,70 | ||||
| 2025-08-12 | 13F | Steward Partners Investment Advisory, Llc | 0 | −100,00 | 0 | |||||
| 2025-08-14 | 13F | Integrated Wealth Concepts LLC | 10 142 | −4,43 | 393 | 10,08 | ||||
| 2025-07-24 | 13F | Williams & Novak, LLC | 54 191 | 8,50 | 2 101 | 24,78 | ||||
| 2025-07-25 | 13F | Cwm, Llc | 312 | 4,00 | 0 | |||||
| 2025-08-07 | 13F | Allworth Financial LP | 184 | −23,65 | 7 | −12,50 | ||||
| 2025-08-14 | 13F | Ariadne Wealth Management, LP | 9 795 | −20,62 | 393 | −11,69 | ||||
| 2025-08-08 | 13F | Larson Financial Group LLC | 182 907 | 961,25 | 7 091 | 1 122,59 | ||||
| 2025-08-06 | 13F | Horizon Investment Services, LLC | 19 511 | −3,00 | 756 | 11,67 | ||||
| 2025-08-14 | 13F | Mml Investors Services, Llc | 89 435 | −24,11 | 3 | 0,00 | ||||
| 2025-08-05 | 13F | GHP Investment Advisors, Inc. | 4 360 | 0,00 | 169 | 15,75 | ||||
| 2025-08-14 | 13F | UBS Group AG | 1 | 0 | ||||||
| 2025-05-09 | 13F | GeoWealth Management, LLC | 0 | −100,00 | 0 | −100,00 | ||||
| 2025-07-25 | 13F | Index Fund Advisors, Inc. | 18 016 | 1,89 | 698 | 17,31 | ||||
| 2025-08-14 | 13F | Warren Averett Asset Management, LLC | 34 806 | 0,68 | 1 349 | 15,89 | ||||
| 2025-08-04 | 13F | Arbor Capital Management Inc /adv | 10 870 | 17,29 | 421 | 35,37 | ||||
| 2025-07-31 | 13F | Glass Jacobson Investment Advisors llc | 50 320 | 1,13 | 1 951 | 21,42 | ||||
| 2025-08-06 | 13F | Commonwealth Equity Services, Llc | 97 278 | −0,87 | 4 | 0,00 | ||||
| 2025-08-01 | 13F | Rossby Financial, LCC | 200 | 0,00 | 8 | 0,00 | ||||
| 2025-08-08 | 13F | Advisors Capital Management, LLC | 123 387 | 95,01 | 4 784 | 124,55 | ||||
| 2025-08-12 | 13F | Bedel Financial Consulting, Inc. | 123 178 | −0,64 | 4 776 | 6,75 | ||||
| 2025-08-14 | 13F | Beaird Harris Wealth Management, LLC | 143 139 | −3,88 | 5 550 | 10,65 | ||||
| 2025-05-12 | 13F | Regal Investment Advisors LLC | 0 | −100,00 | 0 | |||||
| 2025-08-13 | 13F | Vance Wealth, Inc. | 9 787 | 379 | ||||||
| 2025-07-07 | 13F | Thurston, Springer, Miller, Herd & Titak, Inc. | 30 787 | 597,80 | 1 194 | 706,08 | ||||
| 2025-08-14 | 13F | Aqr Capital Management Llc | 0 | −100,00 | 0 | |||||
| 2025-07-24 | 13F | McKinley Carter Wealth Services, Inc. | 0 | −100,00 | 0 | |||||
| 2025-07-10 | 13F | Wealth Enhancement Advisory Services, Llc | 6 381 | 248 | ||||||
| 2025-07-22 | 13F | Belpointe Asset Management LLC | 9 038 | −3,83 | 350 | 10,76 | ||||
| 2025-08-14 | 13F | Mercer Global Advisors Inc /adv | 18 366 | −9,74 | 712 | 3,94 | ||||
| 2025-05-14 | 13F | Arizona PSPRS Trust | 0 | −100,00 | 0 | |||||
| 2025-07-17 | 13F | KWB Wealth | 21 872 | 737 | ||||||
| 2025-08-12 | 13F | Jpmorgan Chase & Co | 505 | 20 | ||||||
| 2025-08-13 | 13F | Northwestern Mutual Wealth Management Co | 175 225 | 29,34 | 6 793 | 48,90 | ||||
| 2025-08-26 | NP | EVAGX - The E-Valuator Aggressive Growth (85%-99%) RMS Fund Service Class Shares | 26 631 | −22,53 | 1 032 | −2,64 | ||||
| 2025-08-14 | 13F | Colony Group, LLC | 15 182 | 589 | ||||||
| 2025-08-07 | 13F | AllGen Financial Advisors, Inc. | 82 865 | −55,02 | 3 213 | −48,23 | ||||
| 2025-07-18 | 13F | BSW Wealth Partners | 0 | −100,00 | 0 | |||||
| 2025-08-19 | 13F | Asset Dedication, LLC | 1 687 | 18,22 | 65 | 35,42 | ||||
| 2025-07-25 | 13F | RHS Financial, LLC | 45 685 | −46,82 | 1 771 | −38,78 | ||||
| 2025-07-31 | 13F | Cambridge Investment Research Advisors, Inc. | 25 227 | −45,80 | 1 | −100,00 | ||||
| 2025-08-05 | 13F | Bank Of Montreal /can/ | 78 | 3 | ||||||
| 2025-08-14 | 13F | Raymond James Financial Inc | 58 561 | 2,09 | 2 270 | 17,49 | ||||
| 2025-08-05 | 13F | WorthPointe, LLC | 9 251 | 359 | ||||||
| 2025-07-17 | 13F | Janney Montgomery Scott LLC | 236 916 | −1,39 | 9 | 12,50 | ||||
| 2025-08-14 | 13F | Certified Advisory Corp | 30 948 | −12,06 | 1 200 | 1,18 | ||||
| 2025-08-06 | 13F | AE Wealth Management LLC | 90 | 0,00 | 3 | 0,00 | ||||
| 2025-07-16 | 13F | TCI Wealth Advisors, Inc. | 10 617 | −11,86 | 412 | 1,48 | ||||
| 2025-08-11 | 13F | Bell Investment Advisors, Inc | 115 893 | 23,10 | 4 493 | 41,74 | ||||
| 2025-05-02 | 13F | Parcion Private Wealth LLC | 0 | −100,00 | 0 | −100,00 | ||||
| 2025-08-26 | NP | EVGLX - The E-Valuator Growth (70%-85%) RMS Fund Service Class Shares | 20 624 | −54,66 | 800 | −43,05 | ||||
| 2025-08-04 | 13F | Arkadios Wealth Advisors | 10 798 | 20,49 | 419 | 38,87 | ||||
| 2025-08-26 | NP | EVCLX - The E-Valuator Conservative (15%-30%) RMS Fund Service Class Shares | 2 083 | −14,94 | 81 | 6,67 | ||||
| 2025-07-28 | 13F | Morris Financial Concepts, Inc. | 2 486 | −8,97 | 96 | 5,49 | ||||
| 2025-08-11 | 13F | Principal Securities, Inc. | 1 000 | 0,00 | 39 | 18,75 | ||||
| 2025-08-14 | 13F | Wells Fargo & Company/mn | 0 | −100,00 | 0 | |||||
| 2025-08-08 | 13F | Phoenix Wealth Advisors | 268 743 | 3,72 | 10 419 | 19,39 | ||||
| 2025-08-12 | 13F | Proequities, Inc. | 0 | 0 | ||||||
| 2025-07-24 | 13F | Comprehensive Money Management Services LLC | 5 188 | 201 | ||||||
| 2025-07-25 | 13F | Wealth Advisory Team LLC | 12 141 | 471 | ||||||
| 2025-08-11 | 13F | HighTower Advisors, LLC | 93 017 | 1,56 | 3 606 | 16,93 | ||||
| 2025-05-14 | 13F | Capital Analysts, Inc. | 0 | −100,00 | 0 | |||||
| 2025-07-16 | 13F | Signature Resources Capital Management, LLC | 917 | 0,00 | 36 | 16,67 | ||||
| 2025-08-14 | 13F | Bank Of America Corp /de/ | 46 167 | 0,74 | 1 790 | 15,94 | ||||
| 2025-07-14 | 13F | Sentinel Pension Advisors Inc | 8 403 | 5,51 | 326 | 21,27 | ||||
| 2025-08-14 | 13F | Great Valley Advisor Group, Inc. | 11 849 | −64,94 | 459 | −59,67 | ||||
| 2025-04-21 | 13F | LifeGoal Wealth Advisors | 0 | −100,00 | 0 | |||||
| 2025-07-14 | 13F | Narus Financial Partners, LLC | 11 194 | −4,08 | 434 | 10,18 | ||||
| 2025-08-14 | 13F | Ambassador Advisors, LLC | 9 324 | 22,01 | 361 | 40,47 | ||||
| 2025-08-11 | 13F | Aptus Capital Advisors, LLC | 12 141 | −89,24 | 471 | −87,64 | ||||
| 2025-08-12 | 13F | AlphaCore Capital LLC | 458 | 0,00 | 18 | 13,33 | ||||
| 2025-08-15 | 13F | Captrust Financial Advisors | 21 555 | −22,92 | 836 | −11,26 | ||||
| 2025-07-29 | 13F | Chicago Partners Investment Group LLC | 24 437 | 0,00 | 978 | 11,90 | ||||
| 2025-08-06 | 13F | First Horizon Advisors, Inc. | 149 | 0,00 | 6 | 0,00 | ||||
| 2025-07-22 | 13F | Merit Financial Group, LLC | 137 350 | 5 325 | ||||||
| 2025-08-15 | 13F | Equitable Holdings, Inc. | 26 090 | 1,57 | 1 012 | 16,88 | ||||
| 2025-07-28 | 13F | Harbour Investments, Inc. | 8 | 0,00 | 0 | |||||
| 2025-08-13 | 13F | Cerity Partners LLC | 103 647 | 1,34 | 4 018 | 16,67 | ||||
| 2025-07-15 | 13F | McAdam, LLC | 158 882 | 9,30 | 6 160 | 25,82 | ||||
| 2025-08-14 | 13F | Wiley Bros.-aintree Capital, Llc | 42 446 | −0,22 | 1 646 | 13,84 | ||||
| 2025-06-26 | NP | FGSM - Frontier Asset Global Small Cap Equity ETF | 294 918 | 7,86 | 10 467 | 16,29 | ||||
| 2025-07-29 | 13F | Systelligence, LLC | 68 158 | 2 642 | ||||||
| 2025-05-14 | 13F/A | Waddell & Associates, Llc | 0 | −100,00 | 0 | −100,00 | ||||
| 2025-07-21 | 13F | Fortis Capital Advisors, LLC | 9 038 | −3,83 | 350 | 10,76 | ||||
| 2025-08-01 | 13F | SYM FINANCIAL Corp | 2 111 | 9,49 | 82 | 26,56 | ||||
| 2025-08-14 | 13F | Fmr Llc | 731 | 61,37 | 28 | 86,67 | ||||
| 2025-08-14 | 13F | Stifel Financial Corp | 68 887 | −0,57 | 2 671 | 14,44 | ||||
| 2025-08-11 | 13F | TD Waterhouse Canada Inc. | 806 | 0,00 | 31 | 14,81 | ||||
| 2025-07-24 | 13F | Edge Financial Advisors LLC | 38 437 | 2,04 | 1 490 | 17,51 | ||||
| 2025-08-08 | 13F | Creative Planning | 8 537 | 331 | ||||||
| 2025-08-12 | 13F | J.w. Cole Advisors, Inc. | 21 495 | 833 | ||||||
| 2025-07-30 | 13F | Princeton Global Asset Management LLC | 130 | 0,00 | 5 | 25,00 | ||||
| 2025-08-14 | 13F | Citadel Advisors Llc | 0 | −100,00 | 0 | |||||
| 2025-07-10 | 13F | White Wing Wealth Management | 58 086 | −3,44 | 2 252 | 10,13 | ||||
| 2025-07-31 | 13F | Longview Financial Advisors, Inc. | 25 436 | −2,18 | 986 | 12,69 | ||||
| 2025-08-05 | 13F | Bank of New York Mellon Corp | 35 328 | −0,29 | 1 370 | 14,75 | ||||
| 2025-08-14 | 13F | Modern Wealth Management, LLC | 340 583 | −0,01 | 13 204 | 15,11 |