Grundläggande statistik
| Institutionella ägare | 173 total, 173 long only, 0 short only, 0 long/short - change of 7,45% MRQ |
| Genomsnittlig portföljallokering | 0.6711 % - change of −1,05% MRQ |
| Institutionella aktier (lång) | 59 990 784 (ex 13D/G) - change of 16,28MM shares 37,23% MRQ |
| Institutionellt värde (lång) | $ 1 996 220 USD ($1000) |
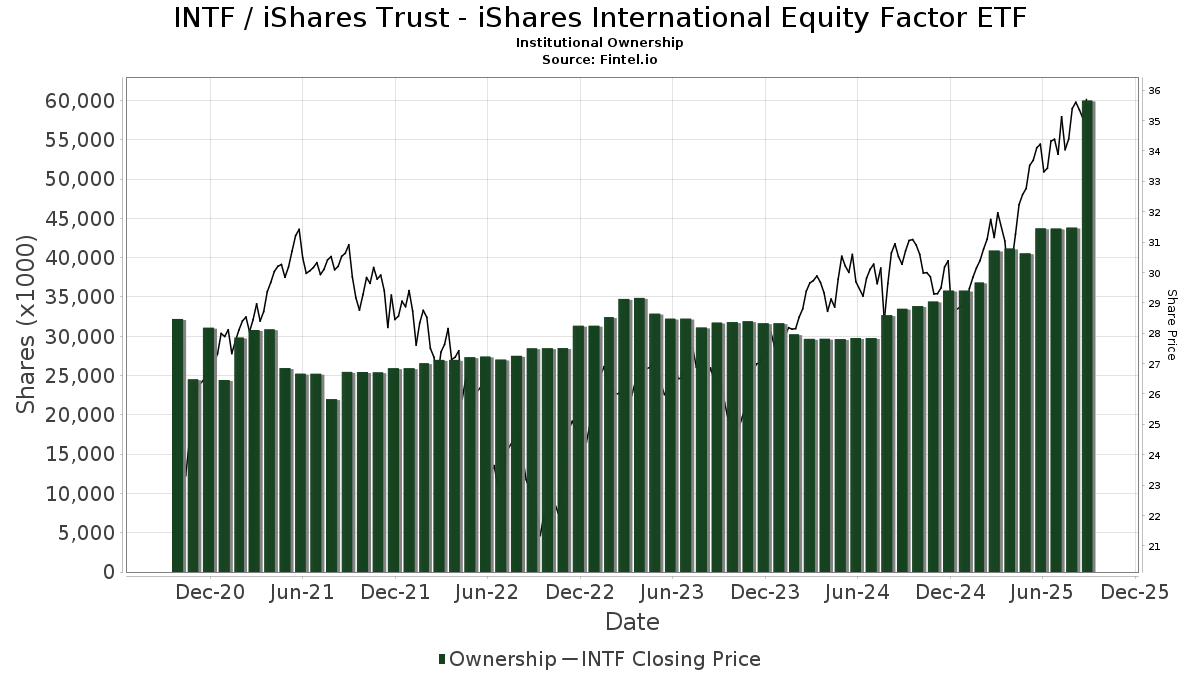
Institutionellt ägande och aktieägare
iShares Trust - iShares International Equity Factor ETF (US:INTF) har 173 Institutionella ägare och aktieägare som har lämnat in 13D/G- eller 13F-formulär till Securities Exchange Commission (SEC). Dessa institut innehar totalt 59,990,784 aktier. Största aktieägare inkluderar Northwestern Mutual Wealth Management Co, Strategic Financial Services, Inc,, Halbert Hargrove Global Advisors, Llc, Tolleson Wealth Management, Inc., Invesco Ltd., Clearwater Capital Advisors, LLC, Atomi Financial Group, Inc., Jpmorgan Chase & Co, Integrated Wealth Concepts LLC, and Kestra Investment Management, LLC .
iShares Trust - iShares International Equity Factor ETF (ARCA:INTF) Institutionell ägarstruktur visar institutioners och fonders nuvarande positioner i företaget, samt de senaste förändringarna i positionernas storlek. Större aktieägare kan vara enskilda investerare, fonder, hedgefonder eller institutioner. Bilaga 13D visar att investeraren äger (eller ägde) mer än 5% av företaget och avser (eller avsåg) att aktivt eftersträva en förändring av affärsstrategin. Schedule 13G indikerar en passiv investering på över 5%.
The share price as of September 8, 2025 is 35,80 / share. Previously, on September 9, 2024, the share price was 30,27 / share. This represents an increase of 18,25% over that period.
Fondsentimentets poäng
Fondsentimentet poängen(fka Ägarackumulation-poäng) visar vilka aktier som är mest köpta av fonder. Det är resultatet av en sofistikerad kvantitativ flerfaktormodell som identifierar företag med de högsta nivåerna av institutionell ackumulering. Poängsättningsmodellen använder en kombination av den totala ökningen av redovisade ägare, förändringarna i portföljallokeringarna för dessa ägare och andra mått. Siffran sträcker sig från 0 till 100, där högre siffror indikerar en högre nivå av ackumulering i förhållande till sina konkurrenter, och 50 är genomsnittet.
Uppdateringsfrekvens: Dagligen
Se Ownership Explorer, som innehåller en lista över de högst rankade företagen.
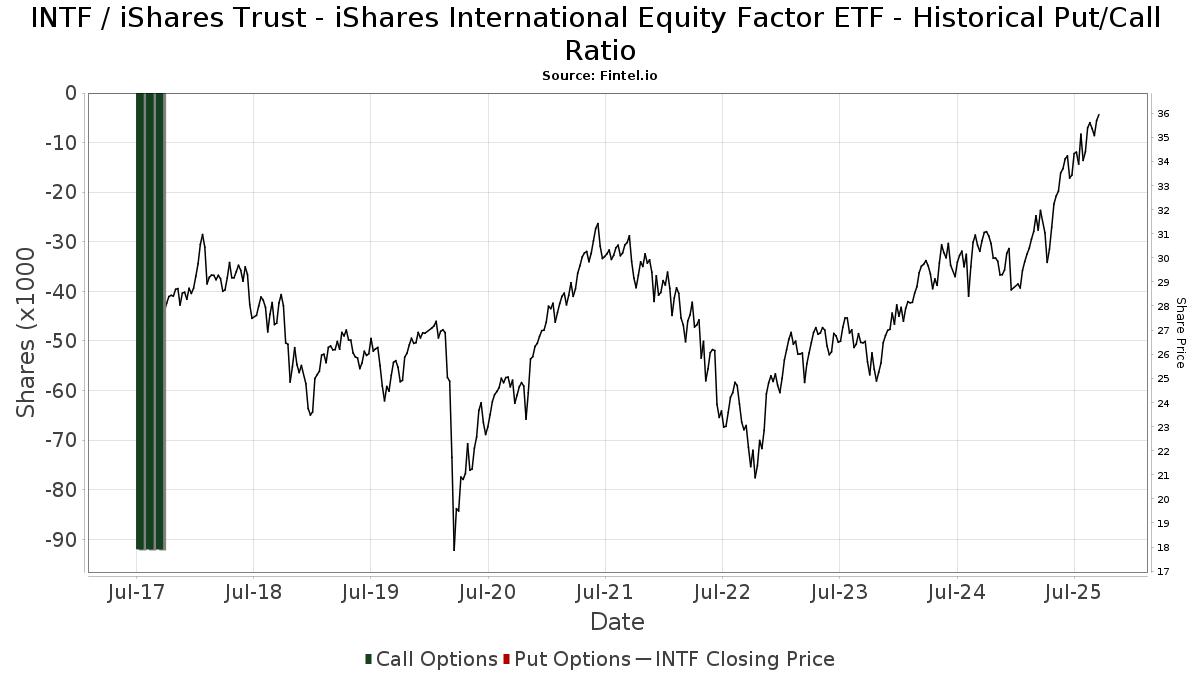
Institutionell sälj/köp-kvot
Förutom att rapportera vanliga eget kapital- och skuldemissioner måste institutioner med mer än 100MM tillgångar under förvaltning också avslöja sina innehav av sälj- och köpoptioner. Eftersom säljoptioner i allmänhet indikerar ett negativt sentiment och köpoptioner indikerar ett positivt sentiment, kan vi få en uppfattning om det övergripande institutionella sentimentet genom att plotta förhållandet mellan säljoptioner och köpoptioner. Diagrammet till höger visar det historiska förhållandet mellan sälj- och köpoptioner för detta instrument.
Genom att använda sälj/köp-kvoten som en indikator på aktieägarnas sentiment undviker man en av de största bristerna med att använda det totala institutionella ägandet, nämligen att en betydande del av de förvaltade tillgångarna investeras passivt för att följa index. Passivt förvaltade fonder köper vanligtvis inte optioner, så indikatorn för sälj/köp-kvoten ger en bättre bild av stämningen i aktivt förvaltade fonder.
13F- och NPORT-arkiveringar
Detaljer om 13F-arkiveringar är gratis. Detaljer om NP-arkiveringar kräver ett premiummedlemskap. Gröna rader indikerar nya positioner. Röda rader indikerar stängda positioner. Klicka på länk symbolen för att se hela transaktionshistoriken.
Uppgradera
för att låsa upp premiumdata och exportera till Excel ![]() .
.
| Fil Datum | Källa | Investerare | Typ | Genomsnittligt pris (beräknat) |
Aktier | Δ Aktier (%) |
Rapporterat värde (1000 USD) |
Δ Värde (%) |
Portföljallokering (%) |
|
|---|---|---|---|---|---|---|---|---|---|---|
| 2025-07-16 | 13F/A | CX Institutional | 7 469 | 1,69 | 0 | |||||
| 2025-08-13 | 13F | Beacon Pointe Advisors, LLC | 12 815 | 0,04 | 439 | 10,89 | ||||
| 2025-08-08 | 13F | Kingsview Wealth Management, LLC | 70 527 | −0,62 | 2 414 | 10,33 | ||||
| 2025-07-18 | 13F | SigFig Wealth Management, LLC | 123 649 | 3,95 | 4 225 | 14,22 | ||||
| 2025-05-07 | 13F | Horan Capital Advisors, LLC. | 6 642 | 205 | ||||||
| 2025-07-21 | 13F | HighMark Wealth Management LLC | 151 | 5 | ||||||
| 2025-04-21 | 13F | Nelson, Van Denburg & Campbell Wealth Management Group, LLC | 0 | −100,00 | 0 | −100,00 | ||||
| 2025-08-07 | 13F | Brio Consultants, LLC | 241 659 | 11,93 | 8 272 | 24,23 | ||||
| 2025-07-24 | 13F | Capital Advisors, Ltd. LLC | 13 268 | 0,23 | 0 | |||||
| 2025-08-14 | 13F | Operose Advisors LLC | 800 | 0,00 | 27 | 12,50 | ||||
| 2025-07-31 | 13F | AlTi Global, Inc. | 84 127 | −36,23 | 2 880 | −29,23 | ||||
| 2025-07-16 | 13F | New Insight Wealth Advisors | 19 982 | 41,93 | 684 | 57,37 | ||||
| 2025-08-14 | 13F | Mariner, LLC | 81 369 | 2,58 | 2 785 | 13,86 | ||||
| 2025-08-06 | 13F | North Capital, Inc. | 108 | 1,89 | 4 | 0,00 | ||||
| 2025-06-26 | NP | FINT - Frontier Asset Total International Equity ETF | 229 075 | −10,71 | 7 383 | −3,75 | ||||
| 2025-07-08 | 13F | RMR Wealth Builders | 9 874 | 338 | ||||||
| 2025-07-17 | 13F | LexAurum Advisors, LLC | 21 763 | −2,50 | 745 | 8,14 | ||||
| 2025-08-19 | 13F | Advisory Services Network, LLC | 6 000 | 203 | ||||||
| 2025-07-14 | 13F | U.S. Capital Wealth Advisors, LLC | 21 320 | 30,40 | 730 | 44,64 | ||||
| 2025-08-11 | 13F | Westover Capital Advisors, LLC | 0 | −100,00 | 0 | |||||
| 2025-08-13 | 13F | Cerity Partners LLC | 71 293 | −1,70 | 2 440 | 9,12 | ||||
| 2025-08-11 | 13F | Strategic Wealth Partners, Ltd. | 976 | 33 | ||||||
| 2025-08-12 | 13F | Blueprint Investment Partners LLC | 0 | −100,00 | 0 | |||||
| 2025-08-12 | 13F | Ascent Wealth Partners, LLC | 16 085 | 0,00 | 551 | 10,89 | ||||
| 2025-08-14 | 13F | Aqr Capital Management Llc | 36 543 | 19,66 | 1 251 | 32,84 | ||||
| 2025-08-01 | 13F | Strategic Financial Services, Inc, | 8 575 507 | −0,95 | 293 540 | 9,94 | ||||
| 2025-08-06 | 13F | AE Wealth Management LLC | 25 | 0,00 | 1 | |||||
| 2025-07-10 | 13F | Exchange Traded Concepts, Llc | 236 515 | −1,27 | 8 096 | 9,58 | ||||
| 2025-08-14 | 13F | Royal Bank Of Canada | 13 033 | 74,85 | 446 | 93,07 | ||||
| 2025-08-28 | 13F/A | Tolleson Wealth Management, Inc. | 2 851 077 | 4,34 | 97 592 | 15,81 | ||||
| 2025-05-14 | 13F | Van Hulzen Asset Management, LLC | 0 | −100,00 | 0 | −100,00 | ||||
| 2025-08-13 | 13F | Russell Investments Group, Ltd. | 831 | 28 | ||||||
| 2025-08-14 | 13F | Jane Street Group, Llc | 381 780 | 26,84 | 13 068 | 40,79 | ||||
| 2025-08-14 | 13F | Mml Investors Services, Llc | 12 246 | 1,44 | 0 | |||||
| 2025-08-07 | 13F | Vise Technologies, Inc. | 26 213 | 897 | ||||||
| 2025-08-07 | 13F | Weil Company, Inc. | 412 946 | 16,61 | 14 135 | 29,43 | ||||
| 2025-07-15 | 13F | EWG Elevate Inc. | 59 564 | 363,93 | 2 039 | 415,95 | ||||
| 2025-05-14 | 13F | CIBC Private Wealth Group, LLC | 0 | −100,00 | 0 | |||||
| 2025-07-08 | 13F | Baker Ellis Asset Management LLC | 27 800 | −9,74 | 952 | 0,21 | ||||
| 2025-08-13 | 13F | Summit Financial, LLC | 18 691 | −23,82 | 640 | −15,48 | ||||
| 2025-04-11 | 13F | Princeton Global Asset Management LLC | 0 | −100,00 | 0 | |||||
| 2025-08-14 | 13F | Susquehanna International Group, Llp | 76 066 | 63,18 | 2 604 | 81,14 | ||||
| 2025-08-14 | 13F | CIBC World Markets Inc. | 12 196 | 417 | ||||||
| 2025-08-07 | 13F | Allworth Financial LP | 2 020 | −6,09 | 69 | 1,47 | ||||
| 2025-08-14 | 13F | Atomi Financial Group, Inc. | 1 771 706 | 2,44 | 60 645 | 13,70 | ||||
| 2025-07-17 | 13F | HB Wealth Management, LLC | 14 015 | 63,54 | 480 | 81,44 | ||||
| 2025-08-14 | 13F | UBS Group AG | 441 395 | 1,91 | 15 109 | 13,11 | ||||
| 2025-08-14 | 13F | Diversify Advisory Services, LLC | 59 350 | 30,35 | 2 087 | 42,10 | ||||
| 2025-08-05 | 13F | Landmark Wealth Management, Inc. | 31 371 | 0,00 | 1 074 | 10,96 | ||||
| 2025-07-31 | 13F | Buckingham Strategic Partners | 6 051 | −7,79 | 207 | 2,48 | ||||
| 2025-08-06 | 13F | Commonwealth Equity Services, Llc | 91 289 | −8,20 | 3 | 0,00 | ||||
| 2025-07-10 | 13F | Orgel Wealth Management, LLC | 8 733 | 0,48 | 299 | 11,19 | ||||
| 2025-07-29 | 13F | Fundamentun, Llc | 61 760 | −3,27 | 2 114 | 7,42 | ||||
| 2025-08-15 | 13F | CI Private Wealth, LLC | 879 447 | −2,15 | 30 103 | 8,61 | ||||
| 2025-07-28 | 13F | ForthRight Wealth Management, LLC | 9 872 | 0,00 | 338 | 10,86 | ||||
| 2025-08-11 | 13F | Wealthspire Advisors, LLC | 13 158 | 0,91 | 450 | 11,94 | ||||
| 2025-08-14 | 13F | Qube Research & Technologies Ltd | 0 | −100,00 | 0 | |||||
| 2025-08-14 | 13F | Ameriprise Financial Inc | 1 059 484 | 61,24 | 36 264 | 78,96 | ||||
| 2025-08-14 | 13F/A | Rockefeller Capital Management L.P. | 65 252 | −1,58 | 2 234 | 9,25 | ||||
| 2025-08-12 | 13F | MAI Capital Management | 325 | 0,00 | 11 | 10,00 | ||||
| 2025-08-06 | 13F | HORAN Wealth, LLC | 6 642 | 227 | ||||||
| 2025-08-13 | 13F | Northwestern Mutual Wealth Management Co | 15 878 455 | 54 816,15 | 543 519 | 60 901,01 | ||||
| 2025-08-14 | 13F | Citadel Advisors Llc | 42 097 | 136,09 | 1 441 | 162,30 | ||||
| 2025-08-14 | 13F | Raymond James Financial Inc | 948 892 | −1,46 | 32 481 | 9,37 | ||||
| 2025-08-06 | 13F | DDFG, Inc | 226 977 | 1,97 | 7 769 | 13,18 | ||||
| 2025-07-31 | 13F | Cambridge Investment Research Advisors, Inc. | 88 910 | 31,82 | 3 | 50,00 | ||||
| 2025-08-13 | 13F | Flow Traders U.s. Llc | 0 | −100,00 | 0 | |||||
| 2025-08-14 | 13F | Colony Group, LLC | 123 915 | 65,82 | 4 242 | 84,07 | ||||
| 2025-08-14 | 13F | Mercer Global Advisors Inc /adv | 0 | −100,00 | 0 | |||||
| 2025-07-17 | 13F | Janney Montgomery Scott LLC | 18 765 | 0,00 | 1 | |||||
| 2025-07-24 | 13F | Us Bancorp \de\ | 3 977 | 0,00 | 136 | 11,48 | ||||
| 2025-08-04 | 13F | Atria Investments Llc | 101 440 | −8,11 | 3 472 | 2,00 | ||||
| 2025-07-17 | 13F | Halbert Hargrove Global Advisors, Llc | 3 195 954 | 0,44 | 109 397 | 11,47 | ||||
| 2025-08-05 | 13F | Meridian Management Co | 267 156 | −5,70 | 9 030 | 3,34 | ||||
| 2025-08-11 | 13F | HighTower Advisors, LLC | 273 723 | 5,08 | 9 370 | 16,63 | ||||
| 2025-04-16 | 13F | Smithbridge Asset Management Inc/de | 0 | −100,00 | 0 | −100,00 | ||||
| 2025-08-06 | 13F | Quadrant Private Wealth Management, LLC | 0 | −100,00 | 0 | |||||
| 2025-08-14 | 13F | Wells Fargo & Company/mn | 561 257 | −36,09 | 19 212 | −29,07 | ||||
| 2025-09-04 | 13F/A | Advisor Group Holdings, Inc. | 123 437 | 974,95 | 4 209 | 1 088,70 | ||||
| 2025-07-25 | 13F | Cwm, Llc | 851 829 | −6,62 | 29 | 3,57 | ||||
| 2025-07-25 | 13F | Hemington Wealth Management | 871 | 0,00 | 0 | |||||
| 2025-08-11 | 13F | Aptus Capital Advisors, LLC | 11 092 | 0,03 | 380 | 11,14 | ||||
| 2025-07-21 | 13F | Ameriflex Group, Inc. | 194 | 0,00 | 7 | 20,00 | ||||
| 2025-08-15 | 13F | Captrust Financial Advisors | 94 543 | 0,00 | 3 236 | 11,01 | ||||
| 2025-07-11 | 13F | Rockwood Wealth Management, LLC | 10 000 | 0,00 | 342 | 11,04 | ||||
| 2025-08-13 | 13F | Northern Trust Corp | 8 320 | 0,00 | 285 | 10,94 | ||||
| 2025-07-28 | 13F | Harbour Investments, Inc. | 30 | 1 | ||||||
| 2025-07-07 | 13F | Versant Capital Management, Inc | 4 452 | 0,00 | 152 | 10,95 | ||||
| 2025-07-24 | 13F | Blair William & Co/il | 125 | 0,00 | 4 | 33,33 | ||||
| 2025-08-18 | 13F/A | Kestra Investment Management, LLC | 1 237 354 | −45,98 | 42 355 | −40,04 | ||||
| 2025-04-23 | 13F | Mascagni Wealth Management, Inc. | 0 | −100,00 | 0 | −100,00 | ||||
| 2025-08-06 | 13F | Horan Securities, Inc. | 6 642 | 0,00 | 227 | 11,27 | ||||
| 2025-07-29 | 13F | Foster & Motley Inc | 410 664 | −11,87 | 14 | 0,00 | ||||
| 2025-07-25 | 13F | JustInvest LLC | 9 495 | −0,01 | 325 | 11,30 | ||||
| 2025-08-06 | 13F | Stokes Family Office, LLC | 807 176 | 41,47 | 27 630 | 57,03 | ||||
| 2025-08-12 | 13F | J.w. Cole Advisors, Inc. | 15 620 | 10,69 | 535 | 22,76 | ||||
| 2025-04-23 | 13F | Legacy Advisors, LLC | 0 | −100,00 | 0 | |||||
| 2025-08-01 | 13F | Envestnet Asset Management Inc | 1 055 237 | 8,29 | 36 121 | 20,20 | ||||
| 2025-05-12 | 13F | Independent Advisor Alliance | 0 | −100,00 | 0 | |||||
| 2025-08-12 | 13F | O'shaughnessy Asset Management, Llc | 7 005 | −14,27 | 240 | −4,78 | ||||
| 2025-08-14 | 13F | Obsido Oy | 259 933 | 1,66 | 8 898 | 12,83 | ||||
| 2025-08-14 | 13F | Ancora Advisors, LLC | 563 | 19 | ||||||
| 2025-07-10 | 13F | Sovran Advisors, LLC | 6 072 | 208 | ||||||
| 2025-08-15 | 13F | Morgan Stanley | 655 614 | −4,16 | 22 442 | 6,37 | ||||
| 2025-08-01 | 13F | First Command Advisory Services, Inc. | 760 428 | 3,89 | 26 029 | 15,03 | ||||
| 2025-08-14 | 13F | Smartleaf Asset Management LLC | 448 | −94,52 | 15 | −94,09 | ||||
| 2025-07-29 | 13F | Signature Estate & Investment Advisors Llc | 56 319 | −36,37 | 1 928 | −29,39 | ||||
| 2025-05-09 | 13F | Wade Financial Advisory, Inc | 318 745 | 9,44 | 9 830 | 17,53 | ||||
| 2025-08-06 | 13F | Savant Capital, LLC | 28 975 | −12,81 | 992 | −3,22 | ||||
| 2025-07-11 | 13F | Farther Finance Advisors, LLC | 203 335 | 8,57 | 6 960 | 20,25 | ||||
| 2025-08-13 | 13F | Avestar Capital, LLC | 145 907 | 28,85 | 4 994 | 43,01 | ||||
| 2025-07-10 | 13F | Wedmont Private Capital | 30 272 | 0,02 | 1 041 | 15,04 | ||||
| 2025-07-14 | 13F | Park Avenue Securities Llc | 9 570 | −0,57 | 0 | |||||
| 2025-07-14 | 13F | Seascape Capital Management | 13 851 | 2,37 | 0 | |||||
| 2025-07-21 | 13F | Pflug Koory, LLC | 500 | 0,00 | 17 | 13,33 | ||||
| 2025-08-12 | 13F | Clearwater Capital Advisors, LLC | 1 843 707 | −0,53 | 63 110 | 10,41 | ||||
| 2025-08-11 | 13F | Wescott Financial Advisory Group, LLC | 10 665 | −5,45 | 365 | 5,19 | ||||
| 2025-07-22 | 13F | Merit Financial Group, LLC | 15 104 | 1,68 | 517 | 12,88 | ||||
| 2025-08-27 | 13F | Stonebridge Wealth Management, LLC | 65 845 | 2 254 | ||||||
| 2025-08-14 | 13F | Financial Engines Advisors L.L.C. | 6 141 | 210 | ||||||
| 2025-08-08 | 13F | Cetera Investment Advisers | 11 238 | −21,93 | 385 | −13,32 | ||||
| 2025-08-12 | 13F | LPL Financial LLC | 250 523 | 179,48 | 8 575 | 210,24 | ||||
| 2025-07-10 | 13F | Sterling Financial Group, Inc. | 623 742 | 39,57 | 21 351 | 54,91 | ||||
| 2025-07-28 | 13F | Sagespring Wealth Partners, Llc | 148 756 | 19,17 | 5 092 | 32,27 | ||||
| 2025-08-12 | 13F | Proequities, Inc. | 0 | 0 | ||||||
| 2025-08-08 | 13F | Pnc Financial Services Group, Inc. | 1 466 | 0,00 | 50 | 11,11 | ||||
| 2025-08-11 | 13F | Citigroup Inc | 4 095 | 45,11 | 140 | 60,92 | ||||
| 2025-07-23 | 13F | Heck Capital Advisors, LLC | 59 956 | −42,41 | 2 052 | −36,07 | ||||
| 2025-08-08 | 13F | Avantax Advisory Services, Inc. | 19 799 | 0,09 | 678 | 10,98 | ||||
| 2025-08-14 | 13F | Wiley Bros.-aintree Capital, Llc | 10 817 | 0,00 | 370 | 10,12 | ||||
| 2025-08-07 | 13F | CENTRAL TRUST Co | 1 046 | 0,00 | 36 | 9,38 | ||||
| 2025-07-24 | 13F | IFP Advisors, Inc | 1 267 | 0,48 | 43 | 13,16 | ||||
| 2025-07-09 | 13F | Thrive Wealth Management, LLC | 341 743 | −6,75 | 11 698 | 3,49 | ||||
| 2025-08-14 | 13F | Integrated Wealth Concepts LLC | 1 344 337 | 11,10 | 46 017 | 23,31 | ||||
| 2025-07-18 | 13F | Bartlett & Co. Wealth Management Llc | 460 | −87,80 | 16 | −87,07 | ||||
| 2025-08-14 | 13F | Fmr Llc | 5 453 | 6,57 | 187 | 18,47 | ||||
| 2025-08-12 | 13F | Inscription Capital, LLC | 0 | −100,00 | 0 | |||||
| 2025-08-14 | 13F | Sunbelt Securities, Inc. | 197 | 0,00 | 6 | −16,67 | ||||
| 2025-08-13 | 13F | Summit Wealth Group Llc / Co | 13 052 | 447 | ||||||
| 2025-08-18 | 13F/A | National Bank Of Canada /fi/ | 5 964 | 0,00 | 204 | 11,48 | ||||
| 2025-08-13 | 13F | Colonial Trust Advisors | 520 | 0,00 | 18 | 6,25 | ||||
| 2025-08-13 | 13F | SageView Advisory Group, LLC | 8 228 | −0,66 | 282 | 10,59 | ||||
| 2025-07-09 | 13F | Archer Investment Management, LLC | 32 517 | −22,12 | 1 113 | −13,52 | ||||
| 2025-08-13 | 13F | Mount Yale Investment Advisors, LLC | 34 102 | 1 167 | ||||||
| 2025-07-31 | 13F | Cabot Wealth Management Inc | 56 430 | 1,28 | 1 932 | 12,40 | ||||
| 2025-08-27 | 13F | Barnes Wealth Management Group, Inc | 7 560 | −2,70 | 259 | 7,95 | ||||
| 2025-04-29 | 13F | Callan Capital, LLC | 749 022 | −2,67 | 23 100 | 4,52 | ||||
| 2025-08-05 | 13F | Dynasty Wealth Management, Llc | 108 416 | −12,15 | 3 711 | −2,47 | ||||
| 2025-08-19 | 13F | Newbridge Financial Services Group, Inc. | 27 544 | 943 | ||||||
| 2025-08-13 | 13F | GeoWealth Management, LLC | 10 847 | −13,29 | 371 | −3,64 | ||||
| 2025-08-07 | 13F | Parkside Financial Bank & Trust | 3 450 | 0,00 | 118 | 11,32 | ||||
| 2025-08-08 | 13F | Horizon Family Wealth, Inc. | 129 770 | 0,16 | 4 442 | 11,19 | ||||
| 2025-08-12 | 13F | Jpmorgan Chase & Co | 1 485 415 | 0,00 | 50 846 | 10,99 | ||||
| 2025-08-15 | 13F | Kestra Advisory Services, LLC | 90 606 | 1 085,32 | 3 101 | 1 219,57 | ||||
| 2025-07-10 | 13F | Wealth Enhancement Advisory Services, Llc | 7 206 | −39,28 | 247 | −32,51 | ||||
| 2025-08-13 | 13F | Invesco Ltd. | 2 520 000 | 0,00 | 86 260 | 10,99 | ||||
| 2025-04-10 | 13F | Retirement Planning Group | 0 | −100,00 | 0 | |||||
| 2025-08-14 | 13F | Modern Wealth Management, LLC | 750 747 | −2,90 | 25 698 | 7,78 | ||||
| 2025-04-22 | 13F/A | NorthRock Partners, LLC | 0 | −100,00 | 0 | −100,00 | ||||
| 2025-07-24 | 13F | GFG Capital, LLC | 0 | 0 | ||||||
| 2025-07-25 | 13F | RHS Financial, LLC | 120 956 | 22,83 | 4 140 | 36,36 | ||||
| 2025-08-05 | 13F | Magnolia Capital Advisors Llc | 45 591 | 26,35 | 1 561 | 40,29 | ||||
| 2025-07-31 | 13F | Sage Mountain Advisors LLC | 42 634 | 1,96 | 1 459 | 13,19 | ||||
| 2025-08-08 | 13F | Gts Securities Llc | 21 199 | 726 | ||||||
| 2025-08-14 | 13F | EP Wealth Advisors, Inc. | 7 248 | 0,01 | 248 | 11,21 | ||||
| 2025-08-14 | 13F | GWM Advisors LLC | 18 448 | −18,00 | 631 | −8,95 | ||||
| 2025-07-29 | 13F | Private Trust Co Na | 827 | 28 | ||||||
| 2025-08-11 | 13F | CFS Investment Advisory Services, LLC | 30 824 | −10,31 | 1 | 0,00 | ||||
| 2025-08-08 | 13F | Creative Planning | 70 731 | −0,94 | 2 421 | 9,95 | ||||
| 2025-07-30 | 13F | Phillips Financial Management, Llc | 318 396 | −19,45 | 10 899 | −10,61 | ||||
| 2025-08-11 | 13F | Principal Securities, Inc. | 37 914 | 5 129,52 | 1 298 | 6 385,00 | ||||
| 2025-08-06 | 13F | Mark Sheptoff Financial Planning, Llc | 35 | 0,00 | 1 | 0,00 | ||||
| 2025-08-04 | 13F | Beirne Wealth Consulting Services, LLC | 108 240 | 2,37 | 3 706 | 13,62 | ||||
| 2025-08-14 | 13F | Bank Of America Corp /de/ | 337 171 | 1,67 | 11 541 | 12,85 | ||||
| 2025-07-25 | 13F | Concord Wealth Partners | 0 | −100,00 | 0 | |||||
| 2025-08-05 | 13F | Sigma Planning Corp | 26 603 | 911 | ||||||
| 2025-07-23 | 13F | Armbruster Capital Management, Inc. | 32 775 | 39,02 | 1 122 | 54,20 | ||||
| 2025-07-16 | 13F | Signature Resources Capital Management, LLC | 1 576 | 0,00 | 54 | 10,42 | ||||
| 2025-08-06 | 13F | Stone House Investment Management, LLC | 1 069 | 37 | ||||||
| 2025-08-15 | 13F | Equitable Holdings, Inc. | 113 540 | 37,21 | 3 886 | 52,27 | ||||
| 2025-07-23 | 13F | Citizens National Bank Trust Department | 135 288 | −1,23 | 4 631 | 9,61 | ||||
| 2025-08-13 | 13F | Jones Financial Companies Lllp | 123 974 | 23,30 | 4 236 | 35,51 | ||||
| 2025-07-24 | 13F | Edge Financial Advisors LLC | 33 340 | −17,02 | 1 141 | −7,91 | ||||
| 2025-08-14 | 13F | Snowden Capital Advisors LLC | 9 982 | 0,00 | 342 | 11,07 | ||||
| 2025-07-14 | 13F | GAMMA Investing LLC | 1 006 | 0,00 | 34 | 9,68 | ||||
| 2025-08-04 | 13F | Assetmark, Inc | 101 | −95,58 | 3 | −95,71 | ||||
| 2025-07-09 | 13F | Lincoln Capital Corp | 46 920 | −2,50 | 1 606 | 8,22 | ||||
| 2025-07-14 | 13F | Acropolis Investment Management, LLC | 301 413 | 4,14 | 10 317 | 15,60 | ||||
| 2025-08-14 | 13F | 10Elms LLP | 2 069 | 0,00 | 71 | 11,11 | ||||
| 2025-08-08 | 13F | Capital Investment Advisory Services, LLC | 8 160 | −60,28 | 279 | −55,92 | ||||
| 2025-08-12 | 13F | Global Retirement Partners, LLC | 220 | 0,00 | 8 | 16,67 | ||||
| 2025-08-11 | 13F | Private Advisor Group, LLC | 6 395 | 219 | ||||||
| 2025-08-14 | 13F/A | Skopos Labs, Inc. | 395 | 14 |