Grundläggande statistik
| Institutionella ägare | 157 total, 157 long only, 0 short only, 0 long/short - change of 3,95% MRQ |
| Genomsnittlig portföljallokering | 0.2142 % - change of −1,22% MRQ |
| Institutionella aktier (lång) | 6 241 198 (ex 13D/G) - change of 0,66MM shares 11,91% MRQ |
| Institutionellt värde (lång) | $ 429 408 USD ($1000) |
Institutionellt ägande och aktieägare
iShares Trust - iShares Morningstar Mid-Cap Value ETF (US:IMCV) har 157 Institutionella ägare och aktieägare som har lämnat in 13D/G- eller 13F-formulär till Securities Exchange Commission (SEC). Dessa institut innehar totalt 6,241,198 aktier. Största aktieägare inkluderar Morgan Stanley, Raymond James Financial Inc, Equitable Holdings, Inc., Orgel Wealth Management, LLC, EQ ADVISORS TRUST - EQ/Mid Cap Value Managed Volatility Portfolio Class IB, Commonwealth Equity Services, Llc, Bank Of America Corp /de/, LPL Financial LLC, Advisor Group Holdings, Inc., and Wells Fargo & Company/mn .
iShares Trust - iShares Morningstar Mid-Cap Value ETF (NasdaqGM:IMCV) Institutionell ägarstruktur visar institutioners och fonders nuvarande positioner i företaget, samt de senaste förändringarna i positionernas storlek. Större aktieägare kan vara enskilda investerare, fonder, hedgefonder eller institutioner. Bilaga 13D visar att investeraren äger (eller ägde) mer än 5% av företaget och avser (eller avsåg) att aktivt eftersträva en förändring av affärsstrategin. Schedule 13G indikerar en passiv investering på över 5%.
The share price as of September 12, 2025 is 80,29 / share. Previously, on September 12, 2024, the share price was 74,47 / share. This represents an increase of 7,82% over that period.

Fondsentimentets poäng
Fondsentimentet poängen(fka Ägarackumulation-poäng) visar vilka aktier som är mest köpta av fonder. Det är resultatet av en sofistikerad kvantitativ flerfaktormodell som identifierar företag med de högsta nivåerna av institutionell ackumulering. Poängsättningsmodellen använder en kombination av den totala ökningen av redovisade ägare, förändringarna i portföljallokeringarna för dessa ägare och andra mått. Siffran sträcker sig från 0 till 100, där högre siffror indikerar en högre nivå av ackumulering i förhållande till sina konkurrenter, och 50 är genomsnittet.
Uppdateringsfrekvens: Dagligen
Se Ownership Explorer, som innehåller en lista över de högst rankade företagen.
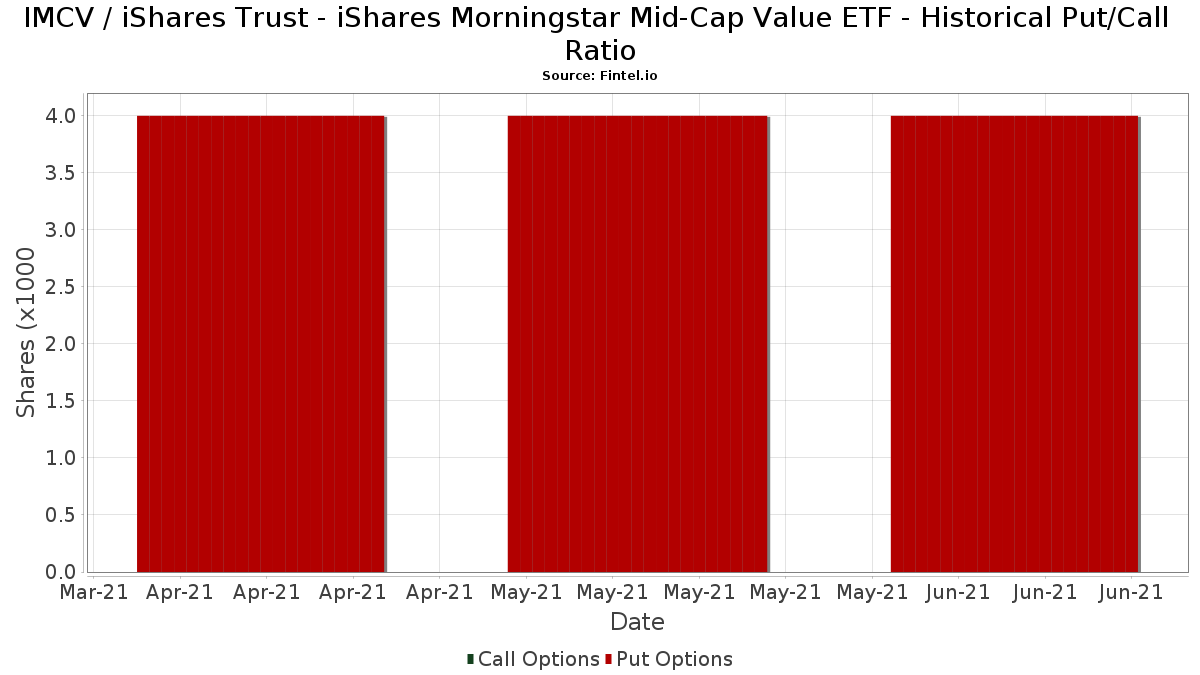
Institutionell sälj/köp-kvot
Förutom att rapportera vanliga eget kapital- och skuldemissioner måste institutioner med mer än 100MM tillgångar under förvaltning också avslöja sina innehav av sälj- och köpoptioner. Eftersom säljoptioner i allmänhet indikerar ett negativt sentiment och köpoptioner indikerar ett positivt sentiment, kan vi få en uppfattning om det övergripande institutionella sentimentet genom att plotta förhållandet mellan säljoptioner och köpoptioner. Diagrammet till höger visar det historiska förhållandet mellan sälj- och köpoptioner för detta instrument.
Genom att använda sälj/köp-kvoten som en indikator på aktieägarnas sentiment undviker man en av de största bristerna med att använda det totala institutionella ägandet, nämligen att en betydande del av de förvaltade tillgångarna investeras passivt för att följa index. Passivt förvaltade fonder köper vanligtvis inte optioner, så indikatorn för sälj/köp-kvoten ger en bättre bild av stämningen i aktivt förvaltade fonder.
13F- och NPORT-arkiveringar
Detaljer om 13F-arkiveringar är gratis. Detaljer om NP-arkiveringar kräver ett premiummedlemskap. Gröna rader indikerar nya positioner. Röda rader indikerar stängda positioner. Klicka på länk symbolen för att se hela transaktionshistoriken.
Uppgradera
för att låsa upp premiumdata och exportera till Excel ![]() .
.
| Fil Datum | Källa | Investerare | Typ | Genomsnittligt pris (beräknat) |
Aktier | Δ Aktier (%) |
Rapporterat värde (1000 USD) |
Δ Värde (%) |
Portföljallokering (%) |
|
|---|---|---|---|---|---|---|---|---|---|---|
| 2025-08-14 | 13F | Diversify Advisory Services, LLC | 16 776 | 10,05 | 1 308 | 19,67 | ||||
| 2025-08-04 | 13F | Creative Financial Designs Inc /adv | 154 | 0,65 | 12 | 0,00 | ||||
| 2025-05-05 | 13F | IFP Advisors, Inc | 0 | −100,00 | 0 | |||||
| 2025-07-11 | 13F | Pinnacle Bancorp, Inc. | 56 | 4 | ||||||
| 2025-08-11 | 13F | Citigroup Inc | 9 252 | 70,17 | 703 | 74,19 | ||||
| 2025-07-17 | 13F | Oakworth Capital, Inc. | 3 430 | 0,00 | 261 | 2,36 | ||||
| 2025-08-11 | 13F | Principal Securities, Inc. | 20 007 | 3 337,63 | 1 520 | 3 434,88 | ||||
| 2025-07-16 | 13F | New Insight Wealth Advisors | 3 392 | 0,00 | 258 | 2,39 | ||||
| 2025-08-12 | 13F | LPL Financial LLC | 218 922 | 28,72 | 16 634 | 31,82 | ||||
| 2025-08-14 | 13F | Operose Advisors LLC | 642 | 0,00 | 49 | 2,13 | ||||
| 2025-08-08 | 13F | Cetera Investment Advisers | 47 852 | 115,99 | 3 636 | 121,24 | ||||
| 2025-08-13 | 13F | Jones Financial Companies Lllp | 4 293 | 42,25 | 324 | 46,61 | ||||
| 2025-08-14 | 13F | UBS Group AG | 103 060 | 0,70 | 7 830 | 3,12 | ||||
| 2025-07-15 | 13F | Revisor Wealth Management LLC | 3 428 | −4,46 | 267 | 0,38 | ||||
| 2025-07-30 | 13F | Retirement Planning Group | 16 780 | −6,61 | 1 275 | −4,35 | ||||
| 2025-07-31 | 13F | Cambridge Investment Research Advisors, Inc. | 43 890 | 554,78 | 3 | |||||
| 2025-08-14 | 13F | Ancora Advisors, LLC | 66 | 0,00 | 5 | 25,00 | ||||
| 2025-07-30 | 13F | Black Diamond Financial, LLC | 110 769 | −12,17 | 8 416 | −10,05 | ||||
| 2025-07-22 | 13F | Marietta Wealth Management, LLC | 81 441 | 6,12 | 6 188 | 8,68 | ||||
| 2025-08-04 | 13F | Jim Saulnier & Associates, Llc | 26 375 | −5,88 | 2 004 | −3,61 | ||||
| 2025-08-14 | 13F | Stifel Financial Corp | 43 502 | 0,92 | 3 305 | 3,35 | ||||
| 2025-07-22 | 13F | Red Tortoise LLC | 2 | 0,00 | 0 | |||||
| 2025-07-08 | 13F | Parallel Advisors, LLC | 4 850 | 36,62 | 369 | 39,92 | ||||
| 2025-07-17 | 13F | Sound Income Strategies, LLC | 54 | 0,00 | 4 | 0,00 | ||||
| 2025-08-19 | 13F | Cape Investment Advisory, Inc. | 4 258 | 0,02 | 324 | 2,54 | ||||
| 2025-08-14 | 13F | First Manhattan Co | 7 438 | 0,00 | 565 | 2,54 | ||||
| 2025-08-11 | 13F | HighTower Advisors, LLC | 3 586 | 272 | ||||||
| 2025-08-01 | 13F | Gwn Securities Inc. | 4 092 | 11,77 | 312 | 14,76 | ||||
| 2025-07-21 | 13F | Ameritas Advisory Services, LLC | 768 | 58 | ||||||
| 2025-07-30 | 13F | D.a. Davidson & Co. | 3 197 | 243 | ||||||
| 2025-08-13 | 13F | Summit Financial, LLC | 3 028 | 0,50 | 230 | 3,14 | ||||
| 2025-08-13 | 13F | Level Four Advisory Services, Llc | 12 367 | 0,01 | 940 | 2,40 | ||||
| 2025-07-15 | 13F | James J. Burns & Company, LLC | 20 510 | 235,19 | 1 558 | 243,93 | ||||
| 2025-08-12 | 13F | Proequities, Inc. | 0 | 0 | ||||||
| 2025-08-14 | 13F | Guardian Wealth Advisors, Llc / Nc | 1 208 | −14,27 | 92 | −12,50 | ||||
| 2025-08-14 | 13F | Raymond James Financial Inc | 395 910 | 18,20 | 30 081 | 21,06 | ||||
| 2025-08-11 | 13F | Western Wealth Management, LLC | 2 801 | 0,04 | 213 | 2,42 | ||||
| 2025-08-13 | 13F | Jackson Creek Investment Advisors LLC | 9 460 | 1,21 | 1 | |||||
| 2025-08-14 | 13F | Colony Group, LLC | 24 892 | −19,50 | 1 891 | −17,57 | ||||
| 2025-07-25 | 13F | Courage Miller Partners, LLC | 20 296 | −1,36 | 1 542 | 1,05 | ||||
| 2025-08-14 | 13F | Vivaldi Capital Management, LLC | 26 647 | 18,00 | 2 025 | 20,84 | ||||
| 2025-08-08 | 13F | Pnc Financial Services Group, Inc. | 573 | −13,44 | 44 | −12,24 | ||||
| 2025-08-14 | 13F | Integrated Wealth Concepts LLC | 6 427 | 11,23 | 488 | 14,02 | ||||
| 2025-08-14 | 13F | Smartleaf Asset Management LLC | 2 317 | 18,82 | 175 | 23,24 | ||||
| 2025-08-14 | 13F | Clark Capital Management Group, Inc. | 90 046 | 6 842 | ||||||
| 2025-08-08 | 13F | Emerald Investment Partners, Llc | 36 | 3 | ||||||
| 2025-08-06 | 13F | Commonwealth Equity Services, Llc | 270 105 | 33,06 | 21 | 33,33 | ||||
| 2025-07-09 | 13F | Burt Wealth Advisors | 27 722 | 91,45 | 2 106 | 96,09 | ||||
| 2025-08-05 | 13F | Huntington National Bank | 0 | −100,00 | ||||||
| 2025-07-14 | 13F | Park Avenue Securities Llc | 13 272 | 1 | ||||||
| 2025-07-30 | 13F | Caliber Wealth Management, LLC / KS | 25 541 | −0,24 | 1 941 | 2,16 | ||||
| 2025-09-11 | 13F | Silicon Valley Capital Partners | 180 | 14 | ||||||
| 2025-07-14 | 13F | Armstrong Advisory Group, Inc | 0 | −100,00 | 0 | |||||
| 2025-08-07 | 13F | Summit Asset Management, LLC | 4 216 | −5,81 | 320 | −3,61 | ||||
| 2025-08-08 | 13F | Islay Capital Management, Llc | 30 | 0,00 | 2 | 0,00 | ||||
| 2025-07-17 | 13F | Gleason Group, Inc. | 266 | 0,76 | 20 | 5,26 | ||||
| 2025-07-21 | 13F | Crews Bank & Trust | 305 | 0,00 | 23 | 4,55 | ||||
| 2025-08-05 | 13F | Bank Of Montreal /can/ | 3 221 | 0,66 | 245 | 2,95 | ||||
| 2025-08-14 | 13F | Royal Bank Of Canada | 92 623 | 146,97 | 7 038 | 152,89 | ||||
| 2025-08-12 | 13F | Global Retirement Partners, LLC | 2 286 | 4 133,33 | 174 | 4 225,00 | ||||
| 2025-08-12 | 13F | Archer Investment Corp | 103 | 24,10 | 8 | 16,67 | ||||
| 2025-08-13 | 13F | Russell Investments Group, Ltd. | 71 | 0,00 | 5 | 0,00 | ||||
| 2025-08-15 | 13F | Equitable Holdings, Inc. | 390 168 | −1,65 | 29 645 | 0,72 | ||||
| 2025-08-04 | 13F | Flagship Harbor Advisors, Llc | 7 021 | 4,51 | 533 | 7,03 | ||||
| 2025-07-29 | 13F | Private Trust Co Na | 832 | 16,69 | 63 | 21,15 | ||||
| 2025-04-29 | 13F | Hm Payson & Co | 500 | −27,01 | 37 | −26,00 | ||||
| 2025-08-15 | 13F | Morgan Stanley | 679 807 | −5,22 | 51 652 | −2,94 | ||||
| 2025-08-12 | 13F | Jpmorgan Chase & Co | 18 151 | 95,87 | 1 379 | 100,73 | ||||
| 2025-08-14 | 13F | Financial Advisory Service, Inc. | 0 | −100,00 | 0 | |||||
| 2025-07-30 | 13F | Pacific Sun Financial Corp | 8 130 | −6,23 | 618 | −4,04 | ||||
| 2025-07-10 | 13F | Orgel Wealth Management, LLC | 359 977 | 5,71 | 27 351 | 8,27 | ||||
| 2025-07-24 | 13F | Us Bancorp \de\ | 505 | 0,00 | 38 | 2,70 | ||||
| 2025-08-08 | 13F | Creative Planning | 6 442 | 0,61 | 489 | 2,95 | ||||
| 2025-08-11 | 13F | Hopwood Financial Services, Inc. | 960 | 0,00 | 73 | 1,41 | ||||
| 2025-07-08 | 13F | Zrc Wealth Management, Llc | 254 | 0,79 | 19 | 5,56 | ||||
| 2025-08-14 | 13F | Comerica Bank | 13 501 | 1,06 | 1 026 | 3,43 | ||||
| 2025-07-14 | 13F | LaFleur & Godfrey LLC | 8 456 | 0,67 | 642 | 3,05 | ||||
| 2025-08-14 | 13F | Bank Of America Corp /de/ | 219 604 | 6,63 | 16 686 | 9,20 | ||||
| 2025-08-05 | 13F | GHP Investment Advisors, Inc. | 83 380 | −0,11 | 6 335 | 2,31 | ||||
| 2025-07-10 | 13F | Wealth Enhancement Advisory Services, Llc | 16 662 | −6,89 | 1 296 | −2,34 | ||||
| 2025-07-14 | 13F | Matrix Trust Co | 201 752 | 1,63 | 15 | 7,14 | ||||
| 2025-07-22 | 13F | Sage Financial Group Inc | 6 780 | −5,98 | 515 | −3,56 | ||||
| 2025-07-23 | 13F | Prime Capital Investment Advisors, LLC | 5 304 | 0,00 | 403 | 2,29 | ||||
| 2025-08-11 | 13F | Cornerstone Planning Group LLC | 15 | 1 | ||||||
| 2025-08-14 | 13F | Jane Street Group, Llc | 0 | −100,00 | 0 | |||||
| 2025-07-29 | 13F | Rodgers & Associates, LTD | 100 912 | 7,15 | 7 667 | 9,73 | ||||
| 2025-08-06 | 13F | Savant Capital, LLC | 5 592 | 2,57 | 425 | 4,95 | ||||
| 2025-07-28 | 13F | Harbour Investments, Inc. | 15 | 0,00 | 1 | 0,00 | ||||
| 2025-08-01 | 13F | Trust Investment Advisors | 2 795 | 0,18 | 212 | 2,91 | ||||
| 2025-07-29 | 13F | Madison Wealth Partners, Inc | 8 616 | 9,15 | 655 | 11,79 | ||||
| 2025-08-14 | 13F | Mml Investors Services, Llc | 42 420 | 25,51 | 3 | 50,00 | ||||
| 2025-07-29 | 13F | Woodard & Co Asset Management Group Inc /adv | 5 652 | −28,11 | 429 | −26,42 | ||||
| 2025-08-14 | 13F | Mariner, LLC | 58 333 | 4,63 | 4 432 | 7,16 | ||||
| 2025-08-15 | 13F | Tower Research Capital LLC (TRC) | 0 | −100,00 | 0 | |||||
| 2025-07-09 | 13F | Dynamic Advisor Solutions LLC | 25 742 | 1 956 | ||||||
| 2025-07-15 | 13F | MCF Advisors LLC | 300 | 0,00 | 23 | 0,00 | ||||
| 2025-08-11 | 13F | Aptus Capital Advisors, LLC | 1 208 | −14,27 | 92 | −12,50 | ||||
| 2025-08-06 | 13F | First Horizon Advisors, Inc. | 217 | 16 | ||||||
| 2025-07-22 | 13F | Merit Financial Group, LLC | 27 450 | 12,34 | 2 086 | 15,07 | ||||
| 2025-08-26 | NP | EQ ADVISORS TRUST - EQ/Mid Cap Value Managed Volatility Portfolio Class IB | 353 811 | −2,05 | 26 883 | 0,31 | ||||
| 2025-07-17 | 13F | Janney Montgomery Scott LLC | 5 370 | 0,00 | 0 | |||||
| 2025-07-25 | 13F | Cwm, Llc | 3 837 | −25,78 | 0 | |||||
| 2025-08-05 | 13F | Plante Moran Financial Advisors, LLC | 3 453 | 0,00 | 262 | 2,34 | ||||
| 2025-08-14 | 13F | McIlrath & Eck, LLC | 540 | 0,00 | 41 | 2,50 | ||||
| 2025-08-14 | 13F | Silvercrest Asset Management Group Llc | 2 706 | 0,00 | 206 | 2,50 | ||||
| 2025-08-13 | 13F | Cresset Asset Management, LLC | 2 745 | 0,00 | 209 | 2,46 | ||||
| 2025-08-14 | 13F | Lebenthal Global Advisors, LLC | 55 748 | 0,66 | 4 236 | 3,09 | ||||
| 2025-08-07 | 13F | Kestra Private Wealth Services, Llc | 3 796 | −15,10 | 288 | −12,99 | ||||
| 2025-08-12 | 13F | Bedel Financial Consulting, Inc. | 75 666 | 1,15 | 5 749 | 6,76 | ||||
| 2025-08-14 | 13F | Citadel Advisors Llc | 0 | −100,00 | 0 | |||||
| 2025-07-30 | 13F | Bogart Wealth, LLC | 464 | 0,22 | 35 | 2,94 | ||||
| 2025-08-12 | 13F | Trivant Custom Portfolio Group, LLC | 5 687 | 13,72 | 432 | 16,44 | ||||
| 2025-07-10 | 13F | Sovran Advisors, LLC | 24 024 | 1 858 | ||||||
| 2025-08-06 | 13F | AE Wealth Management LLC | 0 | −100,00 | 0 | |||||
| 2025-08-05 | 13F | swisspartners Advisors Ltd | 111 620 | 3,25 | 8 471 | 19,43 | ||||
| 2025-08-12 | 13F | O'shaughnessy Asset Management, Llc | 439 | 0,00 | 33 | 3,13 | ||||
| 2025-08-13 | 13F | Northwestern Mutual Wealth Management Co | 50 321 | −1,68 | 3 823 | 0,68 | ||||
| 2025-07-14 | 13F | AdvisorNet Financial, Inc | 155 | 0,00 | 12 | 0,00 | ||||
| 2025-07-22 | 13F | Steele Capital Management, Inc. | 201 752 | 1,63 | 15 329 | 4,09 | ||||
| 2025-08-06 | 13F | DDFG, Inc | 31 915 | 6,26 | 2 425 | 8,80 | ||||
| 2025-08-08 | 13F | TD Capital Management LLC | 202 | 0,50 | 15 | 7,14 | ||||
| 2025-07-17 | 13F | Beacon Capital Management, LLC | 1 404 | 0,00 | 107 | 1,92 | ||||
| 2025-08-08 | 13F | Avantax Advisory Services, Inc. | 60 956 | 4,77 | 4 631 | 7,30 | ||||
| 2025-08-12 | 13F | Ameritas Investment Partners, Inc. | 115 | 0,00 | 9 | 0,00 | ||||
| 2025-08-15 | 13F | Kestra Advisory Services, LLC | 7 562 | 37,72 | 575 | 41,03 | ||||
| 2025-08-01 | 13F | Envestnet Asset Management Inc | 123 020 | 335,19 | 9 347 | 345,73 | ||||
| 2025-08-14 | 13F | GWM Advisors LLC | 945 | 0,53 | 72 | 2,90 | ||||
| 2025-08-14 | 13F | Wells Fargo & Company/mn | 212 788 | 27,26 | 16 168 | 30,33 | ||||
| 2025-08-01 | 13F | Transcend Wealth Collective, Llc | 2 803 | 0,00 | 213 | 2,42 | ||||
| 2025-08-07 | 13F | Cahill Financial Advisors Inc | 4 325 | 0,58 | 329 | 3,14 | ||||
| 2025-08-14 | 13F | Ameriprise Financial Inc | 66 651 | 1,94 | 5 068 | 4,32 | ||||
| 2025-08-12 | 13F | WealthTrak Capital Management LLC | 4 104 | 2,47 | 312 | 4,71 | ||||
| 2025-07-14 | 13F | Signature Securities Group Corporation | 23 119 | −15,61 | 1 757 | −13,58 | ||||
| 2025-08-05 | 13F | Tiaa Trust, National Association | 3 098 | 0,00 | 235 | 2,62 | ||||
| 2025-08-12 | 13F | Steward Partners Investment Advisory, Llc | 13 | 0,00 | 1 | |||||
| 2025-07-29 | 13F | Aire Advisors, Llc | 40 696 | 9,20 | 3 092 | 11,87 | ||||
| 2025-07-29 | 13F | Salomon & Ludwin, LLC | 162 | 0,00 | 13 | 0,00 | ||||
| 2025-07-25 | 13F | Atria Wealth Solutions, Inc. | 25 407 | −6,20 | 1 930 | −3,93 | ||||
| 2025-08-04 | 13F | Assetmark, Inc | 482 | 20,20 | 37 | 24,14 | ||||
| 2025-08-13 | 13F | Baird Financial Group, Inc. | 17 237 | 21,14 | 1 310 | 24,08 | ||||
| 2025-08-14 | 13F | Quantinno Capital Management LP | 0 | −100,00 | 0 | |||||
| 2025-07-21 | 13F | Ameriflex Group, Inc. | 417 | 0,00 | 31 | 3,33 | ||||
| 2025-08-15 | 13F | Captrust Financial Advisors | 12 311 | −10,60 | 935 | −8,42 | ||||
| 2025-08-18 | 13F | Geneos Wealth Management Inc. | 5 394 | 98,60 | 410 | 103,48 | ||||
| 2025-08-08 | 13F | Bouchey Financial Group Ltd | 2 808 | 0,00 | 213 | 2,40 | ||||
| 2025-08-14 | 13F | EP Wealth Advisors, Inc. | 43 166 | 0,00 | 3 280 | 2,40 | ||||
| 2025-08-12 | 13F | J.w. Cole Advisors, Inc. | 5 656 | 430 | ||||||
| 2025-08-14 | 13F | Susquehanna International Group, Llp | 7 643 | −78,00 | 581 | −77,49 | ||||
| 2025-08-08 | 13F | Altfest L J & Co Inc | 3 601 | −50,87 | 274 | −49,72 | ||||
| 2025-07-08 | 13F | Nbc Securities, Inc. | 300 | 0,00 | 0 | |||||
| 2025-08-01 | 13F | PCA Investment Advisory Services Inc. | 13 988 | 0,16 | 1 063 | 2,51 | ||||
| 2025-08-18 | 13F | N.E.W. Advisory Services LLC | 0 | −100,00 | 0 | |||||
| 2025-08-13 | 13F | M&t Bank Corp | 13 727 | −3,74 | 1 043 | −1,42 | ||||
| 2025-08-13 | 13F | Willis Johnson & Associates, Inc. | 4 529 | 0,00 | 344 | 2,38 | ||||
| 2025-08-15 | 13F | CI Private Wealth, LLC | 18 300 | −3,93 | 1 390 | −1,63 | ||||
| 2025-07-29 | NP | EBI - Longview Advantage ETF | 0 | −100,00 | 0 | −100,00 | ||||
| 2025-09-04 | 13F/A | Advisor Group Holdings, Inc. | 218 051 | 4,97 | 16 567 | 7,49 | ||||
| 2025-08-13 | 13F | Millstone Evans Group, LLC | 38 783 | −3,07 | 2 947 | −0,74 | ||||
| 2025-07-22 | 13F | DAVENPORT & Co LLC | 52 522 | 78,58 | 3 991 | 82,94 | ||||
| 2025-08-11 | 13F | Private Advisor Group, LLC | 4 984 | 379 | ||||||
| 2025-08-06 | 13F | Ipsen Advisor Group LLC | 82 303 | 2,75 | 6 253 | 5,23 | ||||
| 2025-07-30 | 13F | Atlantic Edge Private Wealth Management, LLC | 0 | −100,00 | 0 | |||||
| 2025-08-04 | 13F | Clear Investment Research, Llc | 2 012 | 0,20 | 153 | 2,01 | ||||
| 2025-08-12 | 13F | BlackRock, Inc. | 1 500 | 0,00 | 114 | 1,80 | ||||
| 2025-07-25 | 13F | LRI Investments, LLC | 22 656 | 0,00 | 1 721 | 2,44 | ||||
| 2025-07-09 | 13F | Beacon Financial Group | 2 836 | 0,18 | 215 | 2,38 | ||||
| 2025-07-24 | 13F | rebel Financial LLC | 4 342 | 330 | ||||||
| 2025-08-14 | 13F | Fmr Llc | 3 405 | −15,26 | 259 | −13,42 | ||||
| 2025-07-29 | 13F | Gladwyn Financial Advisors, Inc. | 72 | 5 | ||||||
| 2025-08-07 | 13F | Parkside Financial Bank & Trust | 510 | 0,00 | 39 | 2,70 |