Grundläggande statistik
| Institutionella ägare | 175 total, 175 long only, 0 short only, 0 long/short - change of 0,00% MRQ |
| Genomsnittlig portföljallokering | 0.1313 % - change of −69,20% MRQ |
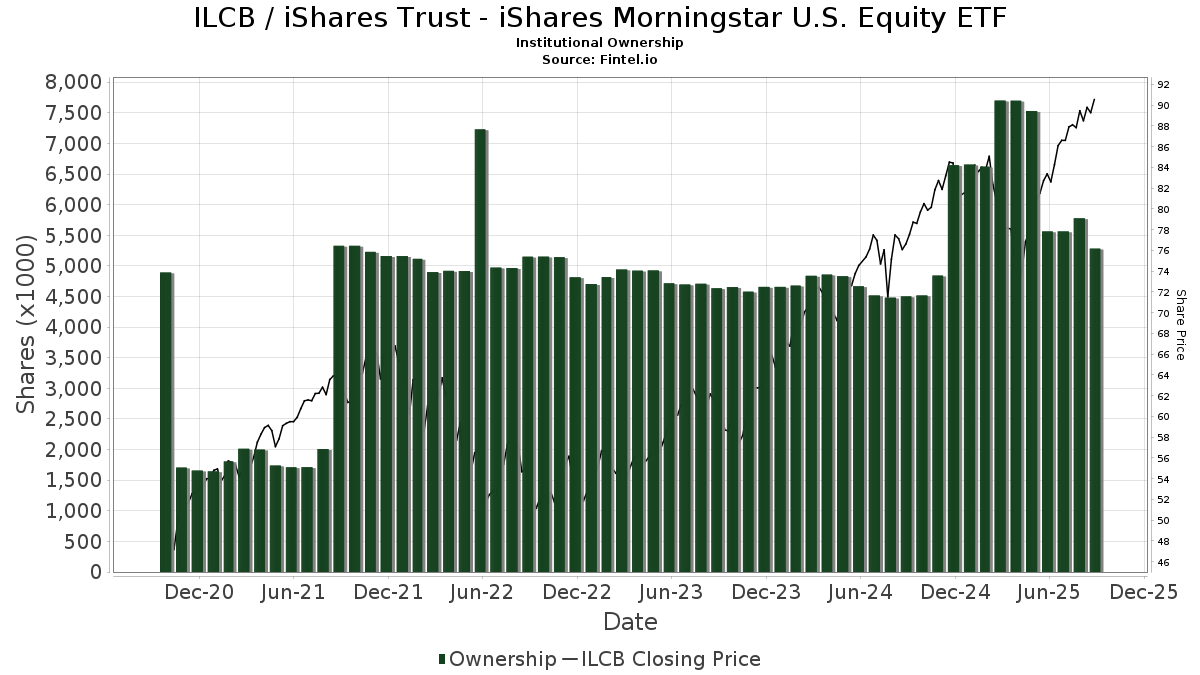
| Institutionella aktier (lång) | 5 282 608 (ex 13D/G) - change of −0,28MM shares −5,05% MRQ |
| Institutionellt värde (lång) | $ 431 066 USD ($1000) |
Institutionellt ägande och aktieägare
iShares Trust - iShares Morningstar U.S. Equity ETF (US:ILCB) har 175 Institutionella ägare och aktieägare som har lämnat in 13D/G- eller 13F-formulär till Securities Exchange Commission (SEC). Dessa institut innehar totalt 5,282,608 aktier. Största aktieägare inkluderar Morgan Stanley, Ameriprise Financial Inc, Equitable Holdings, Inc., EQ ADVISORS TRUST - EQ/Large Cap Core Managed Volatility Portfolio Class IB, Exchange Traded Concepts, Llc, Advisor Group Holdings, Inc., LPL Financial LLC, Wealth Enhancement Advisory Services, Llc, Avantax Advisory Services, Inc., and Commonwealth Equity Services, Llc .
iShares Trust - iShares Morningstar U.S. Equity ETF (ARCA:ILCB) Institutionell ägarstruktur visar institutioners och fonders nuvarande positioner i företaget, samt de senaste förändringarna i positionernas storlek. Större aktieägare kan vara enskilda investerare, fonder, hedgefonder eller institutioner. Bilaga 13D visar att investeraren äger (eller ägde) mer än 5% av företaget och avser (eller avsåg) att aktivt eftersträva en förändring av affärsstrategin. Schedule 13G indikerar en passiv investering på över 5%.
The share price as of September 11, 2025 is 91,30 / share. Previously, on September 12, 2024, the share price was 77,13 / share. This represents an increase of 18,37% over that period.
Fondsentimentets poäng
Fondsentimentet poängen(fka Ägarackumulation-poäng) visar vilka aktier som är mest köpta av fonder. Det är resultatet av en sofistikerad kvantitativ flerfaktormodell som identifierar företag med de högsta nivåerna av institutionell ackumulering. Poängsättningsmodellen använder en kombination av den totala ökningen av redovisade ägare, förändringarna i portföljallokeringarna för dessa ägare och andra mått. Siffran sträcker sig från 0 till 100, där högre siffror indikerar en högre nivå av ackumulering i förhållande till sina konkurrenter, och 50 är genomsnittet.
Uppdateringsfrekvens: Dagligen
Se Ownership Explorer, som innehåller en lista över de högst rankade företagen.
Institutionell sälj/köp-kvot
Förutom att rapportera vanliga eget kapital- och skuldemissioner måste institutioner med mer än 100MM tillgångar under förvaltning också avslöja sina innehav av sälj- och köpoptioner. Eftersom säljoptioner i allmänhet indikerar ett negativt sentiment och köpoptioner indikerar ett positivt sentiment, kan vi få en uppfattning om det övergripande institutionella sentimentet genom att plotta förhållandet mellan säljoptioner och köpoptioner. Diagrammet till höger visar det historiska förhållandet mellan sälj- och köpoptioner för detta instrument.
Genom att använda sälj/köp-kvoten som en indikator på aktieägarnas sentiment undviker man en av de största bristerna med att använda det totala institutionella ägandet, nämligen att en betydande del av de förvaltade tillgångarna investeras passivt för att följa index. Passivt förvaltade fonder köper vanligtvis inte optioner, så indikatorn för sälj/köp-kvoten ger en bättre bild av stämningen i aktivt förvaltade fonder.
13F- och NPORT-arkiveringar
Detaljer om 13F-arkiveringar är gratis. Detaljer om NP-arkiveringar kräver ett premiummedlemskap. Gröna rader indikerar nya positioner. Röda rader indikerar stängda positioner. Klicka på länk symbolen för att se hela transaktionshistoriken.
Uppgradera
för att låsa upp premiumdata och exportera till Excel ![]() .
.
| Fil Datum | Källa | Investerare | Typ | Genomsnittligt pris (beräknat) |
Aktier | Δ Aktier (%) |
Rapporterat värde (1000 USD) |
Δ Värde (%) |
Portföljallokering (%) |
|
|---|---|---|---|---|---|---|---|---|---|---|
| 2025-09-04 | 13F/A | Advisor Group Holdings, Inc. | 269 313 | 5,93 | 23 098 | 17,58 | ||||
| 2025-07-29 | 13F | Elevation Capital Advisory, LLC | 82 157 | −6,69 | 7 047 | 3,60 | ||||
| 2025-08-12 | 13F | Coston, McIsaac & Partners | 614 | 0,33 | 0 | |||||
| 2025-08-14 | 13F | Money Concepts Capital Corp | 16 922 | −1,06 | 1 452 | 9,84 | ||||
| 2025-08-14 | 13F | Qube Research & Technologies Ltd | 0 | −100,00 | 0 | |||||
| 2025-08-13 | 13F | M&t Bank Corp | 6 595 | 44,95 | 566 | 60,97 | ||||
| 2025-08-14 | 13F | Ameriprise Financial Inc | 494 207 | 3,56 | 42 417 | 15,05 | ||||
| 2025-08-14 | 13F | UBS Group AG | 104 844 | −6,79 | 8 994 | 3,49 | ||||
| 2025-08-13 | 13F | Capital Analysts, Inc. | 485 | 0,21 | 0 | |||||
| 2025-08-14 | 13F | Diversify Advisory Services, LLC | 3 252 | −0,09 | 290 | 16,06 | ||||
| 2025-08-18 | 13F | Geneos Wealth Management Inc. | 2 415 | −24,72 | 207 | −16,19 | ||||
| 2025-07-15 | 13F | Evanson Asset Management, LLC | 2 500 | 214 | ||||||
| 2025-08-14 | 13F | Goldman Sachs Group Inc | 81 612 | 76,97 | 7 001 | 96,52 | ||||
| 2025-08-11 | 13F | HHM Wealth Advisors, LLC | 2 000 | 0,00 | 172 | 11,04 | ||||
| 2025-08-08 | 13F | Good Life Advisors, LLC | 6 541 | 0,05 | 561 | 11,09 | ||||
| 2025-07-17 | 13F | Janney Montgomery Scott LLC | 0 | −100,00 | 0 | |||||
| 2025-08-26 | NP | EQ ADVISORS TRUST - EQ/Large Cap Core Managed Volatility Portfolio Class IB | 348 108 | 0,00 | 29 861 | 11,03 | ||||
| 2025-07-10 | 13F | Rockland Trust Co | 9 895 | 0,00 | 849 | 10,99 | ||||
| 2025-07-22 | 13F | Siligmueller & Norvid Wealth Advisors LLC | 9 844 | 0,00 | 852 | 12,11 | ||||
| 2025-08-14 | 13F | Ancora Advisors, LLC | 136 | 0,00 | 12 | 10,00 | ||||
| 2025-05-15 | 13F | Prospera Financial Services Inc | 0 | −100,00 | 0 | |||||
| 2025-08-07 | 13F | Resources Investment Advisors, LLC. | 15 638 | 0,16 | 1 341 | 11,19 | ||||
| 2025-08-11 | 13F | Landaas & Co /wi /adv | 4 379 | −1,20 | 376 | 9,94 | ||||
| 2025-08-05 | 13F | GPS Wealth Strategies Group, LLC | 115 | 0,00 | 10 | 12,50 | ||||
| 2025-08-12 | 13F | Gladstone Institutional Advisory LLC | 87 228 | −0,42 | 7 482 | 10,57 | ||||
| 2025-05-28 | 13F | Intrua Financial, LLC | 0 | −100,00 | 0 | −100,00 | ||||
| 2025-07-10 | 13F | Wealth Enhancement Advisory Services, Llc | 166 562 | −7,19 | 14 448 | 4,20 | ||||
| 2025-08-11 | 13F | NewEdge Wealth, LLC | 7 265 | −0,71 | 638 | 12,74 | ||||
| 2025-08-12 | 13F | Proequities, Inc. | 0 | 0 | ||||||
| 2025-05-08 | 13F | Natixis Advisors, L.p. | 0 | −100,00 | 0 | |||||
| 2025-07-22 | 13F | Olistico Wealth, LLC | 516 | 0,00 | 44 | 12,82 | ||||
| 2025-07-08 | 13F | Richard P Slaughter Associates Inc | 5 056 | 0,00 | 434 | 11,03 | ||||
| 2025-07-24 | 13F | Us Bancorp \de\ | 461 | 0,00 | 40 | 11,43 | ||||
| 2025-07-10 | 13F | Exchange Traded Concepts, Llc | 272 912 | 23 410 | ||||||
| 2025-08-14 | 13F | Jane Street Group, Llc | 0 | −100,00 | 0 | |||||
| 2025-08-14 | 13F | Mml Investors Services, Llc | 24 363 | −11,08 | 2 | 0,00 | ||||
| 2025-07-28 | 13F | Harbour Investments, Inc. | 2 289 | −4,90 | 196 | 5,95 | ||||
| 2025-05-09 | 13F | Avalon Trust Co | 0 | −100,00 | 0 | |||||
| 2025-08-19 | 13F | National Asset Management, Inc. | 0 | −100,00 | 0 | |||||
| 2025-08-06 | 13F | AE Wealth Management LLC | 438 | −7,40 | 38 | 2,78 | ||||
| 2025-08-11 | 13F | Aptus Capital Advisors, LLC | 371 | 0,27 | 32 | 10,71 | ||||
| 2025-08-06 | 13F | Vantage Financial Partners, LLC | 7 339 | −3,41 | 630 | 7,16 | ||||
| 2025-07-25 | 13F | Commonwealth Financial Services, LLC | 16 356 | 11,67 | 1 403 | 24,05 | ||||
| 2025-08-12 | 13F | Choate Investment Advisors | 5 739 | 0,00 | 492 | 11,06 | ||||
| 2025-08-07 | 13F | Allworth Financial LP | 1 426 | 122 | ||||||
| 2025-07-29 | 13F | Portland Financial Advisors Inc | 3 974 | 0,00 | 341 | 10,75 | ||||
| 2025-08-15 | 13F | Asset Allocation Strategies LLC | 3 920 | 0,28 | 336 | 11,26 | ||||
| 2025-08-12 | 13F | Archer Investment Corp | 316 | 0,00 | 27 | 12,50 | ||||
| 2025-08-13 | 13F | Russell Investments Group, Ltd. | 360 | −8,63 | 31 | 0,00 | ||||
| 2025-08-14 | 13F | Royal Bank Of Canada | 42 348 | −11,17 | 3 633 | −1,36 | ||||
| 2025-07-25 | 13F | Envestnet Portfolio Solutions, Inc. | 2 630 | −18,60 | 226 | −9,64 | ||||
| 2025-08-05 | 13F | MidAtlantic Capital Management, Inc. | 3 667 | −6,09 | 315 | 4,32 | ||||
| 2025-08-06 | 13F | Commonwealth Equity Services, Llc | 139 146 | −0,85 | 12 | 10,00 | ||||
| 2025-08-14 | 13F | Stifel Financial Corp | 5 848 | 3,18 | 502 | 14,65 | ||||
| 2025-08-05 | 13F | Westside Investment Management, Inc. | 226 | 0,44 | 19 | 11,76 | ||||
| 2025-08-26 | NP | EQ ADVISORS TRUST - EQ/Large Cap Value Managed Volatility Portfolio Class IB | 5 416 | 0,00 | 465 | 11,00 | ||||
| 2025-07-07 | 13F | Thurston, Springer, Miller, Herd & Titak, Inc. | 1 877 | 25,47 | 161 | 40,00 | ||||
| 2025-08-04 | 13F | Wealth Management Associates, Inc. | 12 630 | −0,54 | 1 083 | 10,40 | ||||
| 2025-05-15 | 13F | Old Mission Capital Llc | 0 | −100,00 | 0 | |||||
| 2025-05-14 | 13F | TD Capital Management LLC | 0 | −100,00 | 0 | |||||
| 2025-08-14 | 13F | Bank Of America Corp /de/ | 109 584 | 1,39 | 9 400 | 12,57 | ||||
| 2025-08-05 | 13F | Crestwood Advisors Group LLC | 42 927 | −0,34 | 3 682 | 10,67 | ||||
| 2025-08-12 | 13F | MAI Capital Management | 80 | 0,00 | 7 | 0,00 | ||||
| 2025-08-11 | 13F | Greykasell Wealth Strategies, Inc. | 10 858 | −53,51 | 931 | −48,39 | ||||
| 2025-08-12 | 13F | Cornerstone Wealth Management, LLC | 3 270 | 0,00 | 281 | 11,11 | ||||
| 2025-07-02 | 13F | Dentgroup LLC | 14 242 | −0,62 | 1 222 | 10,30 | ||||
| 2025-07-11 | 13F | SILVER OAK SECURITIES, Inc | 4 310 | −14,21 | 370 | −4,40 | ||||
| 2025-07-22 | 13F | Red Tortoise LLC | 7 315 | 0,00 | 627 | 10,97 | ||||
| 2025-07-30 | 13F | Financial Perspectives, Inc | 273 | 0,37 | 23 | 9,52 | ||||
| 2025-07-23 | 13F | Kingswood Wealth Advisors, Llc | 2 850 | 0,00 | 245 | 10,91 | ||||
| 2025-07-16 | 13F | Perigon Wealth Management, LLC | 4 153 | 0,17 | 356 | 11,25 | ||||
| 2025-08-13 | 13F | Northwestern Mutual Wealth Management Co | 18 205 | 106,34 | 1 562 | 129,22 | ||||
| 2025-07-29 | 13F | Lutz Financial Services LLC | 3 356 | 0,00 | 288 | 10,81 | ||||
| 2025-08-11 | 13F | Tidemark, LLC | 608 | 0,00 | 52 | 13,04 | ||||
| 2025-08-15 | 13F | CI Private Wealth, LLC | 89 866 | −53,28 | 7 709 | −48,13 | ||||
| 2025-08-12 | 13F | Tableaux Llc | 24 000 | 24 | ||||||
| 2025-04-10 | 13F | Trinity Wealth Management, LLC | 0 | −100,00 | 0 | |||||
| 2025-08-15 | 13F | Equitable Holdings, Inc. | 384 122 | 0,03 | 32 950 | 11,06 | ||||
| 2025-08-13 | 13F | Dana Investment Advisors, Inc. | 5 948 | 0,00 | 510 | 11,11 | ||||
| 2025-08-18 | 13F | Tyler-Stone Wealth Management | 9 346 | 5,16 | 802 | 16,76 | ||||
| 2025-08-12 | 13F/A | Brightwater Advisory LLC | 6 888 | 0,00 | 591 | 10,90 | ||||
| 2025-07-22 | 13F | Merit Financial Group, LLC | 71 150 | 7,31 | 6 103 | 19,15 | ||||
| 2025-07-24 | 13F | Aurora Private Wealth, Inc. | 3 661 | −1,45 | 0 | |||||
| 2025-08-14 | 13F | Federation des caisses Desjardins du Quebec | 508 | 0,00 | 44 | 10,26 | ||||
| 2025-08-14 | 13F | Arete Wealth Advisors, LLC | 2 698 | −80,87 | 0 | −100,00 | ||||
| 2025-08-14 | 13F | Mariner, LLC | 14 050 | 3,65 | 1 205 | 15,09 | ||||
| 2025-08-08 | 13F | Pnc Financial Services Group, Inc. | 4 408 | 626,19 | 378 | 721,74 | ||||
| 2025-07-30 | 13F | TFB Advisors LLC | 4 158 | 0,22 | 357 | 11,25 | ||||
| 2025-08-14 | 13F | Colony Group, LLC | 0 | −100,00 | 0 | |||||
| 2025-09-03 | 13F | American Trust | 17 226 | 1 478 | ||||||
| 2025-08-12 | 13F | CIBC Private Wealth Group, LLC | 1 480 | 0,00 | 127 | 24,75 | ||||
| 2025-07-17 | 13F | HCR Wealth Advisors | 2 536 | 218 | ||||||
| 2025-07-25 | 13F | Atria Wealth Solutions, Inc. | 21 006 | −23,84 | 1 802 | −15,49 | ||||
| 2025-07-23 | 13F | Capital Management Associates, Inc | 7 219 | −49,89 | 619 | −44,38 | ||||
| 2025-08-11 | 13F | Principal Securities, Inc. | 399 | 1,79 | 34 | 9,68 | ||||
| 2025-07-31 | 13F | Blue Sky Capital Consultants Group, Inc. | 2 487 | −9,03 | 213 | 0,95 | ||||
| 2025-08-15 | 13F | Captrust Financial Advisors | 4 666 | 0,04 | 400 | 11,11 | ||||
| 2025-08-12 | 13F | Laurel Wealth Advisors LLC | 4 118 | 8 479,17 | 0 | −100,00 | ||||
| 2025-03-12 | 13F/A | Private Capital Management Llc | 0 | −100,00 | 0 | −100,00 | ||||
| 2025-08-12 | 13F | J.w. Cole Advisors, Inc. | 28 281 | 0,02 | 2 426 | 11,03 | ||||
| 2025-08-01 | 13F | Envestnet Asset Management Inc | 40 590 | −10,77 | 3 482 | −0,94 | ||||
| 2025-08-13 | 13F | Cerity Partners LLC | 19 972 | 287,81 | 1 713 | 331,49 | ||||
| 2025-07-31 | 13F | City State Bank | 1 268 | 0,00 | 109 | 11,34 | ||||
| 2025-08-11 | 13F | Citigroup Inc | 11 984 | 12,25 | 1 028 | 24,64 | ||||
| 2025-07-18 | 13F | Liberty Capital Management, Inc. | 12 260 | 0,00 | 1 052 | 10,98 | ||||
| 2025-08-05 | 13F | Tsfg, Llc | 1 109 | 0,00 | 0 | |||||
| 2025-07-21 | 13F | Creative Capital Management Investments LLC | 800 | 0,00 | 69 | 11,48 | ||||
| 2025-07-02 | 13F | Helen Stephens Group, LLC | 4 910 | 0,29 | 421 | 11,38 | ||||
| 2025-08-14 | 13F | Wells Fargo & Company/mn | 90 917 | −4,03 | 7 799 | 6,54 | ||||
| 2025-07-14 | 13F | Signature Securities Group Corporation | 4 143 | −3,92 | 355 | 6,61 | ||||
| 2025-08-15 | 13F | Morgan Stanley | 526 156 | 1,58 | 45 134 | 12,79 | ||||
| 2025-07-10 | 13F | Focus Financial Network, Inc. | 4 918 | 0,31 | 422 | 11,38 | ||||
| 2025-07-30 | 13F | Pacific Sun Financial Corp | 7 920 | 0,00 | 679 | 11,13 | ||||
| 2025-08-08 | 13F | Cetera Investment Advisers | 45 275 | 3,03 | 3 884 | 14,37 | ||||
| 2025-08-14 | 13F | Mercer Global Advisors Inc /adv | 105 849 | 9 080 | ||||||
| 2025-08-12 | 13F | LPL Financial LLC | 183 668 | −2,62 | 15 755 | 8,12 | ||||
| 2025-08-14 | 13F | Financial Engines Advisors L.L.C. | 34 179 | 994,08 | 2 932 | 1 116,60 | ||||
| 2025-08-04 | 13F | Jim Saulnier & Associates, Llc | 39 098 | −6,11 | 3 354 | 4,23 | ||||
| 2025-08-12 | 13F | Global Retirement Partners, LLC | 28 666 | −3,43 | 2 459 | 2,08 | ||||
| 2025-08-26 | NP | EQ ADVISORS TRUST - EQ/Large Cap Growth Managed Volatility Portfolio Class IB | 15 692 | 0,00 | 1 346 | 11,06 | ||||
| 2025-04-23 | 13F | Wealthquest Corp | 0 | −100,00 | 0 | |||||
| 2025-08-11 | 13F | HighTower Advisors, LLC | 15 632 | −8,93 | 1 341 | 1,06 | ||||
| 2025-07-11 | 13F | Farther Finance Advisors, LLC | 242 | −3,59 | 21 | 5,26 | ||||
| 2025-05-15 | 13F/A | Orion Portfolio Solutions, LLC | 19 946 | 7,10 | 1 541 | 1,99 | ||||
| 2025-07-18 | 13F | Benchmark Wealth Management, LLC | 64 536 | 0,07 | 5 536 | 11,10 | ||||
| 2025-07-25 | 13F | Cwm, Llc | 8 323 | −1,30 | 1 | |||||
| 2025-07-25 | 13F | PrairieView Partners, LLC | 36 | 0,00 | 0 | |||||
| 2025-08-05 | 13F | Optivise Advisory Services LLC | 3 671 | −1,63 | 315 | 9,03 | ||||
| 2025-08-12 | 13F | Jpmorgan Chase & Co | 129 462 | −5,57 | 11 105 | 4,85 | ||||
| 2025-07-25 | 13F | Apollon Wealth Management, LLC | 10 220 | 0,00 | 877 | 11,03 | ||||
| 2025-08-14 | 13F | Susquehanna International Group, Llp | 36 581 | 175,71 | 3 138 | 206,05 | ||||
| 2025-08-13 | 13F | Baird Financial Group, Inc. | 4 845 | 0,00 | 416 | 10,96 | ||||
| 2025-08-05 | 13F | Bank Of Montreal /can/ | 0 | −100,00 | 0 | |||||
| 2025-07-22 | 13F | Wealthcare Advisory Partners LLC | 2 350 | 202 | ||||||
| 2025-08-14 | 13F | Integrated Wealth Concepts LLC | 2 769 | 0,00 | 238 | 11,27 | ||||
| 2025-08-08 | 13F | Avantax Advisory Services, Inc. | 150 982 | −2,90 | 12 951 | 7,81 | ||||
| 2025-07-18 | 13F | Bartlett & Co. Wealth Management Llc | 180 | 0,00 | 15 | 15,38 | ||||
| 2025-08-14 | 13F | Raymond James Financial Inc | 35 557 | −34,96 | 3 050 | −27,78 | ||||
| 2025-07-22 | 13F | Coastal Investment Advisors, Inc. | 892 | 0,00 | 77 | 11,76 | ||||
| 2025-07-28 | 13F | Morris Financial Concepts, Inc. | 300 | 0,00 | 26 | 8,70 | ||||
| 2025-07-21 | 13F | Ameritas Advisory Services, LLC | 1 555 | −79,37 | 133 | −78,12 | ||||
| 2025-07-15 | 13F | Mather Group, Llc. | 0 | −100,00 | 0 | |||||
| 2025-08-14 | 13F | Kovitz Investment Group Partners, LLC | 12 154 | −0,30 | 1 043 | 10,73 | ||||
| 2025-08-14 | 13F | IHT Wealth Management, LLC | 7 040 | 0,23 | 604 | 11,25 | ||||
| 2025-07-22 | 13F | Cedar Mountain Advisors, LLC | 313 | 0,00 | 27 | 8,33 | ||||
| 2025-08-27 | 13F/A | Brinker Capital Investments, LLC | 18 531 | −7,09 | 1 590 | 3,11 | ||||
| 2025-08-26 | 13F/A | Thrivent Financial For Lutherans | 6 575 | 0,23 | 1 | |||||
| 2025-07-28 | 13F | Harbour Trust & Investment Management Co | 4 700 | 0,00 | 403 | 11,02 | ||||
| 2025-08-13 | 13F | Flow Traders U.s. Llc | 0 | −100,00 | 0 | |||||
| 2025-08-19 | 13F | Cape Investment Advisory, Inc. | 5 155 | 0,00 | 442 | 11,06 | ||||
| 2025-08-08 | 13F | Tortoise Investment Management, LLC | 1 340 | 0,00 | 115 | 10,68 | ||||
| 2025-08-13 | 13F | Jones Financial Companies Lllp | 1 872 | 61,80 | 160 | 80,68 | ||||
| 2025-08-07 | 13F | PFG Advisors | 0 | −100,00 | 0 | |||||
| 2025-07-09 | 13F | Brand Asset Management Group, Inc. | 43 555 | −4,42 | 3 736 | 6,14 | ||||
| 2025-08-14 | 13F | Comerica Bank | 8 377 | −1,47 | 719 | 9,45 | ||||
| 2025-08-14 | 13F | West Coast Financial LLC | 0 | −100,00 | 0 | |||||
| 2025-08-14 | 13F | Fmr Llc | 14 859 | −4,66 | 1 275 | 5,81 | ||||
| 2025-07-31 | 13F | Opus Capital Group, LLC | 3 252 | 0,00 | 0 | |||||
| 2025-07-14 | 13F | Chapin Davis, Inc. | 6 587 | 0,00 | 565 | 11,22 | ||||
| 2025-07-29 | 13F | May Barnhard Investments LLC | 15 465 | 0,00 | 1 327 | 11,06 | ||||
| 2025-08-08 | 13F | Creative Planning | 9 562 | −35,72 | 820 | −28,63 | ||||
| 2025-08-12 | 13F | Bokf, Na | 1 718 | 147 | ||||||
| 2025-08-08 | 13F | Larson Financial Group LLC | 4 076 | 0,30 | 350 | 11,15 | ||||
| 2025-07-01 | 13F | Harbor Investment Advisory, Llc | 2 064 | 0,00 | 177 | 11,32 | ||||
| 2025-08-06 | 13F | Savant Capital, LLC | 13 463 | 1,90 | 1 155 | 13,14 | ||||
| 2025-05-14 | 13F | Seeds Investor Llc | 0 | −100,00 | 0 | |||||
| 2025-07-21 | 13F | Credential Qtrade Securities Inc. | 0 | −100,00 | 0 | −100,00 | ||||
| 2025-07-18 | 13F | Fmb Wealth Management | 3 188 | 0,00 | 273 | 10,98 | ||||
| 2025-08-14 | 13F | Silvercrest Asset Management Group Llc | 2 364 | 203 | ||||||
| 2025-05-15 | 13F | Harvest Investment Services, LLC | 0 | −100,00 | 0 | |||||
| 2025-08-12 | 13F | Steward Partners Investment Advisory, Llc | 3 782 | 10,42 | 324 | 22,73 | ||||
| 2025-08-14 | 13F | Two Sigma Investments, Lp | 11 800 | 1 012 | ||||||
| 2025-04-21 | 13F | Nelson, Van Denburg & Campbell Wealth Management Group, LLC | 0 | −100,00 | 0 | |||||
| 2025-07-29 | NP | EBI - Longview Advantage ETF | 0 | −100,00 | 0 | −100,00 | ||||
| 2025-07-22 | 13F | Silvia Mccoll Wealth Management, Llc | 19 315 | 0,00 | 1 657 | 10,99 | ||||
| 2025-08-14 | 13F | Keystone Financial Services, LLC | 11 247 | 0,02 | 965 | 11,06 | ||||
| 2025-08-12 | 13F | Asset Management Group, Inc. | 7 818 | 0,26 | 671 | 11,30 | ||||
| 2025-05-13 | 13F | AdvisorShares Investments LLC | 0 | −100,00 | 0 | |||||
| 2025-08-15 | 13F | Kestra Advisory Services, LLC | 8 408 | 2,93 | 721 | 14,26 | ||||
| 2025-07-15 | 13F | Fifth Third Bancorp | 520 | 0,00 | 45 | 10,00 | ||||
| 2025-07-25 | 13F | Index Fund Advisors, Inc. | 2 800 | 0,00 | 240 | 11,11 | ||||
| 2025-08-12 | 13F | AlphaCore Capital LLC | 3 528 | 303 | ||||||
| 2025-08-08 | 13F | Gts Securities Llc | 16 320 | −40,04 | 1 400 | −33,44 | ||||
| 2025-07-11 | 13F | Seacrest Wealth Management, Llc | 10 090 | −9,40 | 866 | 0,58 | ||||
| 2025-08-13 | 13F | Scotia Capital Inc. | 2 609 | −44,05 | 224 | −38,06 | ||||
| 2025-07-31 | 13F | Cambridge Investment Research Advisors, Inc. | 39 198 | −14,81 | 3 | 0,00 | ||||
| 2025-07-30 | 13F | Strategic Blueprint, LLC | 7 040 | −7,61 | 604 | 2,55 | ||||
| 2025-08-04 | 13F | Creative Financial Designs Inc /adv | 82 | 0,00 | 7 | 16,67 | ||||
| 2025-08-11 | 13F | Synergy Investment Management, LLC | 0 | −100,00 | 0 | |||||
| 2025-08-14 | 13F | Great Valley Advisor Group, Inc. | 2 610 | 0,27 | 224 | 10,95 | ||||
| 2025-07-14 | 13F | Painted Porch Advisors LLC | 122 | −44,04 | 10 | −37,50 | ||||
| 2025-07-29 | 13F | Salomon & Ludwin, LLC | 792 | 0,00 | 68 | 11,48 | ||||
| 2025-08-04 | 13F | Assetmark, Inc | 1 703 | −90,58 | 146 | −89,55 | ||||
| 2025-08-14 | 13F | Modern Wealth Management, LLC | 30 777 | 2 640 | ||||||
| 2025-07-29 | 13F | Chicago Partners Investment Group LLC | 4 823 | 0,00 | 424 | 13,10 | ||||
| 2025-07-14 | 13F | Farmers & Merchants Investments Inc | 1 959 | −5,82 | 168 | 5,00 | ||||
| 2025-05-15 | 13F | GWM Advisors LLC | 0 | −100,00 | 0 | |||||
| 2025-07-21 | 13F | New Century Financial Group, LLC | 2 694 | 0,04 | 231 | 11,06 | ||||
| 2025-08-14 | 13F | Citadel Advisors Llc | 0 | −100,00 | 0 | |||||
| 2025-07-22 | 13F | DAVENPORT & Co LLC | 2 624 | 225 | ||||||
| 2025-08-15 | 13F | Tower Research Capital LLC (TRC) | 0 | −100,00 | 0 | |||||
| 2025-04-21 | 13F | PSI Advisors, LLC | 0 | −100,00 | 0 | −100,00 | ||||
| 2025-07-28 | 13F | Mutual Advisors, LLC | 2 940 | 0,00 | 260 | 15,63 | ||||
| 2025-08-11 | 13F | Private Advisor Group, LLC | 12 990 | −8,08 | 1 114 | 2,11 | ||||
| 2025-07-24 | 13F | Edge Financial Advisors LLC | 4 693 | 402 | ||||||
| 2025-07-10 | 13F | Security National Bank | 1 158 | 0,00 | 99 | 11,24 |