Grundläggande statistik
| Institutionella ägare | 272 total, 272 long only, 0 short only, 0 long/short - change of 4,17% MRQ |
| Genomsnittlig portföljallokering | 0.1868 % - change of 25,34% MRQ |
| Institutionella aktier (lång) | 6 767 576 (ex 13D/G) - change of −0,41MM shares −5,65% MRQ |
| Institutionellt värde (lång) | $ 662 954 USD ($1000) |
Institutionellt ägande och aktieägare
iShares Trust - iShares U.S. Utilities ETF (US:IDU) har 272 Institutionella ägare och aktieägare som har lämnat in 13D/G- eller 13F-formulär till Securities Exchange Commission (SEC). Dessa institut innehar totalt 6,767,576 aktier. Största aktieägare inkluderar Bank Of America Corp /de/, Morgan Stanley, Destination Wealth Management, Green Harvest Asset Management LLC, LPL Financial LLC, Royal Bank Of Canada, Raymond James Financial Inc, Wells Fargo & Company/mn, Camarda Financial Advisors, LLC, and Lbmc Investment Advisors, Llc .
iShares Trust - iShares U.S. Utilities ETF (ARCA:IDU) Institutionell ägarstruktur visar institutioners och fonders nuvarande positioner i företaget, samt de senaste förändringarna i positionernas storlek. Större aktieägare kan vara enskilda investerare, fonder, hedgefonder eller institutioner. Bilaga 13D visar att investeraren äger (eller ägde) mer än 5% av företaget och avser (eller avsåg) att aktivt eftersträva en förändring av affärsstrategin. Schedule 13G indikerar en passiv investering på över 5%.
The share price as of September 24, 2025 is 109,63 / share. Previously, on September 25, 2024, the share price was 101,41 / share. This represents an increase of 8,11% over that period.

Fondsentimentets poäng
Fondsentimentet poängen(fka Ägarackumulation-poäng) visar vilka aktier som är mest köpta av fonder. Det är resultatet av en sofistikerad kvantitativ flerfaktormodell som identifierar företag med de högsta nivåerna av institutionell ackumulering. Poängsättningsmodellen använder en kombination av den totala ökningen av redovisade ägare, förändringarna i portföljallokeringarna för dessa ägare och andra mått. Siffran sträcker sig från 0 till 100, där högre siffror indikerar en högre nivå av ackumulering i förhållande till sina konkurrenter, och 50 är genomsnittet.
Uppdateringsfrekvens: Dagligen
Se Ownership Explorer, som innehåller en lista över de högst rankade företagen.
AI+ Ask Fintel’s AI assistant about iShares Trust - iShares U.S. Utilities ETF.
Thinking of good questions…
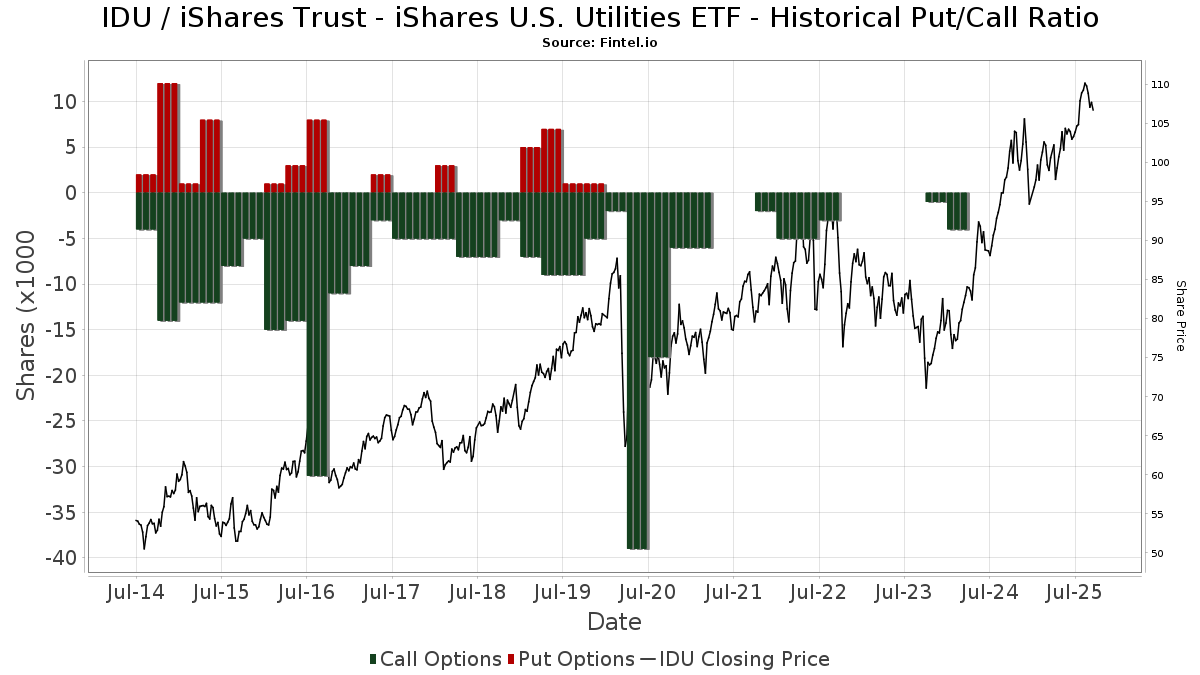
Institutionell sälj/köp-kvot
Förutom att rapportera vanliga eget kapital- och skuldemissioner måste institutioner med mer än 100MM tillgångar under förvaltning också avslöja sina innehav av sälj- och köpoptioner. Eftersom säljoptioner i allmänhet indikerar ett negativt sentiment och köpoptioner indikerar ett positivt sentiment, kan vi få en uppfattning om det övergripande institutionella sentimentet genom att plotta förhållandet mellan säljoptioner och köpoptioner. Diagrammet till höger visar det historiska förhållandet mellan sälj- och köpoptioner för detta instrument.
Genom att använda sälj/köp-kvoten som en indikator på aktieägarnas sentiment undviker man en av de största bristerna med att använda det totala institutionella ägandet, nämligen att en betydande del av de förvaltade tillgångarna investeras passivt för att följa index. Passivt förvaltade fonder köper vanligtvis inte optioner, så indikatorn för sälj/köp-kvoten ger en bättre bild av stämningen i aktivt förvaltade fonder.
13D/G-Arkiveringar
Vi presenterar 13D/G-arkiveringar separat från 13F-arkiveringar på grund av att de behandlas olika av SEC. 13D/G-arkiveringar kan lämnas in av grupper av investerare (med en ledare), medan 13F-arkiveringar inte kan det. Detta leder till situationer där en investerare kan lämna in en 13D/G-ansökan med ett värde för de totala aktierna (vilket motsvarar alla aktier som ägs av investerargruppen), men sedan lämna in en 13F-ansökan med ett annat värde för de totala aktierna (vilket motsvarar enbart deras eget ägande). Detta innebär att aktieägandet i 13D/G-arkiveringar och 13F-arkiveringar ofta inte är direkt jämförbara, så vi presenterar dem separat.
Notera: Från och med den 16 maj 2021 visar vi inte längre ägare som inte har lämnat in en 13D/G under det senaste året. Tidigare visade vi hela historiken för 13D/G-arkiveringar. I allmänhet måste enheter som är skyldiga att lämna in 13D/G-arkiveringar lämna in minst en gång per år innan de lämnar in en stängningsarkivering. Fonder avslutar dock ibland positioner utan att lämna in en avslutande arkivering (dvs. de avvecklar), så att visa hela historiken resulterade ibland i förvirring om det nuvarande ägandet. För att förhindra förvirring visar vi nu endast "nuvarande" ägare - det vill säga ägare som har lämnat in en ansökan under det senaste året.
Upgrade to unlock premium data.
13F- och NPORT-arkiveringar
Detaljer om 13F-arkiveringar är gratis. Detaljer om NP-arkiveringar kräver ett premiummedlemskap. Gröna rader indikerar nya positioner. Röda rader indikerar stängda positioner. Klicka på länk symbolen för att se hela transaktionshistoriken.
Uppgradera
för att låsa upp premiumdata och exportera till Excel ![]() .
.
| Fil Datum | Källa | Investerare | Typ | Genomsnittligt pris (beräknat) |
Aktier | Δ Aktier (%) |
Rapporterat värde (1000 USD) |
Δ Värde (%) |
Portföljallokering (%) |
|
|---|---|---|---|---|---|---|---|---|---|---|
| 2025-08-14 | 13F | Stifel Financial Corp | 16 550 | 25,13 | 1 731 | 29,01 | ||||
| 2025-08-14 | 13F | D. E. Shaw & Co., Inc. | 14 995 | −35,10 | 1 568 | −33,08 | ||||
| 2025-08-14 | 13F | GWM Advisors LLC | 20 855 | 1,18 | 2 181 | 4,31 | ||||
| 2025-08-28 | NP | RQEAX - RESQ Dynamic Allocation Fund RESQ Dynamic Allocation Class A Shares | 2 100 | 0,00 | 220 | 3,30 | ||||
| 2025-08-12 | 13F | Archer Investment Corp | 41 | 0,00 | 4 | 0,00 | ||||
| 2025-08-05 | 13F | Bank Of Montreal /can/ | 2 998 | −15,31 | 314 | −12,81 | ||||
| 2025-08-11 | 13F | TD Waterhouse Canada Inc. | 490 | 0,00 | 51 | 4,08 | ||||
| 2025-07-09 | 13F | Lbmc Investment Advisors, Llc | 112 844 | −0,86 | 11 800 | 2,22 | ||||
| 2025-07-14 | 13F | AdvisorNet Financial, Inc | 1 102 | 0,55 | 115 | 3,60 | ||||
| 2025-08-04 | 13F | Assetmark, Inc | 390 | 41 | ||||||
| 2025-08-08 | 13F | Principal Financial Group Inc | 86 585 | 9 054 | ||||||
| 2025-08-13 | 13F | Congress Wealth Management LLC / DE / | 3 333 | 13,91 | 349 | 17,57 | ||||
| 2025-08-05 | 13F | Bank of New York Mellon Corp | 3 396 | 38,78 | 355 | 43,15 | ||||
| 2025-08-14 | 13F | Atomi Financial Group, Inc. | 7 305 | 764 | ||||||
| 2025-08-12 | 13F | Weaver Consulting Group | 2 608 | 0,00 | 273 | 3,03 | ||||
| 2025-08-14 | 13F | Money Concepts Capital Corp | 3 227 | 25,52 | 337 | 29,62 | ||||
| 2025-07-29 | 13F | BKD Wealth Advisors, LLC | 7 912 | −0,44 | 827 | 2,73 | ||||
| 2025-08-06 | 13F | Simmons Bank | 7 780 | −1,56 | 814 | 1,50 | ||||
| 2025-08-12 | 13F | Jaffetilchin Investment Partners, LLC | 10 783 | 0,43 | 1 128 | 3,58 | ||||
| 2025-08-14 | 13F/A | Skopos Labs, Inc. | 19 | 2 | ||||||
| 2025-04-11 | 13F | Davis Capital Management | 466 | 0,00 | 47 | 6,82 | ||||
| 2025-07-31 | 13F | Jackson Hole Capital Partners, LLC | 62 | 0,00 | 6 | 0,00 | ||||
| 2025-07-22 | 13F | CPR Investments Inc. | 27 352 | 3,75 | 2 860 | 7,00 | ||||
| 2025-07-28 | 13F | Essex LLC | 14 630 | −6,24 | 1 530 | −3,35 | ||||
| 2025-08-14 | 13F | Ameriprise Financial Inc | 68 151 | 12,50 | 7 125 | 15,97 | ||||
| 2025-08-14 | 13F | EP Wealth Advisors, Inc. | 4 996 | −6,63 | 522 | −3,69 | ||||
| 2025-05-12 | 13F | Aveo Capital Partners, LLC | 0 | −100,00 | 0 | |||||
| 2025-07-15 | 13F | EWG Elevate Inc. | 16 811 | 1 758 | ||||||
| 2025-08-13 | 13F | Baird Financial Group, Inc. | 0 | −100,00 | 0 | |||||
| 2025-08-12 | 13F | Gladstone Institutional Advisory LLC | 6 601 | 690 | ||||||
| 2025-08-15 | 13F | Kestra Advisory Services, LLC | 14 575 | 5,84 | 1 524 | 9,17 | ||||
| 2025-07-16 | 13F | Signaturefd, Llc | 323 | 9,12 | 34 | 10,00 | ||||
| 2025-04-17 | 13F | Good Life Advisors, LLC | 0 | −100,00 | 0 | |||||
| 2025-08-11 | 13F | Private Advisor Group, LLC | 26 052 | 8,36 | 2 724 | 11,73 | ||||
| 2025-08-06 | 13F | Garrison Point Advisors, Llc | 6 948 | 1,46 | 727 | 4,61 | ||||
| 2025-08-13 | 13F | Capital Analysts, Inc. | 1 001 | 0,00 | 0 | |||||
| 2025-04-29 | 13F | Wood Tarver Financial Group, LLC | 0 | −100,00 | 0 | |||||
| 2025-07-11 | 13F/A | Umb Bank N A/mo | 675 | −43,75 | 71 | −42,15 | ||||
| 2025-08-14 | 13F | Arete Wealth Advisors, LLC | 37 698 | 0,57 | 4 | 0,00 | ||||
| 2025-08-14 | 13F | Mml Investors Services, Llc | 44 273 | 18,78 | 5 | 33,33 | ||||
| 2025-08-05 | 13F | Sigma Planning Corp | 6 393 | 3,46 | 669 | 6,71 | ||||
| 2025-09-04 | 13F/A | Advisor Group Holdings, Inc. | 87 941 | 71,96 | 9 202 | 77,34 | ||||
| 2025-07-15 | 13F | Evanson Asset Management, LLC | 4 759 | 0,13 | 498 | 3,11 | ||||
| 2025-07-31 | 13F | Oppenheimer & Co Inc | 5 931 | 15,79 | 620 | 19,46 | ||||
| 2025-07-31 | 13F | Cambridge Investment Research Advisors, Inc. | 53 327 | 26,48 | 6 | 25,00 | ||||
| 2025-05-09 | 13F | Three Seasons Wealth, LLC | 0 | −100,00 | 0 | |||||
| 2025-08-12 | 13F | Choate Investment Advisors | 670 | 70 | ||||||
| 2025-08-08 | 13F | Carl P. Sherr & Co., LLC | 2 895 | −7,36 | 303 | −4,43 | ||||
| 2025-08-12 | 13F | Picton Mahoney Asset Management | 1 400 | 16,67 | 0 | |||||
| 2025-08-06 | 13F | Founders Financial Securities Llc | 2 103 | 220 | ||||||
| 2025-07-29 | NP | MVFG - Monarch Volume Factor Global Unconstrained Index ETF | 0 | −100,00 | 0 | −100,00 | ||||
| 2025-07-29 | 13F | Empirical Asset Management, LLC | 4 495 | −0,04 | 470 | 3,07 | ||||
| 2025-08-29 | 13F | Evolution Wealth Management Inc. | 55 | 6 | ||||||
| 2025-07-07 | 13F | Discipline Wealth Solutions, LLC | 2 311 | −2,16 | 242 | 0,84 | ||||
| 2025-07-23 | 13F | Prime Capital Investment Advisors, LLC | 2 900 | −23,82 | 303 | −21,50 | ||||
| 2025-08-12 | 13F | O'shaughnessy Asset Management, Llc | 2 001 | 0,00 | 209 | 3,47 | ||||
| 2025-08-13 | 13F | Hsbc Holdings Plc | 0 | −100,00 | 0 | |||||
| 2025-07-23 | 13F | Country Club Bank /gfn | 46 548 | −21,83 | 4 848 | −18,79 | ||||
| 2025-08-06 | 13F | Rialto Wealth Management, LLC | 74 | 0,00 | 8 | 0,00 | ||||
| 2025-08-13 | 13F | Cary Street Partners Financial Llc | 2 225 | 233 | ||||||
| 2025-08-12 | 13F | Founders Financial Alliance, LLC | 56 | 0,00 | 6 | 0,00 | ||||
| 2025-08-14 | 13F | Hrt Financial Lp | 9 657 | 1 | ||||||
| 2025-05-14 | 13F | Keeley-Teton Advisors, LLC | 2 575 | 0,00 | 261 | 5,67 | ||||
| 2025-05-16 | 13F | Laidlaw Wealth Management LLC | 0 | −100,00 | 0 | |||||
| 2025-07-30 | 13F | Schnieders Capital Management Llc | 5 200 | 0,00 | 544 | 3,04 | ||||
| 2025-08-12 | 13F | Franklin Resources Inc | 5 420 | 0,00 | 567 | 3,10 | ||||
| 2025-07-24 | 13F | Capital Advisors, Ltd. LLC | 4 235 | 0,26 | 0 | |||||
| 2025-07-24 | 13F | Us Bancorp \de\ | 1 512 | −12,95 | 158 | −10,23 | ||||
| 2025-08-06 | 13F | AE Wealth Management LLC | 81 696 | 97,02 | 8 543 | 103,14 | ||||
| 2025-07-10 | 13F | Wealth Enhancement Advisory Services, Llc | 12 945 | −7,40 | 1 355 | −4,38 | ||||
| 2025-07-29 | 13F | Stratos Wealth Partners, LTD. | 11 512 | 197,08 | 1 204 | 206,11 | ||||
| 2025-08-08 | 13F | Emerald Investment Partners, Llc | 306 | 0,00 | 32 | 0,00 | ||||
| 2025-08-12 | 13F | Holderness Investments Co | 13 628 | 0,76 | 1 425 | 3,94 | ||||
| 2025-05-13 | 13F | Neuberger Berman Group LLC | 0 | −100,00 | 0 | |||||
| 2025-07-16 | 13F/A | CX Institutional | 2 008 | 23,57 | 0 | |||||
| 2025-07-14 | 13F | U.S. Capital Wealth Advisors, LLC | 7 938 | 0,00 | 830 | 3,11 | ||||
| 2025-08-05 | 13F | Westside Investment Management, Inc. | 310 | 0,00 | 32 | 3,23 | ||||
| 2025-08-14 | 13F | Synovus Financial Corp | 4 079 | 0,22 | 427 | 3,40 | ||||
| 2025-07-24 | 13F | Forefront Analytics, LLC | 30 532 | 3 193 | ||||||
| 2025-05-13 | 13F | Adams Wealth Management | 38 006 | 3 855 | ||||||
| 2025-07-16 | 13F | Minichmacgregor Wealth Management, Llc | 106 597 | −5,79 | 11 147 | −2,87 | ||||
| 2025-08-04 | 13F | Arkadios Wealth Advisors | 6 996 | 25,67 | 732 | 29,61 | ||||
| 2025-07-30 | 13F | D.a. Davidson & Co. | 16 074 | −4,51 | 1 681 | −1,58 | ||||
| 2025-08-18 | 13F | Geneos Wealth Management Inc. | 14 232 | 200,00 | 1 488 | 209,36 | ||||
| 2025-05-01 | 13F | WESPAC Advisors, LLC | 0 | −100,00 | 0 | |||||
| 2025-04-23 | 13F | Saxony Capital Management, LLC | 0 | −100,00 | 0 | |||||
| 2025-05-13 | 13F | CacheTech Inc. | 38 006 | 3 855 | ||||||
| 2025-08-04 | 13F | Wealth Management Associates, Inc. | 7 269 | 6,10 | 760 | 9,51 | ||||
| 2025-08-08 | 13F | Creative Planning | 4 682 | −12,80 | 490 | −10,11 | ||||
| 2025-08-12 | 13F | Proequities, Inc. | 0 | 0 | ||||||
| 2025-08-04 | 13F | Creative Financial Designs Inc /adv | 0 | −100,00 | 0 | |||||
| 2025-05-14 | 13F | Oarsman Capital, Inc. | 0 | −100,00 | 0 | |||||
| 2025-08-18 | 13F/A | National Bank Of Canada /fi/ | 168 | 0,00 | 18 | 6,25 | ||||
| 2025-08-05 | 13F | Huntington National Bank | 2 611 | 3,08 | ||||||
| 2025-08-19 | 13F | National Asset Management, Inc. | 3 557 | 372 | ||||||
| 2025-07-21 | 13F | Ntv Asset Management Llc | 2 240 | −18,25 | 234 | −15,52 | ||||
| 2025-08-19 | 13F | Delos Wealth Advisors, LLC | 150 | 16 | ||||||
| 2025-08-14 | 13F | Citadel Advisors Llc | 2 052 | 0,00 | 215 | 2,88 | ||||
| 2025-07-17 | 13F | Beacon Capital Management, LLC | 102 | 0,99 | 11 | 0,00 | ||||
| 2025-07-23 | 13F | Valmark Advisers, Inc. | 1 953 | 204 | ||||||
| 2025-07-25 | 13F | Cwm, Llc | 748 | 0,00 | 0 | |||||
| 2025-08-14 | 13F | McIlrath & Eck, LLC | 166 | 0,00 | 17 | 6,25 | ||||
| 2025-04-22 | 13F/A | NorthRock Partners, LLC | 0 | −100,00 | 0 | |||||
| 2025-05-13 | 13F | Hartland & Co., LLC | 0 | 0 | ||||||
| 2025-08-05 | 13F | Carolinas Wealth Consulting Llc | 0 | −100,00 | 0 | −100,00 | ||||
| 2025-08-14 | 13F | Wells Fargo & Company/mn | 161 365 | 27,76 | 16 874 | 31,73 | ||||
| 2025-07-17 | 13F | Fort Washington Investment Advisors Inc /oh/ | 4 300 | 0,00 | 450 | 2,98 | ||||
| 2025-07-21 | 13F | J. Safra Sarasin Holding AG | 0 | −100,00 | 0 | |||||
| 2025-08-08 | 13F | Compass Financial Services Inc | 189 | 0,53 | 20 | 0,00 | ||||
| 2025-05-02 | 13F | Apollon Wealth Management, LLC | 0 | −100,00 | 0 | |||||
| 2025-08-14 | 13F | Hilltop Holdings Inc. | 2 274 | 0,00 | 238 | 3,04 | ||||
| 2025-08-06 | 13F | Moors & Cabot, Inc. | 2 686 | 1,63 | 281 | 4,48 | ||||
| 2025-08-04 | 13F | Atria Investments Llc | 7 892 | 825 | ||||||
| 2025-08-12 | 13F | Heritage Trust Co | 2 558 | 0,00 | 267 | 3,09 | ||||
| 2025-08-15 | 13F | Captrust Financial Advisors | 6 255 | 1,48 | 654 | 4,64 | ||||
| 2025-08-14 | 13F | Two Sigma Securities, Llc | 1 920 | 201 | ||||||
| 2025-05-06 | 13F | Navellier & Associates Inc | 0 | −100,00 | 0 | |||||
| 2025-07-09 | 13F | Fiduciary Alliance LLC | 3 954 | −7,44 | 413 | −4,62 | ||||
| 2025-04-21 | 13F | Nelson, Van Denburg & Campbell Wealth Management Group, LLC | 0 | −100,00 | 0 | |||||
| 2025-08-14 | 13F | Mariner, LLC | 12 828 | 477,32 | 1 341 | 496,00 | ||||
| 2025-08-06 | 13F | Commonwealth Equity Services, Llc | 108 139 | −15,43 | 11 | −8,33 | ||||
| 2025-08-07 | 13F | Allworth Financial LP | 2 200 | 57,37 | 230 | 63,12 | ||||
| 2025-08-15 | 13F | CI Private Wealth, LLC | 22 450 | −3,54 | 2 348 | −0,55 | ||||
| 2025-08-13 | 13F | Gamco Investors, Inc. Et Al | 2 575 | 269 | ||||||
| 2025-08-13 | 13F | Cerity Partners LLC | 16 972 | 0,00 | 1 775 | 3,08 | ||||
| 2025-08-14 | 13F | CoreCap Advisors, LLC | 396 | 0,00 | 41 | 2,50 | ||||
| 2025-07-16 | 13F | Advisors Management Group Inc /adv | 21 805 | −0,02 | 2 | 0,00 | ||||
| 2025-08-14 | 13F | Warren Averett Asset Management, LLC | 19 007 | 0,02 | 1 988 | 3,11 | ||||
| 2025-08-12 | 13F | Coldstream Capital Management Inc | 0 | −100,00 | 0 | |||||
| 2025-07-10 | 13F | High Net Worth Advisory Group LLC | 6 400 | 0,00 | 669 | 3,08 | ||||
| 2025-07-22 | 13F | Apexium Financial, Lp | 3 372 | 0,00 | 353 | 2,92 | ||||
| 2025-07-08 | 13F | Rise Advisors, LLC | 1 274 | 12,44 | 133 | 16,67 | ||||
| 2025-07-28 | 13F | Harbour Investments, Inc. | 8 991 | 140,27 | 940 | 148,02 | ||||
| 2025-08-11 | 13F | Aptus Capital Advisors, LLC | 25 | 0,00 | 3 | 0,00 | ||||
| 2025-05-07 | 13F | Norden Group Llc | 0 | −100,00 | 0 | |||||
| 2025-08-12 | 13F | Tableaux Llc | 24 570 | 342 | ||||||
| 2025-04-21 | 13F | Well Done, LLC | 0 | −100,00 | 0 | |||||
| 2025-08-13 | 13F | Flow Traders U.s. Llc | 0 | −100,00 | 0 | |||||
| 2025-07-31 | 13F | FSA Investment Group, LLC | 4 947 | 0,57 | 517 | 3,82 | ||||
| 2025-08-14 | 13F | Quantinno Capital Management LP | 6 455 | 58,17 | 675 | 63,44 | ||||
| 2025-04-30 | 13F | Axxcess Wealth Management, Llc | 0 | −100,00 | 0 | |||||
| 2025-08-01 | 13F | First Command Advisory Services, Inc. | 183 | 0,00 | 19 | 5,56 | ||||
| 2025-08-06 | 13F | Golden State Wealth Management, LLC | 58 | 0,00 | 6 | 20,00 | ||||
| 2025-04-28 | 13F | Clear Creek Financial Management, LLC | 0 | −100,00 | 0 | |||||
| 2025-07-09 | 13F | Keystone Wealth Services, LLC | 2 120 | 0,00 | 222 | 2,79 | ||||
| 2025-07-24 | 13F | Blair William & Co/il | 543 | 0,00 | 57 | 1,82 | ||||
| 2025-08-15 | 13F | Morgan Stanley | 675 609 | 29,05 | 70 649 | 33,06 | ||||
| 2025-08-15 | 13F | Provenance Wealth Advisors, LLC | 214 | 0,00 | 22 | 4,76 | ||||
| 2025-08-29 | 13F | Total Investment Management Inc | 0 | 0 | ||||||
| 2025-07-17 | 13F/A | Capital Investment Advisors, LLC | 7 128 | 0,03 | 745 | 3,19 | ||||
| 2025-04-21 | 13F | Envestnet Portfolio Solutions, Inc. | 0 | −100,00 | 0 | |||||
| 2025-07-24 | 13F | IFP Advisors, Inc | 125 | −28,57 | 13 | −23,53 | ||||
| 2025-04-29 | 13F | Sharp Financial Services, LLC | 0 | −100,00 | 0 | |||||
| 2025-07-21 | 13F | Ameritas Advisory Services, LLC | 1 296 | 136 | ||||||
| 2025-08-01 | 13F | Boyd Watterson Asset Management Llc/oh | 79 | 0,00 | 8 | 0,00 | ||||
| 2025-08-11 | 13F | Brown Brothers Harriman & Co | 55 | 0,00 | 6 | 0,00 | ||||
| 2025-07-16 | 13F | Strategic Investment Solutions, Inc. /IL | 752 | 0,00 | 79 | 2,63 | ||||
| 2025-08-12 | 13F | MAI Capital Management | 349 | 0,00 | 36 | 2,86 | ||||
| 2025-05-12 | 13F | Townsquare Capital Llc | 0 | −100,00 | 0 | |||||
| 2025-08-19 | 13F | Anchor Investment Management, LLC | 200 | 0,00 | 21 | 0,00 | ||||
| 2025-05-06 | 13F | Rsm Us Wealth Management Llc | 0 | −100,00 | 0 | |||||
| 2025-08-14 | 13F | FIL Ltd | 0 | −100,00 | 0 | |||||
| 2025-07-23 | 13F | West Paces Advisors Inc. | 144 | 15 | ||||||
| 2025-04-22 | 13F | Mendota Financial Group, LLC | 0 | −100,00 | 0 | |||||
| 2025-08-14 | 13F | Financial Advisory Service, Inc. | 980 | 0,00 | 102 | 3,03 | ||||
| 2025-08-18 | 13F | Front Row Advisors LLC | 252 | −21,25 | 26 | −18,75 | ||||
| 2025-07-25 | 13F | Johnson Investment Counsel Inc | 3 133 | 24,18 | 328 | 28,24 | ||||
| 2025-08-12 | 13F | Financial Advocates Investment Management | 0 | −100,00 | 0 | −100,00 | ||||
| 2025-08-15 | 13F | First Heartland Consultants, Inc. | 2 033 | −0,25 | 213 | 2,91 | ||||
| 2025-04-30 | 13F | Moloney Securities Asset Management, LLC | 0 | −100,00 | 0 | −100,00 | ||||
| 2025-08-05 | 13F | Advisors Preferred, LLC | 0 | −100,00 | 0 | |||||
| 2025-08-06 | 13F | Prospera Financial Services Inc | 66 362 | 204,43 | 6 940 | 213,84 | ||||
| 2025-08-14 | 13F | Federation des caisses Desjardins du Quebec | 85 | −67,31 | 9 | −69,23 | ||||
| 2025-05-02 | 13F | Capital A Wealth Management, LLC | 458 | 0,00 | 46 | 4,55 | ||||
| 2025-08-13 | 13F | Vertex Planning Partners, LLC | 2 081 | −12,42 | 218 | −9,58 | ||||
| 2025-07-02 | 13F | HBW Advisory Services LLC | 5 951 | 30,16 | 622 | 34,34 | ||||
| 2025-07-29 | 13F | Stephens Inc /ar/ | 20 713 | −0,48 | 2 166 | 2,61 | ||||
| 2025-08-13 | 13F | Colonial Trust Co / SC | 600 | 0,00 | 63 | 3,33 | ||||
| 2025-07-15 | 13F | Mather Group, Llc. | 0 | −100,00 | 0 | |||||
| 2025-08-14 | 13F | Gotham Asset Management, LLC | 2 287 | 0,00 | 239 | 3,46 | ||||
| 2025-07-24 | 13F | Wealthstar Advisors, Llc | 22 040 | 17,84 | 2 305 | 21,52 | ||||
| 2025-08-14 | 13F | UBS Group AG | 48 517 | 3,57 | 5 073 | 6,78 | ||||
| 2025-08-04 | 13F | Rede Wealth, LLC | 2 074 | 0,00 | 217 | 2,86 | ||||
| 2025-08-14 | 13F | Ancora Advisors, LLC | 200 | 0,00 | 21 | 0,00 | ||||
| 2025-07-17 | 13F | Sound Income Strategies, LLC | 232 | 24 | ||||||
| 2025-08-14 | 13F | Royal Bank Of Canada | 261 168 | 17,01 | 27 311 | 20,65 | ||||
| 2025-05-06 | 13F | 1492 Capital Management LLC | 0 | −100,00 | 0 | −100,00 | ||||
| 2025-07-24 | 13F | Advanced Asset Management Advisors Inc | 1 608 | 0,00 | 168 | 3,07 | ||||
| 2025-07-30 | 13F | Blume Capital Management, Inc. | 90 | 9 | ||||||
| 2025-08-04 | 13F | Spire Wealth Management | 0 | −100,00 | 0 | |||||
| 2025-08-01 | 13F | Envestnet Asset Management Inc | 94 858 | 27,19 | 9 919 | 31,15 | ||||
| 2025-08-08 | 13F | Family Firm, Inc. | 22 364 | 0,52 | 2 339 | 3,63 | ||||
| 2025-08-12 | 13F | Jpmorgan Chase & Co | 20 344 | −8,31 | 2 127 | −5,47 | ||||
| 2025-07-24 | 13F | CarsonAllaria Wealth Management, Ltd. | 87 | 0,00 | 9 | 12,50 | ||||
| 2025-07-29 | 13F | Private Trust Co Na | 11 | 0,00 | 1 | 0,00 | ||||
| 2025-08-14 | 13F | KKM Financial LLC | 6 086 | 636 | ||||||
| 2025-08-11 | 13F | VSM Wealth Advisory, LLC | 101 | 0,00 | 11 | 0,00 | ||||
| 2025-08-13 | 13F | Brown Advisory Inc | 2 400 | 0,00 | 251 | 2,88 | ||||
| 2025-08-14 | 13F | Matrix Private Capital Group Llc | 400 | 0,00 | 42 | 2,50 | ||||
| 2025-07-10 | 13F | Sharkey, Howes & Javer | 12 180 | −21,34 | 1 274 | −18,92 | ||||
| 2025-08-13 | 13F | Mount Yale Investment Advisors, LLC | 236 | 25 | ||||||
| 2025-04-02 | 13F/A | Industrial Alliance Investment Management Inc. | 0 | −100,00 | 0 | |||||
| 2025-08-05 | 13F | Kesler, Norman & Wride, LLC | 3 458 | 362 | ||||||
| 2025-05-16 | 13F | Great Lakes Advisors, Llc | 0 | −100,00 | 0 | |||||
| 2025-08-11 | 13F | Citigroup Inc | 5 281 | 89,96 | 552 | 96,44 | ||||
| 2025-07-15 | 13F | Missouri Trust & Investment Co | 175 | 0,00 | 18 | 5,88 | ||||
| 2025-08-08 | 13F | Pnc Financial Services Group, Inc. | 26 796 | −3,41 | 2 802 | −0,39 | ||||
| 2025-08-14 | 13F | MGB Wealth Management, LLC | 690 | 0,00 | 72 | 4,35 | ||||
| 2025-08-14 | 13F | Susquehanna International Group, Llp | 2 524 | −93,12 | 264 | −92,93 | ||||
| 2025-07-25 | 13F | Atria Wealth Solutions, Inc. | 5 466 | −20,74 | 572 | −18,31 | ||||
| 2025-08-12 | 13F | CIBC Private Wealth Group, LLC | 3 804 | −9,51 | 398 | 0,51 | ||||
| 2025-08-08 | 13F | Everett Harris & Co /ca/ | 18 514 | −0,38 | 1 936 | 2,76 | ||||
| 2025-08-12 | 13F | J.w. Cole Advisors, Inc. | 26 642 | 4,82 | 2 786 | 8,07 | ||||
| 2025-08-14 | 13F | Raymond James Financial Inc | 205 135 | 8,56 | 21 451 | 11,93 | ||||
| 2025-07-23 | 13F | Madden Advisory Services, Inc. | 4 279 | 0,00 | 447 | 3,23 | ||||
| 2025-07-29 | 13F | Cottonwood Capital Advisors, Llc | 3 277 | −5,18 | 343 | −2,29 | ||||
| 2025-04-25 | 13F | Koshinski Asset Management, Inc. | 0 | −100,00 | 0 | −100,00 | ||||
| 2025-08-07 | 13F | Resources Investment Advisors, LLC. | 0 | −100,00 | 0 | |||||
| 2025-07-17 | 13F | Independence Bank of Kentucky | 6 647 | −1,07 | 695 | 2,06 | ||||
| 2025-08-14 | 13F | Destination Wealth Management | 614 088 | −0,76 | 64 215 | 2,33 | ||||
| 2025-08-11 | 13F | Principal Securities, Inc. | 1 508 | 5,68 | 158 | 14,60 | ||||
| 2025-04-28 | 13F | First Horizon Advisors, Inc. | 0 | −100,00 | 0 | |||||
| 2025-08-04 | 13F | Field & Main Bank | 2 720 | −1,09 | 284 | 2,16 | ||||
| 2025-05-07 | 13F | Second Half Financial Partners, LLC | 0 | −100,00 | 0 | −100,00 | ||||
| 2025-08-05 | 13F | Tsfg, Llc | 300 | 0,00 | 0 | |||||
| 2025-08-14 | 13F | Sunbelt Securities, Inc. | 9 038 | 13,33 | 870 | 7,55 | ||||
| 2025-08-12 | 13F | Laurel Wealth Advisors LLC | 94 113 | 10 357,00 | 1 | −100,00 | ||||
| 2025-08-14 | 13F | Bank Of America Corp /de/ | 938 296 | 88,04 | 98 118 | 93,88 | ||||
| 2025-08-15 | 13F | Equitable Holdings, Inc. | 13 975 | 43,19 | 1 461 | 47,72 | ||||
| 2025-04-16 | 13F | Bensler, LLC | 0 | −100,00 | 0 | −100,00 | ||||
| 2025-07-10 | 13F | Focus Financial Network, Inc. | 2 858 | 0,11 | 299 | 3,11 | ||||
| 2025-08-08 | 13F | Gts Securities Llc | 2 005 | −87,21 | 210 | −86,85 | ||||
| 2025-08-08 | 13F | Capital Investment Advisory Services, LLC | 588 | 0,68 | 61 | 3,39 | ||||
| 2025-04-25 | 13F | New Wave Wealth Advisors Llc | 0 | −100,00 | 0 | |||||
| 2025-08-08 | 13F | Cetera Investment Advisers | 40 104 | 17,99 | 4 194 | 21,64 | ||||
| 2025-08-12 | 13F | SRS Capital Advisors, Inc. | 601 | 0,00 | 63 | 3,33 | ||||
| 2025-08-05 | 13F | Allstate Corp | 14 047 | 92,42 | 1 469 | 98,38 | ||||
| 2025-07-31 | 13F | Forte Asset Management Llc | 68 495 | 7 162 | ||||||
| 2025-07-25 | 13F | Hazlett, Burt & Watson, Inc. | 100 | 0,00 | 0 | |||||
| 2025-07-09 | 13F | Summit Financial Consulting LLC | 52 933 | 5 535 | ||||||
| 2025-08-13 | 13F | Summit Financial, LLC | 3 100 | 6,75 | 324 | 10,20 | ||||
| 2025-05-20 | 13F | Belpointe Asset Management LLC | 0 | −100,00 | 0 | |||||
| 2025-05-02 | 13F | Pinkerton Retirement Specialists, LLC | 0 | −100,00 | 0 | |||||
| 2025-07-29 | 13F | Stratos Wealth Advisors, LLC | 46 655 | 42,88 | 4 879 | 47,33 | ||||
| 2025-08-11 | 13F | HighTower Advisors, LLC | 16 466 | −0,22 | 1 722 | 2,87 | ||||
| 2025-08-06 | 13F | Modera Wealth Management, LLC | 1 971 | 206 | ||||||
| 2025-07-31 | 13F/A | Avion Wealth | 660 | 0,00 | 0 | |||||
| 2025-07-18 | 13F | Truist Financial Corp | 75 499 | 25,30 | 7 895 | 29,20 | ||||
| 2025-07-31 | 13F | Arrien Investments, Inc. | 69 431 | −2,08 | 7 260 | 0,96 | ||||
| 2025-08-14 | 13F | Fmr Llc | 7 369 | −11,94 | 771 | −9,20 | ||||
| 2025-08-05 | 13F | Wakefield Asset Management LLLP | 15 168 | −12,94 | 1 586 | −10,19 | ||||
| 2025-07-09 | 13F | WealthCare Investment Partners, LLC | 15 366 | 10,21 | 1 609 | 17,72 | ||||
| 2025-08-04 | 13F | Creekmur Asset Management LLC | 260 | 0,00 | 27 | 3,85 | ||||
| 2025-08-07 | 13F | Winthrop Capital Management, LLC | 53 | 0,00 | 0 | |||||
| 2025-05-08 | NP | QALTX - Quantified Alternative Investment Fund Investor Class Shares | 2 334 | 46,24 | 237 | 45,68 | ||||
| 2025-08-26 | 13F/A | Thrivent Financial For Lutherans | 2 520 | 0 | ||||||
| 2025-08-14 | 13F | Gerber Kawasaki Wealth & Investment Management | 6 807 | −0,83 | 712 | 2,16 | ||||
| 2025-08-13 | 13F | Northwestern Mutual Wealth Management Co | 40 110 | 32,52 | 4 194 | 36,66 | ||||
| 2025-04-01 | 13F | First Financial Bank - Trust Division | 0 | −100,00 | 0 | |||||
| 2025-07-25 | 13F | Concord Wealth Partners | 360 | 0,56 | 38 | 2,78 | ||||
| 2025-08-13 | 13F | Jones Financial Companies Lllp | 18 783 | 17,75 | 1 956 | 22,33 | ||||
| 2025-08-14 | 13F | Peapack Gladstone Financial Corp | 5 310 | −1,85 | 1 | |||||
| 2025-08-05 | 13F | Lifeworks Advisors, LLC | 8 880 | 929 | ||||||
| 2025-05-15 | 13F | CAPROCK Group, Inc. | 2 001 | 203 | ||||||
| 2025-08-08 | 13F | Avantax Advisory Services, Inc. | 21 991 | 27,31 | 2 300 | 31,30 | ||||
| 2025-08-13 | 13F | Green Harvest Asset Management LLC | 459 832 | 0,97 | 48 085 | 4,10 | ||||
| 2025-04-23 | 13F | Balboa Wealth Partners | 0 | −100,00 | 0 | |||||
| 2025-08-14 | 13F | Glenmede Investment Management, LP | 700 | 73 | ||||||
| 2025-08-14 | 13F | Qube Research & Technologies Ltd | 2 146 | 99,81 | 224 | 107,41 | ||||
| 2025-08-06 | 13F | Forbes Financial Planning, Inc. | 3 164 | −6,91 | 331 | −4,07 | ||||
| 2025-08-12 | 13F | BlackRock, Inc. | 390 | 62,50 | 41 | 66,67 | ||||
| 2025-07-11 | 13F | Farther Finance Advisors, LLC | 1 177 | 34,05 | 123 | 38,20 | ||||
| 2025-08-14 | 13F | Camarda Financial Advisors, LLC | 127 449 | 13 327 | ||||||
| 2025-08-08 | 13F/A | Sterling Capital Management LLC | 770 | 0,00 | 81 | 2,56 | ||||
| 2025-08-14 | 13F | Transamerica Financial Advisors, Inc. | 0 | −100,00 | 0 | |||||
| 2025-08-12 | 13F | PKS Advisory Services, LLC | 5 380 | 17,08 | 563 | 20,60 | ||||
| 2025-08-14 | 13F | Coastal Bridge Advisors, LLC | 1 967 | 206 | ||||||
| 2025-08-14 | 13F | Goldman Sachs Group Inc | 38 231 | −36,51 | 3 998 | −34,54 | ||||
| 2025-07-18 | 13F | Bartlett & Co. Wealth Management Llc | 800 | 0,00 | 84 | 2,47 | ||||
| 2025-08-14 | 13F | Jane Street Group, Llc | 26 844 | 46,04 | 2 807 | 50,59 | ||||
| 2025-08-15 | 13F | Nikulski Financial, Inc. | 11 363 | 1 188 | ||||||
| 2025-08-07 | 13F | Midwest Trust Co | 1 917 | 200 | ||||||
| 2025-08-06 | 13F | SOUTH STATE Corp | 150 | 0,00 | 16 | 0,00 | ||||
| 2025-07-21 | 13F | Hilltop National Bank | 366 | 0,00 | 38 | 8,57 | ||||
| 2025-08-04 | 13F | Buck Wealth Strategies, LLC | 10 256 | 48,47 | 1 072 | 53,14 | ||||
| 2025-07-23 | 13F | Mullooly Asset Management, Inc. | 7 972 | −13,56 | 833 | −10,91 | ||||
| 2025-08-14 | 13F | Beaird Harris Wealth Management, LLC | 370 | 0,00 | 39 | 2,70 | ||||
| 2025-05-09 | 13F | GeoWealth Management, LLC | 0 | −100,00 | 0 | |||||
| 2025-08-18 | 13F | N.E.W. Advisory Services LLC | 1 244 | 0,00 | 130 | 3,17 | ||||
| 2025-08-14 | 13F | Quartz Partners, LLC | 5 925 | 620 | ||||||
| 2025-07-23 | 13F | Independent Solutions Wealth Management, LLC | 0 | −100,00 | 0 | |||||
| 2025-08-07 | 13F | CENTRAL TRUST Co | 1 664 | 0,00 | 174 | 3,57 | ||||
| 2025-08-13 | 13F | Royal Fund Management, LLC | 2 990 | 0,44 | 313 | 3,31 | ||||
| 2025-07-07 | 13F | Nova Wealth Management, Inc. | 1 802 | −2,44 | 188 | 0,53 | ||||
| 2025-08-11 | 13F | Wealthspire Advisors, LLC | 0 | −100,00 | 0 | |||||
| 2025-07-28 | 13F | Mutual Advisors, LLC | 6 591 | 3,71 | 712 | 11,42 | ||||
| 2025-08-11 | 13F | Midwest Professional Planners, LTD. | 28 188 | 1,38 | 2 948 | 4,54 | ||||
| 2025-05-14 | 13F | Renaissance Technologies Llc | 0 | −100,00 | 0 | |||||
| 2025-07-21 | 13F | Yeomans Consulting Group, Inc. | 9 616 | 1 008 | ||||||
| 2025-08-05 | 13F | Cherry Tree Wealth Management, LLC | 356 | 0,00 | 37 | 2,78 | ||||
| 2025-08-12 | 13F | LPL Financial LLC | 313 133 | 21,44 | 32 744 | 25,21 | ||||
| 2025-07-11 | 13F | Grant Private Wealth Management Inc | 0 | −100,00 | 0 | |||||
| 2025-08-07 | 13F | Blackston Financial Advisory Group, LLC | 2 356 | −9,00 | 246 | −6,11 | ||||
| 2025-07-14 | 13F | Sowell Financial Services LLC | 11 302 | −3,78 | 1 182 | −0,84 | ||||
| 2025-08-06 | 13F | Rps Advisory Solutions Llc | 0 | −100,00 | 0 | |||||
| 2025-08-06 | 13F | Columbia River Financial Group, LLC | 0 | −100,00 | 0 | |||||
| 2025-08-06 | 13F | Washington Trust Bank | 2 466 | 0,00 | 258 | 2,80 | ||||
| 2025-08-15 | 13F | Tower Research Capital LLC (TRC) | 13 727 | 1 435 | ||||||
| 2025-05-15 | 13F | StoneX Group Inc. | 0 | −100,00 | 0 | −100,00 | ||||
| 2025-04-29 | 13F | Concurrent Investment Advisors, LLC | 0 | −100,00 | 0 | |||||
| 2025-07-14 | 13F | Armstrong Advisory Group, Inc | 46 | 5 | ||||||
| 2025-08-11 | 13F | Strategic Wealth Partners, Ltd. | 566 | 59 | ||||||
| 2025-08-12 | 13F | Global Retirement Partners, LLC | 171 | 0,00 | 18 | 6,25 | ||||
| 2025-07-31 | 13F | Cornerstone Management, Inc. | 2 559 | 268 | ||||||
| 2025-08-11 | 13F | Lighthouse Financial LLC | 3 500 | 0,00 | 366 | 3,11 | ||||
| 2025-07-18 | 13F | SOA Wealth Advisors, LLC. | 544 | 0,00 | 57 | 1,82 | ||||
| 2025-08-12 | 13F | Clal Insurance Enterprises Holdings Ltd | 15 000 | 0,00 | 2 | 0,00 | ||||
| 2025-08-14 | 13F | Comerica Bank | 11 354 | 49,81 | 1 187 | 54,56 | ||||
| 2025-08-01 | 13F | Brookwood Investment Group LLC | 4 139 | −2,41 | 433 | 0,47 | ||||
| 2025-05-02 | 13F | Wealthfront Advisers Llc | 0 | −100,00 | 0 | −100,00 | ||||
| 2025-05-16 | 13F | Coppell Advisory Solutions LLC | 0 | −100,00 | 0 | |||||
| 2025-07-30 | 13F | Atlantic Edge Private Wealth Management, LLC | 1 475 | 0,00 | 154 | 3,36 | ||||
| 2025-07-23 | 13F | Armstrong, Fleming & Moore, Inc | 0 | −100,00 | 0 | |||||
| 2025-05-14 | 13F | Fisher Asset Management, LLC | 0 | −100,00 | 0 | |||||
| 2025-07-10 | 13F | Security National Bank | 500 | 0,00 | 52 | 4,00 | ||||
| 2025-07-07 | 13F | Versant Capital Management, Inc | 22 | 4,76 | 2 | 0,00 | ||||
| 2025-08-11 | 13F | Bellwether Advisors, LLC | 29 | 0,00 | 3 | 50,00 | ||||
| 2025-07-30 | 13F | Brookstone Capital Management | 3 325 | 9,34 | 348 | 12,66 | ||||
| 2025-08-12 | 13F | Steward Partners Investment Advisory, Llc | 28 575 | 89,10 | 2 988 | 95,04 | ||||
| 2025-07-15 | 13F | North Star Investment Management Corp. | 2 458 | 0,00 | 257 | 3,21 | ||||
| 2025-07-18 | 13F | TPG Advisors LLC | 2 245 | 0,00 | 235 | 3,08 | ||||
| 2025-08-08 | 13F | Croban | 30 532 | 1,19 | 3 193 | 4,31 | ||||
| 2025-07-16 | 13F | St Germain D J Co Inc | 233 | −22,33 | 24 | −20,00 | ||||
| 2025-08-07 | 13F | Commerce Bank | 2 595 | 12,63 | 271 | 16,31 | ||||
| 2025-08-14 | 13F | Two Sigma Investments, Lp | 0 | −100,00 | 0 | |||||
| 2025-05-15 | 13F | Glenmede Trust Co Na | 700 | −50,00 | 71 | −47,76 | ||||
| 2025-07-07 | 13F | First Citizens Financial Corp | 17 961 | −13,35 | 1 878 | −10,66 | ||||
| 2025-08-14 | 13F | Mercer Global Advisors Inc /adv | 5 514 | 6,90 | 577 | 10,13 | ||||
| 2025-07-16 | 13F | BOS Asset Management, LLC | 18 231 | −5,52 | 1 906 | −2,61 | ||||
| 2025-08-11 | 13F | Synergy Investment Management, LLC | 0 | −100,00 | 0 |