Grundläggande statistik
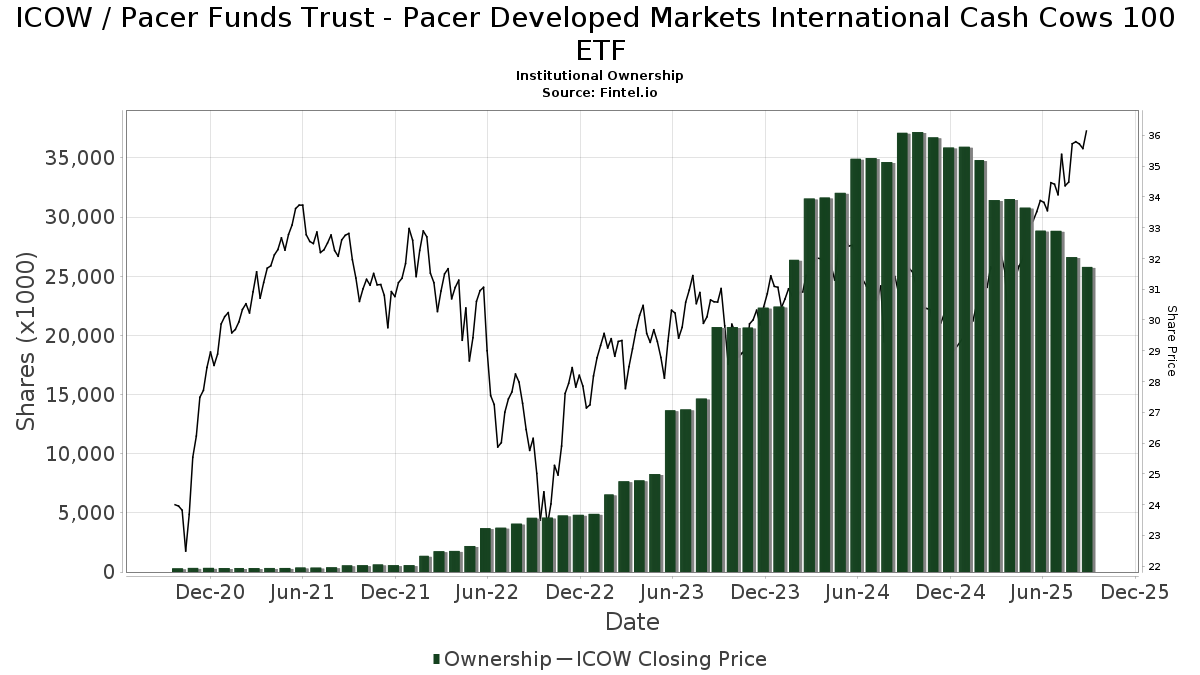
| Institutionella ägare | 157 total, 157 long only, 0 short only, 0 long/short - change of 0,64% MRQ |
| Genomsnittlig portföljallokering | 0.4397 % - change of −10,17% MRQ |
| Institutionella aktier (lång) | 25 789 798 (ex 13D/G) - change of −3,06MM shares −10,62% MRQ |
| Institutionellt värde (lång) | $ 853 410 USD ($1000) |
Institutionellt ägande och aktieägare
Pacer Funds Trust - Pacer Developed Markets International Cash Cows 100 ETF (US:ICOW) har 157 Institutionella ägare och aktieägare som har lämnat in 13D/G- eller 13F-formulär till Securities Exchange Commission (SEC). Dessa institut innehar totalt 25,789,798 aktier. Största aktieägare inkluderar Bank Of America Corp /de/, Morgan Stanley, Wells Fargo & Company/mn, UBS Group AG, Sequoia Financial Advisors, LLC, LPL Financial LLC, Northwestern Mutual Wealth Management Co, Sepio Capital, LP, Baird Financial Group, Inc., and Cetera Investment Advisers .
Pacer Funds Trust - Pacer Developed Markets International Cash Cows 100 ETF (BATS:ICOW) Institutionell ägarstruktur visar institutioners och fonders nuvarande positioner i företaget, samt de senaste förändringarna i positionernas storlek. Större aktieägare kan vara enskilda investerare, fonder, hedgefonder eller institutioner. Bilaga 13D visar att investeraren äger (eller ägde) mer än 5% av företaget och avser (eller avsåg) att aktivt eftersträva en förändring av affärsstrategin. Schedule 13G indikerar en passiv investering på över 5%.
The share price as of September 12, 2025 is 36,30 / share. Previously, on September 13, 2024, the share price was 30,83 / share. This represents an increase of 17,73% over that period.
Fondsentimentets poäng
Fondsentimentet poängen(fka Ägarackumulation-poäng) visar vilka aktier som är mest köpta av fonder. Det är resultatet av en sofistikerad kvantitativ flerfaktormodell som identifierar företag med de högsta nivåerna av institutionell ackumulering. Poängsättningsmodellen använder en kombination av den totala ökningen av redovisade ägare, förändringarna i portföljallokeringarna för dessa ägare och andra mått. Siffran sträcker sig från 0 till 100, där högre siffror indikerar en högre nivå av ackumulering i förhållande till sina konkurrenter, och 50 är genomsnittet.
Uppdateringsfrekvens: Dagligen
Se Ownership Explorer, som innehåller en lista över de högst rankade företagen.
Institutionell sälj/köp-kvot
Förutom att rapportera vanliga eget kapital- och skuldemissioner måste institutioner med mer än 100MM tillgångar under förvaltning också avslöja sina innehav av sälj- och köpoptioner. Eftersom säljoptioner i allmänhet indikerar ett negativt sentiment och köpoptioner indikerar ett positivt sentiment, kan vi få en uppfattning om det övergripande institutionella sentimentet genom att plotta förhållandet mellan säljoptioner och köpoptioner. Diagrammet till höger visar det historiska förhållandet mellan sälj- och köpoptioner för detta instrument.
Genom att använda sälj/köp-kvoten som en indikator på aktieägarnas sentiment undviker man en av de största bristerna med att använda det totala institutionella ägandet, nämligen att en betydande del av de förvaltade tillgångarna investeras passivt för att följa index. Passivt förvaltade fonder köper vanligtvis inte optioner, så indikatorn för sälj/köp-kvoten ger en bättre bild av stämningen i aktivt förvaltade fonder.
13F- och NPORT-arkiveringar
Detaljer om 13F-arkiveringar är gratis. Detaljer om NP-arkiveringar kräver ett premiummedlemskap. Gröna rader indikerar nya positioner. Röda rader indikerar stängda positioner. Klicka på länk symbolen för att se hela transaktionshistoriken.
Uppgradera
för att låsa upp premiumdata och exportera till Excel ![]() .
.
| Fil Datum | Källa | Investerare | Typ | Genomsnittligt pris (beräknat) |
Aktier | Δ Aktier (%) |
Rapporterat värde (1000 USD) |
Δ Värde (%) |
Portföljallokering (%) |
|
|---|---|---|---|---|---|---|---|---|---|---|
| 2025-08-14 | 13F | Susquehanna International Group, Llp | 130 624 | 4 445 | ||||||
| 2025-08-04 | 13F | Pensionmark Financial Group, Llc | 30 926 | 3,21 | 1 052 | 11,80 | ||||
| 2025-07-18 | 13F | QTR Family Wealth, LLC | 7 597 | −1,72 | 259 | 6,61 | ||||
| 2025-08-13 | 13F | EverSource Wealth Advisors, LLC | 493 | 0,61 | 17 | 6,67 | ||||
| 2025-08-15 | 13F | Captrust Financial Advisors | 75 588 | −0,99 | 2 572 | 7,30 | ||||
| 2025-08-11 | 13F | Principal Securities, Inc. | 1 230 | −44,84 | 42 | −36,92 | ||||
| 2025-08-14 | 13F | Modern Wealth Management, LLC | 335 184 | 2,22 | 11 406 | 10,75 | ||||
| 2025-05-14 | 13F | PKS Advisory Services, LLC | 0 | −100,00 | 0 | |||||
| 2025-08-08 | 13F | Pnc Financial Services Group, Inc. | 2 166 | 0,00 | 74 | 7,35 | ||||
| 2025-07-11 | 13F | Caldwell Securities, Inc | 4 055 | 31,19 | 138 | 41,24 | ||||
| 2025-08-14 | 13F | Comerica Bank | 39 462 | 27,42 | 1 343 | 38,07 | ||||
| 2025-07-16 | 13F | One + One Wealth Management, Llc | 146 636 | 54,38 | 4 990 | 67,28 | ||||
| 2025-07-31 | 13F | B & T Capital Management DBA Alpha Capital Management | 0 | −100,00 | 0 | |||||
| 2025-08-12 | 13F | BlackRock, Inc. | 6 256 | 213 | ||||||
| 2025-08-14 | 13F | Qube Research & Technologies Ltd | 15 824 | −7,19 | 538 | 0,56 | ||||
| 2025-05-15 | 13F | Hilltop Holdings Inc. | 0 | −100,00 | 0 | −100,00 | ||||
| 2025-08-08 | 13F | TD Capital Management LLC | 305 | 0,99 | 10 | 11,11 | ||||
| 2025-07-16 | 13F | Instrumental Wealth, Llc | 10 160 | −4,65 | 345 | 2,08 | ||||
| 2025-04-21 | 13F | Trivant Custom Portfolio Group, LLC | 0 | −100,00 | 0 | −100,00 | ||||
| 2025-05-15 | 13F | Two Sigma Securities, Llc | 0 | −100,00 | 0 | |||||
| 2025-08-13 | 13F | National Bank Of Canada /fi/ | 0 | −100,00 | 0 | |||||
| 2025-08-15 | 13F | Kestra Advisory Services, LLC | 67 722 | −42,70 | 2 305 | −37,93 | ||||
| 2025-08-05 | 13F | BCGM Wealth Management, LLC | 6 036 | 205 | ||||||
| 2025-07-16 | 13F | Register Financial Advisors LLC | 260 | 0,00 | 9 | 0,00 | ||||
| 2025-07-30 | 13F | Brookstone Capital Management | 0 | −100,00 | 0 | |||||
| 2025-07-30 | 13F | Lionsbridge Wealth Management LLC | 9 252 | −1,78 | 315 | 6,44 | ||||
| 2025-07-31 | 13F | FSM Wealth Advisors, LLC | 10 091 | 341 | ||||||
| 2025-08-18 | 13F | Geneos Wealth Management Inc. | 5 725 | 35,50 | 195 | 46,97 | ||||
| 2025-08-01 | 13F | American Financial & Tax Strategies Inc | 98 644 | 2,24 | 3 357 | 10,76 | ||||
| 2025-08-04 | 13F | Savvy Advisors, Inc. | 7 941 | −23,58 | 270 | −17,18 | ||||
| 2025-07-18 | 13F | Bridge Generations Wealth Management Llc | 0 | −100,00 | 0 | |||||
| 2025-07-23 | 13F | Tcfg Wealth Management, Llc | 10 761 | −0,51 | 366 | 7,96 | ||||
| 2025-08-14 | 13F | Bnp Paribas Arbitrage, Sa | 0 | −100,00 | 0 | |||||
| 2025-08-06 | 13F | Legacy Investment Solutions, LLC | 4 177 | 142 | ||||||
| 2025-09-04 | 13F/A | Advisor Group Holdings, Inc. | 302 189 | −38,79 | 10 287 | −33,68 | ||||
| 2025-08-12 | 13F | Proequities, Inc. | 0 | 0 | ||||||
| 2025-08-04 | 13F | Hantz Financial Services, Inc. | 96 | 0 | ||||||
| 2025-08-11 | 13F | Strategic Wealth Partners, Ltd. | 22 | 1 | ||||||
| 2025-04-17 | 13F | FNY Investment Advisers, LLC | 0 | −100,00 | 0 | |||||
| 2025-08-14 | 13F | D. E. Shaw & Co., Inc. | 10 055 | −22,80 | 343 | −16,38 | ||||
| 2025-07-11 | 13F | Farther Finance Advisors, LLC | 8 914 | 14 756,67 | 303 | 30 200,00 | ||||
| 2025-07-28 | 13F | Copia Wealth Management | 1 586 | 54,13 | 54 | 65,63 | ||||
| 2025-08-14 | 13F | Mml Investors Services, Llc | 70 576 | −43,08 | 2 | −33,33 | ||||
| 2025-08-14 | 13F | Hrt Financial Lp | 0 | −100,00 | 0 | |||||
| 2025-05-07 | 13F | Inspire Advisors, LLC | 0 | −100,00 | 0 | |||||
| 2025-08-12 | 13F | O'shaughnessy Asset Management, Llc | 4 214 | −46,81 | 143 | −42,34 | ||||
| 2025-04-22 | 13F | Synergy Financial Management, LLC | 0 | −100,00 | 0 | |||||
| 2025-07-09 | 13F | Channel Wealth Llc | 102 109 | −18,66 | 3 475 | −11,87 | ||||
| 2025-08-07 | 13F | American Alpha Advisors, LLC | 135 463 | 335,12 | 4 610 | 371,75 | ||||
| 2025-08-11 | 13F | TRUE Private Wealth Advisors | 43 166 | 1 469 | ||||||
| 2025-07-18 | 13F | Trilogy Capital Inc. | 0 | −100,00 | 0 | |||||
| 2025-08-13 | 13F | Baird Financial Group, Inc. | 606 666 | −17,17 | 20 645 | −10,27 | ||||
| 2025-07-29 | 13F | Activest Wealth Management | 0 | 0 | ||||||
| 2025-08-01 | 13F | Envestnet Asset Management Inc | 229 844 | 0,82 | 7 822 | 9,23 | ||||
| 2025-08-08 | 13F | MTM Investment Management, LLC | 165 | 0,00 | 6 | 0,00 | ||||
| 2025-07-25 | 13F | Commonwealth Financial Services, LLC | 209 650 | 7,04 | 7 134 | 15,98 | ||||
| 2025-07-23 | 13F | Fortis Advisors, LLC | 151 857 | 0,97 | 5 168 | 9,38 | ||||
| 2025-07-30 | 13F | Castle Wealth Management Llc | 0 | −100,00 | 0 | |||||
| 2025-05-14 | 13F | Renaissance Technologies Llc | 0 | −100,00 | 0 | |||||
| 2025-08-11 | 13F | NewEdge Wealth, LLC | 10 039 | −2,76 | 349 | 7,41 | ||||
| 2025-07-17 | 13F | Janney Montgomery Scott LLC | 21 430 | 0,41 | 1 | |||||
| 2025-08-12 | 13F/A | Cozad Asset Management Inc | 55 393 | 2,80 | 1 885 | 11,41 | ||||
| 2025-07-09 | 13F | Fermata Advisors, LLC | 0 | −100,00 | 0 | |||||
| 2025-07-22 | 13F | SOL Capital Management CO | 6 450 | 0 | ||||||
| 2025-08-07 | 13F | Verus Capital Partners, Llc | 60 656 | 1,47 | 2 064 | 9,96 | ||||
| 2025-08-14 | 13F | Mariner, LLC | 6 483 | 221 | ||||||
| 2025-08-12 | 13F | Pacer Advisors, Inc. | 522 260 | −16,28 | 17 773 | −9,29 | ||||
| 2025-08-06 | 13F | AE Wealth Management LLC | 1 784 | 3,72 | 61 | 11,11 | ||||
| 2025-07-14 | 13F | Opal Wealth Advisors, LLC | 5 833 | −6,19 | 198 | 1,54 | ||||
| 2025-08-12 | 13F | Jpmorgan Chase & Co | 18 633 | −21,37 | 634 | −14,78 | ||||
| 2025-08-12 | 13F | SRS Capital Advisors, Inc. | 0 | −100,00 | 0 | |||||
| 2025-08-27 | 13F/A | Brinker Capital Investments, LLC | 102 960 | 928,26 | 3 504 | 1 015,61 | ||||
| 2025-08-11 | 13F | Summit Wealth Partners, LLC | 83 649 | 0,45 | 2 847 | 8,83 | ||||
| 2025-08-12 | 13F | AlphaCore Capital LLC | 469 434 | 10,22 | 15 975 | 19,40 | ||||
| 2025-07-23 | 13F | Clear Creek Financial Management, LLC | 0 | −100,00 | 0 | |||||
| 2025-08-13 | 13F | Russell Investments Group, Ltd. | 77 | 3 | ||||||
| 2025-07-24 | 13F | IFP Advisors, Inc | 813 | 0,12 | 28 | 8,00 | ||||
| 2025-08-13 | 13F | Flow Traders U.s. Llc | 17 241 | 1 | ||||||
| 2025-08-05 | 13F | Atlas Wealth Partners, LLC | 7 258 | 0,33 | 0 | |||||
| 2025-08-06 | 13F | Commonwealth Equity Services, Llc | 354 471 | −7,79 | 12 | 0,00 | ||||
| 2025-07-29 | 13F | Fundamentun, Llc | 327 540 | 8,08 | 11 146 | 17,09 | ||||
| 2025-08-08 | 13F | Larson Financial Group LLC | 266 | 0,38 | 9 | 12,50 | ||||
| 2025-08-13 | 13F | Sepio Capital, LP | 819 867 | 6,69 | 27 900 | 15,59 | ||||
| 2025-07-30 | 13F | Syntegra Private Wealth Group, LLC | 50 738 | −97,04 | 1 727 | −96,79 | ||||
| 2025-08-12 | 13F | Leigh Baldwin & Co., Llc | 10 321 | −77,58 | 351 | −75,73 | ||||
| 2025-08-15 | 13F | CI Private Wealth, LLC | 23 040 | 784 | ||||||
| 2025-08-12 | 13F | Steward Partners Investment Advisory, Llc | 44 699 | 0,13 | 1 521 | 8,49 | ||||
| 2025-06-30 | NP | HERD - Pacer Cash Cows Fund of Funds ETF | 534 129 | −14,37 | 16 959 | −9,21 | ||||
| 2025-04-28 | 13F | Smart Money Group LLC | 0 | −100,00 | 0 | |||||
| 2025-08-15 | 13F | Equitable Holdings, Inc. | 70 722 | 2,91 | 2 407 | 11,49 | ||||
| 2025-07-01 | 13F | Private Client Services, Llc | 88 447 | 540,46 | 3 010 | 594,92 | ||||
| 2025-07-31 | 13F | Cambridge Investment Research Advisors, Inc. | 201 322 | 102,88 | 7 | 100,00 | ||||
| 2025-08-12 | 13F | LPL Financial LLC | 1 133 786 | 10,00 | 38 583 | 19,18 | ||||
| 2025-08-14 | 13F | GWM Advisors LLC | 72 426 | 0,20 | 2 465 | 8,55 | ||||
| 2025-07-22 | 13F | DAVENPORT & Co LLC | 13 557 | −58,82 | 461 | −55,42 | ||||
| 2025-07-31 | 13F | Longview Financial Advisors, Inc. | 353 383 | 0,17 | 12 026 | 8,53 | ||||
| 2025-08-06 | 13F | Ethos Financial Group, LLC | 7 209 | 0,00 | 245 | 8,41 | ||||
| 2025-07-21 | 13F | Ameritas Advisory Services, LLC | 1 521 | 52 | ||||||
| 2025-07-10 | 13F | Wealth Enhancement Advisory Services, Llc | 379 723 | 5,42 | 13 089 | 15,69 | ||||
| 2025-08-14 | 13F | Fmr Llc | 579 | −67,01 | 20 | −65,45 | ||||
| 2025-07-14 | 13F | Farmers & Merchants Investments Inc | 0 | −100,00 | 0 | |||||
| 2025-07-29 | 13F | Salomon & Ludwin, LLC | 190 | −49,87 | 7 | −45,45 | ||||
| 2025-07-28 | 13F | WealthPLAN Partners, LLC | 83 522 | −43,00 | 2 842 | −38,24 | ||||
| 2025-08-11 | 13F | Citigroup Inc | 119 334 | 1 118,07 | 4 061 | 1 222,48 | ||||
| 2025-07-15 | 13F | Unified Investment Management | 20 741 | 0,02 | 706 | 8,29 | ||||
| 2025-08-12 | 13F | Change Path, LLC | 12 663 | 431 | ||||||
| 2025-08-11 | 13F | Lake Street Financial Llc | 23 867 | 4,51 | 812 | 13,25 | ||||
| 2025-08-11 | 13F | Nations Financial Group Inc, /ia/ /adv | 51 081 | 1,34 | 1 738 | 9,79 | ||||
| 2025-08-14 | 13F | Bank Of America Corp /de/ | 3 574 610 | 18,73 | 121 644 | 28,63 | ||||
| 2025-04-23 | 13F | Crewe Advisors LLC | 0 | −100,00 | 0 | |||||
| 2025-08-05 | 13F | 5T Wealth, LLC | 14 352 | −19,73 | 488 | −13,01 | ||||
| 2025-07-25 | 13F | Sequoia Financial Advisors, LLC | 1 507 162 | 1,07 | 51 289 | 9,50 | ||||
| 2025-08-13 | 13F | Capital Analysts, Inc. | 209 | 0 | ||||||
| 2025-08-05 | 13F | Key FInancial Inc | 21 625 | −6,34 | 736 | 1,38 | ||||
| 2025-08-12 | 13F | Cornerstone Wealth Management, LLC | 15 882 | −1,20 | 540 | 7,14 | ||||
| 2025-08-04 | 13F | HBK Sorce Advisory LLC | 6 112 | 208 | ||||||
| 2025-07-30 | 13F | Insight Advisors, LLC/ PA | 78 773 | −14,81 | 2 681 | −7,71 | ||||
| 2025-08-13 | 13F | Dana Investment Advisors, Inc. | 10 488 | 7,20 | 357 | 15,96 | ||||
| 2025-07-22 | 13F | Wealthcare Advisory Partners LLC | 36 017 | 15,68 | 1 226 | 25,38 | ||||
| 2025-08-14 | 13F | UBS Group AG | 1 553 379 | −7,00 | 52 861 | 0,76 | ||||
| 2025-07-15 | 13F | BigSur Wealth Management LLC | 51 978 | −4,63 | 1 769 | 3,33 | ||||
| 2025-07-28 | 13F | WealthPlan Investment Management, LLC | 181 869 | 56,86 | 6 189 | 69,98 | ||||
| 2025-07-18 | 13F | Madrona Financial Services, LLC | 0 | −100,00 | 0 | |||||
| 2025-08-14 | 13F | Certified Advisory Corp | 0 | −100,00 | 0 | |||||
| 2025-08-08 | 13F | Avantax Advisory Services, Inc. | 83 953 | 13,57 | 2 857 | 23,05 | ||||
| 2025-07-16 | 13F | Wealth Group Ltd | 459 704 | −30,40 | 15 644 | −24,60 | ||||
| 2025-07-22 | 13F | IVC Wealth Advisors LLC | 15 077 | 9,74 | 513 | 19,03 | ||||
| 2025-08-14 | 13F/A | Rockefeller Capital Management L.P. | 97 613 | −0,07 | 3 322 | 8,25 | ||||
| 2025-08-06 | 13F | Capasso Planning Partners LLC | 21 202 | −30,25 | 722 | −24,42 | ||||
| 2025-08-06 | 13F | Legacy Wealth Managment, LLC/ID | 4 177 | −25,00 | 142 | −18,39 | ||||
| 2025-08-07 | 13F | Kestra Private Wealth Services, Llc | 11 245 | 383 | ||||||
| 2025-07-14 | 13F | Gries Financial Llc | 6 319 | −16,39 | 215 | −9,28 | ||||
| 2025-08-13 | 13F | Northwestern Mutual Wealth Management Co | 1 016 059 | −5,32 | 34 576 | 2,58 | ||||
| 2025-08-14 | 13F | Wells Fargo & Company/mn | 2 122 735 | 13,31 | 72 237 | 22,76 | ||||
| 2025-08-19 | 13F | Anchor Investment Management, LLC | 911 | 0,11 | 31 | 10,71 | ||||
| 2025-08-14 | 13F | Ausdal Financial Partners, Inc. | 27 336 | −5,92 | 930 | 1,97 | ||||
| 2025-08-13 | 13F | Twin Peaks Wealth Advisors, LLC | 3 981 | 141 | ||||||
| 2025-08-06 | 13F | Moors & Cabot, Inc. | 49 478 | 18,95 | 1 684 | 28,87 | ||||
| 2025-05-15 | 13F | Citadel Advisors Llc | 0 | −100,00 | 0 | |||||
| 2025-05-01 | 13F | Secured Retirement Advisors, Llc | 0 | −100,00 | 0 | |||||
| 2025-08-13 | 13F | Empire Financial Management Company, LLC | 6 432 | −3,10 | 219 | 4,81 | ||||
| 2025-08-12 | 13F | CIBC Private Wealth Group, LLC | 2 665 | 0,00 | 91 | 21,62 | ||||
| 2025-07-22 | 13F | Kraematon Investment Advisors, Inc | 9 530 | 0,22 | 324 | 8,72 | ||||
| 2025-08-15 | 13F | Morgan Stanley | 2 241 209 | 2,99 | 76 268 | 11,58 | ||||
| 2025-08-13 | 13F | Trustmark National Bank Trust Department | 146 463 | 82,88 | 4 984 | 98,17 | ||||
| 2025-07-29 | 13F | Signature Estate & Investment Advisors Llc | 6 912 | 3,40 | 235 | 12,44 | ||||
| 2025-05-15 | 13F/A | Orion Portfolio Solutions, LLC | 10 013 | 315 | ||||||
| 2025-07-17 | 13F | Saxon Interests, Inc. | 7 157 | 0,00 | 225 | 0,00 | ||||
| 2025-04-11 | 13F | Holland Advisory Services, Inc. | 0 | −100,00 | 0 | |||||
| 2025-07-21 | 13F | DHJJ Financial Advisors, Ltd. | 98 | 1,03 | 3 | 0,00 | ||||
| 2025-08-14 | 13F | CIBC World Markets Inc. | 21 435 | 78,05 | 729 | 92,86 | ||||
| 2025-07-28 | 13F | Harbour Investments, Inc. | 812 | 0,00 | 28 | 8,00 | ||||
| 2025-08-14 | 13F | Benjamin Edwards Inc | 7 031 | 0,00 | 239 | 8,64 | ||||
| 2025-08-12 | 13F | Global Retirement Partners, LLC | 0 | −100,00 | 0 | |||||
| 2025-08-14 | 13F | Jane Street Group, Llc | 122 348 | 4 164 | ||||||
| 2025-08-11 | 13F | Avantax Planning Partners, Inc. | 21 953 | 0,03 | 747 | 8,42 | ||||
| 2025-08-14 | 13F | Raymond James Financial Inc | 511 436 | −1,94 | 17 404 | 6,25 | ||||
| 2025-07-28 | 13F | RFG Advisory, LLC | 7 045 | −15,26 | 240 | −8,43 | ||||
| 2025-08-04 | 13F | WNY Asset Management, LLC | 45 280 | −7,61 | 1 541 | 0,06 | ||||
| 2025-08-14 | 13F | Graham Capital Management, L.P. | 0 | −100,00 | 0 | |||||
| 2025-07-08 | 13F | Next Level Private LLC | 11 960 | −0,76 | 407 | 7,67 | ||||
| 2025-08-07 | 13F | Allworth Financial LP | 65 | 1,56 | 2 | 0,00 | ||||
| 2025-08-14 | 13F | Fortress Private Ledger, Llc | 5 914 | 201 | ||||||
| 2025-07-17 | 13F | ERn Financial, LLC | 9 112 | −17,42 | 310 | −10,40 | ||||
| 2025-07-29 | 13F | Private Trust Co Na | 0 | −100,00 | 0 | |||||
| 2025-07-30 | 13F | Bleakley Financial Group, LLC | 96 380 | −1,10 | 3 280 | 7,16 | ||||
| 2025-08-14 | 13F | Stifel Financial Corp | 85 052 | 0,54 | 2 894 | 8,92 | ||||
| 2025-07-25 | 13F | Atria Wealth Solutions, Inc. | 13 154 | −74,05 | 448 | −71,92 | ||||
| 2025-07-30 | 13F | BlueChip Wealth Advisors LLC | 7 445 | 0,00 | 253 | 8,58 | ||||
| 2025-08-08 | 13F | Cetera Investment Advisers | 545 541 | 3,76 | 18 565 | 12,41 | ||||
| 2025-07-30 | 13F | Onyx Bridge Wealth Group LLC | 41 310 | −83,59 | 1 406 | −82,23 | ||||
| 2025-08-04 | 13F | Creative Financial Designs Inc /adv | 329 | 0,61 | 11 | 10,00 | ||||
| 2025-07-24 | 13F | Us Bancorp \de\ | 31 | −95,23 | 1 | −95,00 | ||||
| 2025-07-21 | 13F | Barrett & Company, Inc. | 18 242 | 0,06 | 621 | 8,39 | ||||
| 2025-08-04 | 13F | Amplius Wealth Advisors, LLC | 163 302 | −12,04 | 5 557 | −4,70 | ||||
| 2025-07-16 | 13F | Investment Partners Asset Management, Inc. | 32 623 | 0,18 | 1 110 | 8,61 | ||||
| 2025-07-29 | 13F | Stratos Wealth Advisors, LLC | 0 | −100,00 | 0 | |||||
| 2025-08-05 | 13F | Tsfg, Llc | 132 | 0,76 | 0 | |||||
| 2025-08-11 | 13F | HighTower Advisors, LLC | 356 245 | 1,60 | 12 123 | 10,08 | ||||
| 2025-08-13 | 13F | Per Stirling Capital Management, LLC. | 0 | −100,00 | 0 | |||||
| 2025-07-03 | 13F | Fiduciary Financial Group, Llc | 8 119 | 15,92 | 278 | 37,13 | ||||
| 2025-08-04 | 13F | Assetmark, Inc | 200 | 0,00 | 7 | 0,00 | ||||
| 2025-06-27 | 13F | Copley Financial Group, Inc. | 666 | 0,00 | 19 | 0,00 | ||||
| 2025-08-06 | 13F | Rps Advisory Solutions Llc | 0 | −100,00 | 0 | |||||
| 2025-07-15 | 13F | Fifth Third Bancorp | 1 102 | 38 | ||||||
| 2025-07-11 | 13F | Pinnacle Bancorp, Inc. | 425 | 0,00 | 14 | 7,69 | ||||
| 2025-08-14 | 13F | Royal Bank Of Canada | 484 831 | 7,08 | 16 499 | 16,01 | ||||
| 2025-08-19 | 13F | Advisory Services Network, LLC | 25 215 | 34,32 | 859 | 45,84 | ||||
| 2025-08-08 | 13F | Foundations Investment Advisors, LLC | 215 111 | 8,68 | 7 320 | 17,76 | ||||
| 2025-08-13 | 13F | Jones Financial Companies Lllp | 239 264 | 24,78 | 8 149 | 33,88 | ||||
| 2025-08-14 | 13F | Tripletail Wealth Management, LLC | 25 857 | 905 | ||||||
| 2025-08-01 | 13F | Anson Capital, Inc. | 168 882 | −4,91 | 5 747 | 3,03 | ||||
| 2025-04-24 | 13F | CWC Advisors, LLC. | 0 | −100,00 | 0 |