Grundläggande statistik
| Institutionella ägare | 175 total, 175 long only, 0 short only, 0 long/short - change of −2,22% MRQ |
| Genomsnittlig portföljallokering | 0.1285 % - change of −10,96% MRQ |
| Institutionella aktier (lång) | 17 367 063 (ex 13D/G) - change of 0,38MM shares 2,22% MRQ |
| Institutionellt värde (lång) | $ 427 198 USD ($1000) |
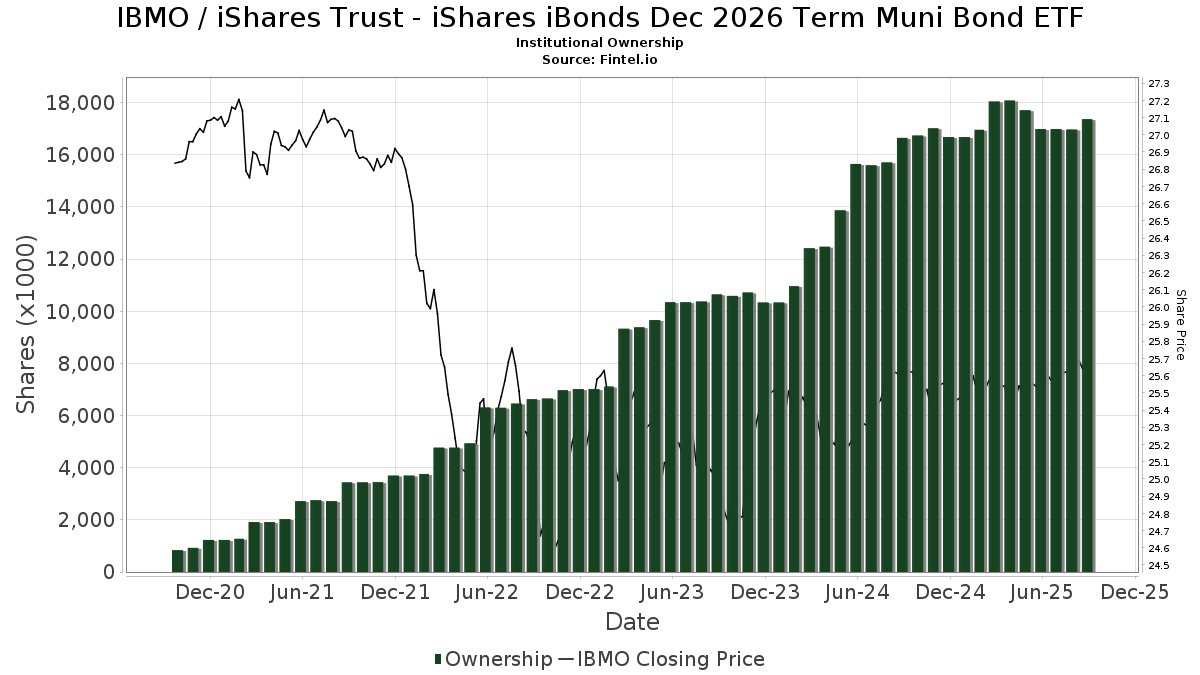
Institutionellt ägande och aktieägare
iShares Trust - iShares iBonds Dec 2026 Term Muni Bond ETF (US:IBMO) har 175 Institutionella ägare och aktieägare som har lämnat in 13D/G- eller 13F-formulär till Securities Exchange Commission (SEC). Dessa institut innehar totalt 17,367,063 aktier. Största aktieägare inkluderar Bank Of America Corp /de/, Mercer Global Advisors Inc /adv, Hartland & Co., LLC, Envestnet Asset Management Inc, Us Bancorp \de\, Morgan Stanley, GWM Advisors LLC, Wells Fargo & Company/mn, Kathmere Capital Management, LLC, and UBS Group AG .
iShares Trust - iShares iBonds Dec 2026 Term Muni Bond ETF (BATS:IBMO) Institutionell ägarstruktur visar institutioners och fonders nuvarande positioner i företaget, samt de senaste förändringarna i positionernas storlek. Större aktieägare kan vara enskilda investerare, fonder, hedgefonder eller institutioner. Bilaga 13D visar att investeraren äger (eller ägde) mer än 5% av företaget och avser (eller avsåg) att aktivt eftersträva en förändring av affärsstrategin. Schedule 13G indikerar en passiv investering på över 5%.
The share price as of September 10, 2025 is 25,69 / share. Previously, on September 11, 2024, the share price was 25,62 / share. This represents an increase of 0,27% over that period.
Fondsentimentets poäng
Fondsentimentet poängen(fka Ägarackumulation-poäng) visar vilka aktier som är mest köpta av fonder. Det är resultatet av en sofistikerad kvantitativ flerfaktormodell som identifierar företag med de högsta nivåerna av institutionell ackumulering. Poängsättningsmodellen använder en kombination av den totala ökningen av redovisade ägare, förändringarna i portföljallokeringarna för dessa ägare och andra mått. Siffran sträcker sig från 0 till 100, där högre siffror indikerar en högre nivå av ackumulering i förhållande till sina konkurrenter, och 50 är genomsnittet.
Uppdateringsfrekvens: Dagligen
Se Ownership Explorer, som innehåller en lista över de högst rankade företagen.
Institutionell sälj/köp-kvot
Förutom att rapportera vanliga eget kapital- och skuldemissioner måste institutioner med mer än 100MM tillgångar under förvaltning också avslöja sina innehav av sälj- och köpoptioner. Eftersom säljoptioner i allmänhet indikerar ett negativt sentiment och köpoptioner indikerar ett positivt sentiment, kan vi få en uppfattning om det övergripande institutionella sentimentet genom att plotta förhållandet mellan säljoptioner och köpoptioner. Diagrammet till höger visar det historiska förhållandet mellan sälj- och köpoptioner för detta instrument.
Genom att använda sälj/köp-kvoten som en indikator på aktieägarnas sentiment undviker man en av de största bristerna med att använda det totala institutionella ägandet, nämligen att en betydande del av de förvaltade tillgångarna investeras passivt för att följa index. Passivt förvaltade fonder köper vanligtvis inte optioner, så indikatorn för sälj/köp-kvoten ger en bättre bild av stämningen i aktivt förvaltade fonder.
13F- och NPORT-arkiveringar
Detaljer om 13F-arkiveringar är gratis. Detaljer om NP-arkiveringar kräver ett premiummedlemskap. Gröna rader indikerar nya positioner. Röda rader indikerar stängda positioner. Klicka på länk symbolen för att se hela transaktionshistoriken.
Uppgradera
för att låsa upp premiumdata och exportera till Excel ![]() .
.
| Fil Datum | Källa | Investerare | Typ | Genomsnittligt pris (beräknat) |
Aktier | Δ Aktier (%) |
Rapporterat värde (1000 USD) |
Δ Värde (%) |
Portföljallokering (%) |
|
|---|---|---|---|---|---|---|---|---|---|---|
| 2025-05-05 | 13F | Creekmur Asset Management LLC | 0 | −100,00 | 0 | |||||
| 2025-07-16 | 13F | Signaturefd, Llc | 8 988 | 0,00 | 230 | 0,44 | ||||
| 2025-08-04 | 13F | Atria Investments Llc | 38 536 | −16,99 | 987 | −16,78 | ||||
| 2025-08-04 | 13F | Spinnaker Trust | 47 700 | 5,80 | 1 222 | 6,08 | ||||
| 2025-08-14 | 13F | Mercer Global Advisors Inc /adv | 947 342 | 10,28 | 24 274 | 10,55 | ||||
| 2025-07-15 | 13F | Cora Capital Advisors Llc | 12 500 | 0,00 | 320 | 0,31 | ||||
| 2025-08-07 | 13F | Rossmore Private Capital | 11 736 | 0,00 | 301 | 0,33 | ||||
| 2025-08-12 | 13F | BlackRock, Inc. | 147 | 0,68 | 4 | 0,00 | ||||
| 2025-07-17 | 13F | Archford Capital Strategies, LLC | 16 384 | 3,65 | 420 | 3,71 | ||||
| 2025-07-29 | 13F | Stratos Wealth Partners, LTD. | 34 352 | −22,48 | 880 | −22,26 | ||||
| 2025-08-11 | 13F | United Capital Financial Advisers, Llc | 108 197 | 0,08 | 2 772 | 0,33 | ||||
| 2025-08-12 | 13F | Deutsche Bank Ag\ | 41 021 | 0,00 | 1 051 | 0,19 | ||||
| 2025-08-14 | 13F | Garden State Investment Advisory Services LLC | 0 | −100,00 | 0 | |||||
| 2025-07-07 | 13F | Trust Co | 13 708 | −0,01 | 351 | 0,29 | ||||
| 2025-07-22 | 13F | Partners Wealth Management, Llc | 11 489 | 0,00 | 293 | 0,00 | ||||
| 2025-07-16 | 13F | Evergreen Private Wealth LLC | 44 590 | −0,97 | 1 143 | −0,70 | ||||
| 2025-07-17 | 13F | Coastline Trust Co | 1 918 | 0,00 | 49 | 0,00 | ||||
| 2025-08-15 | 13F | Captrust Financial Advisors | 18 689 | −8,31 | 479 | −8,08 | ||||
| 2025-07-10 | 13F | Global Financial Private Client, LLC | 0 | −100,00 | 0 | |||||
| 2025-07-11 | 13F | Quantum Financial Advisors, LLC | 156 480 | 2,79 | 4 009 | 3,03 | ||||
| 2025-08-12 | 13F | Wealthbridge Capital Management, Llc | 15 433 | 5,27 | 395 | 5,61 | ||||
| 2025-08-15 | 13F | Morgan Stanley | 688 174 | 0,09 | 17 633 | 0,34 | ||||
| 2025-07-15 | 13F | Droms Strauss Advisors Inc /mo/ /adv | 11 714 | 3,52 | 300 | 3,81 | ||||
| 2025-08-14 | 13F | Susquehanna International Group, Llp | 0 | −100,00 | 0 | |||||
| 2025-07-09 | 13F | Praetorian Wealth Management, Inc. | 237 175 | 0,12 | 6 077 | 0,36 | ||||
| 2025-08-12 | 13F | Steward Partners Investment Advisory, Llc | 8 474 | 0,00 | 217 | 0,46 | ||||
| 2025-08-14 | 13F | Goldman Sachs Group Inc | 28 310 | 151,44 | 725 | 152,61 | ||||
| 2025-07-15 | 13F | Postrock Partners Llc | 38 416 | 3,64 | 984 | 3,91 | ||||
| 2025-08-12 | 13F | Covington Investment Advisors Inc. | 306 590 | 1,76 | 8 | 0,00 | ||||
| 2025-08-06 | 13F | Rialto Wealth Management, LLC | 965 | 0,00 | 25 | 0,00 | ||||
| 2025-08-01 | 13F | First National Trust Co | 9 949 | 12,63 | 255 | 12,89 | ||||
| 2025-08-14 | 13F | UBS Group AG | 447 469 | −4,57 | 11 465 | −4,34 | ||||
| 2025-04-11 | 13F | First Affirmative Financial Network | 19 444 | 4,22 | 497 | 4,64 | ||||
| 2025-07-01 | 13F | Harbor Investment Advisory, Llc | 3 656 | 0,00 | 94 | 0,00 | ||||
| 2025-08-11 | 13F | Summit Wealth Partners, LLC | 8 918 | 0,00 | 229 | 0,44 | ||||
| 2025-05-07 | 13F | HB Wealth Management, LLC | 0 | −100,00 | 0 | |||||
| 2025-05-14 | 13F | Evergreen Wealth Solutions, LLC | 0 | −100,00 | 0 | |||||
| 2025-08-14 | 13F | Benjamin Edwards Inc | 47 752 | −1,72 | 1 224 | −1,45 | ||||
| 2025-07-29 | 13F | Roof Eidam & Maycock/adv | 29 703 | 0,16 | 761 | 0,53 | ||||
| 2025-07-30 | 13F | Granite Harbor Advisors, Inc. | 44 803 | −7,30 | 1 148 | −7,13 | ||||
| 2025-07-11 | 13F | Financial Advisory Corp | 26 910 | 690 | ||||||
| 2025-08-13 | 13F | Beacon Pointe Advisors, LLC | 48 859 | −8,47 | 1 252 | −8,28 | ||||
| 2025-08-14 | 13F | Diversify Advisory Services, LLC | 8 140 | 0,78 | 209 | 0,97 | ||||
| 2025-08-06 | 13F | Commonwealth Equity Services, Llc | 149 722 | −2,51 | 4 | 0,00 | ||||
| 2025-08-14 | 13F | Jane Street Group, Llc | 82 820 | 159,18 | 2 122 | 160,05 | ||||
| 2025-08-07 | 13F | Allworth Financial LP | 802 | 0,00 | 21 | 0,00 | ||||
| 2025-07-23 | 13F | Valmark Advisers, Inc. | 63 358 | 8,77 | 1 623 | 9,07 | ||||
| 2025-07-16 | 13F | Kerntke Otto McGlone Wealth Management Group | 0 | −100,00 | 0 | |||||
| 2025-08-14 | 13F | Glen Eagle Advisors, LLC | 3 225 | 0,00 | 83 | 0,00 | ||||
| 2025-08-08 | 13F | Wrapmanager Inc | 13 881 | −4,37 | 356 | −4,31 | ||||
| 2025-07-22 | 13F | Woodmont Investment Counsel Llc | 65 336 | −0,60 | 1 674 | −0,36 | ||||
| 2025-08-05 | 13F | American Capital Advisory, LLC | 2 221 | 0,00 | 57 | 0,00 | ||||
| 2025-08-14 | 13F | Stifel Financial Corp | 131 227 | 4,87 | 3 362 | 5,13 | ||||
| 2025-08-14 | 13F | Integrated Wealth Concepts LLC | 336 583 | 3,47 | 8 624 | 3,73 | ||||
| 2025-08-14 | 13F | Wiley Bros.-aintree Capital, Llc | 15 130 | −25,92 | 388 | −21,66 | ||||
| 2025-08-13 | 13F | Northwestern Mutual Wealth Management Co | 287 385 | 6,92 | 7 364 | 7,18 | ||||
| 2025-08-14 | 13F | Raymond James Financial Inc | 204 997 | −28,16 | 5 253 | −27,99 | ||||
| 2025-08-14 | 13F | Colony Group, LLC | 65 243 | 8,80 | 1 672 | 9,07 | ||||
| 2025-08-01 | 13F | Envestnet Asset Management Inc | 878 008 | 0,52 | 22 497 | 0,77 | ||||
| 2025-07-31 | 13F | Cambridge Investment Research Advisors, Inc. | 33 963 | 119,31 | 1 | |||||
| 2025-08-12 | 13F | Ameritas Investment Partners, Inc. | 6 455 | −6,08 | 165 | −5,71 | ||||
| 2025-04-24 | 13F | Aspect Partners, LLC | 0 | −100,00 | 0 | |||||
| 2025-07-18 | 13F | Foundry Financial Group, Inc. | 39 977 | 0,10 | 1 024 | 0,39 | ||||
| 2025-07-23 | 13F | Beaumont Asset Management, L.L.C. | 8 320 | 213 | ||||||
| 2025-05-15 | 13F/A | Orion Portfolio Solutions, LLC | 44 564 | 438,80 | 1 139 | 442,38 | ||||
| 2025-07-25 | 13F | Commonwealth Financial Services, LLC | 13 655 | −3,12 | 350 | −3,06 | ||||
| 2025-07-21 | 13F | Cornell Pochily Investment Advisors, Inc. | 7 935 | 203 | ||||||
| 2025-08-14 | 13F | Wells Fargo & Company/mn | 503 073 | 2,03 | 12 890 | 2,29 | ||||
| 2025-07-16 | 13F | Novem Group | 21 753 | 1,13 | 557 | 1,46 | ||||
| 2025-04-15 | 13F | Members Wealth Llc | 22 406 | 3,64 | 573 | 3,81 | ||||
| 2025-08-05 | 13F | Hills Bank & Trust Co | 383 212 | 17,75 | 9 819 | 18,05 | ||||
| 2025-08-14 | 13F | STAR Financial Bank | 0 | −100,00 | 0 | |||||
| 2025-08-19 | 13F | Asset Dedication, LLC | 9 282 | 0,00 | 238 | 0,00 | ||||
| 2025-09-04 | 13F/A | Advisor Group Holdings, Inc. | 107 449 | −6,24 | 2 753 | −6,04 | ||||
| 2025-08-08 | 13F | Creative Planning | 11 556 | 0,00 | 296 | 0,34 | ||||
| 2025-08-12 | 13F | Argent Trust Co | 0 | −100,00 | 0 | −100,00 | ||||
| 2025-07-24 | 13F | Us Bancorp \de\ | 734 542 | 6,75 | 18 821 | 7,02 | ||||
| 2025-07-14 | 13F | Sentinel Pension Advisors Inc | 68 613 | −0,20 | 1 758 | 0,06 | ||||
| 2025-07-17 | 13F | Janney Montgomery Scott LLC | 14 125 | −36,77 | 0 | |||||
| 2025-08-01 | 13F | Ashton Thomas Private Wealth, LLC | 0 | −100,00 | 0 | |||||
| 2025-08-15 | 13F | Howland Capital Management Llc | 188 806 | 3,92 | 4 838 | 4,18 | ||||
| 2025-08-11 | 13F | HighTower Advisors, LLC | 329 979 | −4,25 | 8 455 | −4,01 | ||||
| 2025-08-13 | 13F | Baird Financial Group, Inc. | 10 000 | 0,00 | 256 | 0,39 | ||||
| 2025-05-07 | 13F | Mb, Levis & Associates, Llc | 0 | −100,00 | 0 | −100,00 | ||||
| 2025-07-17 | 13F | E Six Thirteen, Llc | 135 772 | 0,00 | 3 479 | 0,23 | ||||
| 2025-08-07 | 13F | New England Private Wealth Advisors LLC | 73 288 | 0,05 | 1 878 | 0,27 | ||||
| 2025-08-15 | 13F | CI Private Wealth, LLC | 23 406 | −51,98 | 600 | −51,89 | ||||
| 2025-08-05 | 13F | Huntington National Bank | 0 | |||||||
| 2025-08-14 | 13F | Mariner, LLC | 41 741 | −0,22 | 1 070 | 0,00 | ||||
| 2025-08-14 | 13F | Glenview Trust Co | 58 838 | 0,00 | 1 508 | 0,27 | ||||
| 2025-07-25 | 13F | Apollon Wealth Management, LLC | 14 000 | −30,00 | 359 | −29,94 | ||||
| 2025-05-09 | 13F | Ogorek Anthony Joseph /ny/ /adv | 0 | −100,00 | 0 | |||||
| 2025-08-14 | 13F | IHT Wealth Management, LLC | 42 008 | 0,58 | 1 076 | 0,84 | ||||
| 2025-08-05 | 13F | Gould Asset Management Llc /ca/ | 20 375 | 17,23 | 522 | 17,57 | ||||
| 2025-07-30 | 13F | Rehmann Capital Advisory Group | 12 479 | 0,16 | 320 | 0,31 | ||||
| 2025-08-13 | 13F | Peloton Wealth Strategists | 11 000 | 0,00 | 0 | |||||
| 2025-08-06 | 13F | AE Wealth Management LLC | 0 | −100,00 | 0 | |||||
| 2025-07-28 | 13F | Harbour Investments, Inc. | 1 936 | 426,09 | 50 | 444,44 | ||||
| 2025-08-07 | 13F | Kestra Private Wealth Services, Llc | 60 724 | 10,88 | 1 556 | 11,15 | ||||
| 2025-08-06 | 13F | Savant Capital, LLC | 9 312 | 0,00 | 239 | 0,00 | ||||
| 2025-08-13 | 13F | Lido Advisors, LLC | 319 096 | 13,02 | 8 176 | 13,30 | ||||
| 2025-08-13 | 13F | RIA Advisory Group LLC | 55 323 | 4,77 | 1 418 | 5,04 | ||||
| 2025-08-08 | 13F | Hartland & Co., LLC | 882 174 | 3,13 | 22 604 | 3,38 | ||||
| 2025-07-16 | 13F | Kathmere Capital Management, LLC | 474 005 | −10,29 | 12 145 | −10,06 | ||||
| 2025-07-24 | 13F | Moseley Investment Management Inc | 55 929 | −9,69 | 1 433 | −9,42 | ||||
| 2025-07-24 | 13F | Cyndeo Wealth Partners, LLC | 133 532 | −17,50 | 3 421 | −17,29 | ||||
| 2025-07-11 | 13F | Farther Finance Advisors, LLC | 180 | 0,00 | 5 | 0,00 | ||||
| 2025-08-11 | 13F | Arrow Financial Corp | 9 451 | 0,00 | 242 | 0,41 | ||||
| 2025-08-13 | 13F | Smith, Moore & Co. | 13 848 | 71,45 | 355 | 71,84 | ||||
| 2025-07-18 | 13F | Precision Wealth Strategies, LLC | 10 225 | 262 | ||||||
| 2025-08-06 | 13F | Horan Securities, Inc. | 8 453 | 0,00 | 217 | 0,00 | ||||
| 2025-08-14 | 13F/A | Rockefeller Capital Management L.P. | 10 403 | 0,29 | 267 | 0,38 | ||||
| 2025-08-12 | 13F | LPL Financial LLC | 388 657 | 0,19 | 9 959 | 0,43 | ||||
| 2025-07-17 | 13F/A | Capital Investment Advisors, LLC | 63 738 | 11,05 | 1 633 | 11,39 | ||||
| 2025-08-08 | 13F | Cetera Investment Advisers | 45 411 | 13,88 | 1 164 | 14,13 | ||||
| 2025-07-08 | 13F | Richard P Slaughter Associates Inc | 0 | −100,00 | 0 | |||||
| 2025-07-22 | 13F | Strid Group, LLC | 13 404 | −57,01 | 343 | −56,91 | ||||
| 2025-07-31 | 13F | Resonant Capital Advisors, LLC | 27 461 | 0,00 | 704 | 0,29 | ||||
| 2025-08-11 | 13F | Actinver Wealth Management, Inc. | 11 127 | 2,52 | 285 | 2,89 | ||||
| 2025-07-31 | 13F | Leavell Investment Management, Inc. | 270 987 | 1,83 | 6 944 | 2,09 | ||||
| 2025-08-01 | 13F | Schmidt P J Investment Management Inc | 0 | −100,00 | 0 | |||||
| 2025-07-08 | 13F | Legacy Private Trust Co. | 7 870 | 0,00 | 202 | 0,00 | ||||
| 2025-08-27 | 13F/A | Brinker Capital Investments, LLC | 54 917 | 23,23 | 1 407 | 23,53 | ||||
| 2025-08-14 | 13F | Ameriprise Financial Inc | 143 957 | −9,03 | 3 689 | −8,74 | ||||
| 2025-07-08 | 13F | Prism Advisors, Inc. | 35 665 | 0,00 | 914 | 0,22 | ||||
| 2025-08-14 | 13F | Comerica Bank | 836 | −5,32 | 21 | −4,55 | ||||
| 2025-07-30 | 13F | Patten Group, Inc. | 9 111 | 0,00 | 233 | 0,43 | ||||
| 2025-04-16 | 13F | Wealth Enhancement Advisory Services, Llc | 0 | −100,00 | 0 | |||||
| 2025-05-13 | 13F | PFG Private Wealth Management, LLC | 0 | −100,00 | 0 | |||||
| 2025-08-14 | 13F | Royal Bank Of Canada | 95 232 | −0,63 | 2 440 | −0,37 | ||||
| 2025-08-11 | 13F | Avantax Planning Partners, Inc. | 13 229 | 0,00 | 339 | 0,00 | ||||
| 2025-08-07 | 13F | CENTRAL TRUST Co | 172 675 | 6,59 | 4 424 | 6,86 | ||||
| 2025-08-04 | 13F | ArborFi Advisors, LLC | 0 | −100,00 | 0 | |||||
| 2025-08-13 | 13F | MONECO Advisors, LLC | 10 893 | 0,00 | 279 | 0,36 | ||||
| 2025-08-14 | 13F | Fmr Llc | 300 | −96,09 | 8 | −96,43 | ||||
| 2025-05-12 | 13F | Sandy Spring Bank | 43 869 | 1,11 | 1 121 | 1,54 | ||||
| 2025-08-12 | 13F | Proequities, Inc. | 0 | 0 | ||||||
| 2025-08-15 | 13F | Stonebridge Capital Advisors LLC | 0 | −100,00 | 0 | |||||
| 2025-07-28 | 13F | Nestegg Advisors, Inc. | 0 | −100,00 | 0 | |||||
| 2025-08-13 | 13F | Baltimore-Washington Financial Advisors, Inc. | 8 179 | 0,00 | 210 | 0,00 | ||||
| 2025-07-17 | 13F | Catalytic Wealth RIA, LLC | 31 114 | −2,05 | 797 | −1,73 | ||||
| 2025-07-24 | 13F | IFP Advisors, Inc | 34 578 | 12,47 | 886 | 12,74 | ||||
| 2025-08-06 | 13F | Atlantic Union Bankshares Corp | 43 830 | 1 123 | ||||||
| 2025-08-15 | 13F | Kestra Advisory Services, LLC | 0 | −100,00 | 0 | |||||
| 2025-07-09 | 13F | Bank of New Hampshire | 2 905 | 0,00 | 74 | 0,00 | ||||
| 2025-08-13 | 13F | Jones Financial Companies Lllp | 2 141 | 0,00 | 55 | 0,00 | ||||
| 2025-07-21 | 13F | Crews Bank & Trust | 30 981 | 0,00 | 794 | 0,25 | ||||
| 2025-07-30 | 13F | Phillips Financial Management, Llc | 59 217 | 19,55 | 1 517 | 19,83 | ||||
| 2025-08-14 | 13F | Bank Of America Corp /de/ | 1 963 364 | 4,07 | 50 307 | 4,33 | ||||
| 2025-08-14 | 13F | 10Elms LLP | 23 794 | 1,71 | 610 | 2,01 | ||||
| 2025-07-29 | 13F | Private Trust Co Na | 9 739 | 28,58 | 250 | 29,02 | ||||
| 2025-08-11 | 13F | Private Advisor Group, LLC | 17 719 | 454 | ||||||
| 2025-08-14 | 13F | GWM Advisors LLC | 615 172 | 8,01 | 15 763 | 8,27 | ||||
| 2025-08-11 | 13F | Shufro Rose & Co Llc | 9 964 | 0,00 | 255 | 0,00 | ||||
| 2025-08-13 | 13F | Cary Street Partners Financial Llc | 9 595 | 0,00 | 246 | 0,00 | ||||
| 2025-08-14 | 13F | Modern Wealth Management, LLC | 45 042 | 18,37 | 1 154 | 18,72 | ||||
| 2025-07-28 | 13F | WJ Wealth Management, LLC | 12 179 | −71,89 | 312 | −71,82 | ||||
| 2025-05-16 | 13F/A | Kestra Investment Management, LLC | 0 | −100,00 | 0 | |||||
| 2025-07-29 | 13F | Accretive Wealth Partners, LLC | 8 196 | 210 | ||||||
| 2025-08-14 | 13F | Kovitz Investment Group Partners, LLC | 69 052 | 60,12 | 1 769 | 60,53 | ||||
| 2025-07-22 | 13F | Belpointe Asset Management LLC | 47 256 | 1 211 | ||||||
| 2025-07-22 | 13F | Blue Square Asset Management, Llc | 44 750 | −1,99 | 1 147 | −1,80 | ||||
| 2025-07-21 | 13F | Atwater Malick LLC | 97 835 | 3,30 | 2 507 | 3,55 | ||||
| 2025-08-07 | 13F | Sound View Wealth Advisors Group, LLC | 205 621 | 30,66 | 5 269 | 30,98 | ||||
| 2025-08-15 | 13F | Scissortail Wealth Management, LLC | 55 165 | −15,00 | 1 413 | −14,78 | ||||
| 2025-07-21 | 13F | Cliftonlarsonallen Wealth Advisors, Llc | 181 579 | 25,75 | 4 653 | 26,07 | ||||
| 2025-07-30 | 13F | Klingman & Associates, LLC | 11 767 | −16,50 | 302 | −16,39 | ||||
| 2025-07-30 | 13F | Princeton Global Asset Management LLC | 15 700 | 0,00 | 402 | 0,25 | ||||
| 2025-07-30 | 13F | Brookstone Capital Management | 11 068 | 22,22 | 284 | 22,51 | ||||
| 2025-08-12 | 13F | Eldridge Investment Advisors, Inc. | 8 000 | 0,00 | 205 | 0,00 | ||||
| 2025-08-14 | 13F | EP Wealth Advisors, Inc. | 11 490 | 294 | ||||||
| 2025-04-29 | 13F | 4J Wealth Management LLC | 0 | −100,00 | 0 | −100,00 | ||||
| 2025-07-01 | 13F | Confluence Investment Management Llc | 72 848 | −3,47 | 1 867 | −3,22 | ||||
| 2025-07-29 | 13F | Regions Financial Corp | 74 452 | −0,78 | 1 908 | −0,52 | ||||
| 2025-07-25 | 13F | Stephens Consulting, LLC | 313 | 0,00 | 8 | 0,00 | ||||
| 2025-07-11 | 13F | Lantz Financial LLC | 40 469 | 2,63 | 1 037 | 2,88 | ||||
| 2025-07-18 | 13F | Newman Dignan & Sheerar, Inc. | 105 943 | −10,77 | 2 715 | −10,19 | ||||
| 2025-07-23 | 13F | Sax Wealth Advisors, Llc | 15 021 | 385 | ||||||
| 2025-08-12 | 13F | Coldstream Capital Management Inc | 113 042 | 7,43 | 2 896 | 7,70 | ||||
| 2025-04-28 | 13F | Buffington Mohr McNeal | 11 490 | 9,33 | 294 | 9,74 | ||||
| 2025-08-07 | 13F | Addison Advisors LLC | 895 | 23 | ||||||
| 2025-07-30 | 13F | Strategic Blueprint, LLC | 8 381 | 215 | ||||||
| 2025-08-01 | 13F | James Investment Research Inc | 58 755 | 0,00 | 1 505 | 0,27 | ||||
| 2025-07-21 | 13F | Exchange Capital Management, Inc. | 14 899 | −3,25 | 382 | −3,05 | ||||
| 2025-08-07 | 13F | Hughes Financial Services, LLC | 6 686 | 6,26 | 171 | 6,88 | ||||
| 2025-08-01 | 13F | Signature Wealth Management Group | 59 477 | 1,34 | 1 524 | 1,53 | ||||
| 2025-08-11 | 13F | Principal Securities, Inc. | 1 943 | −4,47 | 50 | −3,92 | ||||
| 2025-08-14 | 13F | Financial Engines Advisors L.L.C. | 44 232 | 35,65 | 1 133 | 36,01 | ||||
| 2025-07-29 | 13F | Sigma Investment Counselors Inc | 10 000 | 0,00 | 256 | 0,39 | ||||
| 2025-07-09 | 13F | Lbmc Investment Advisors, Llc | 411 927 | 12,40 | 10 555 | 12,67 | ||||
| 2025-07-30 | 13F | Avidian Wealth Solutions, LLC | 8 554 | 219 | ||||||
| 2025-07-08 | 13F | Parallel Advisors, LLC | 22 690 | 15,90 | 581 | 16,20 | ||||
| 2025-07-25 | 13F | Cwm, Llc | 55 193 | 12,65 | 1 | 0,00 | ||||
| 2025-07-30 | 13F | Sonata Capital Group Inc | 95 287 | 0,00 | 2 | 0,00 | ||||
| 2025-08-12 | 13F | PSI Advisors, LLC | 0 | −100,00 | 0 | |||||
| 2025-07-24 | 13F | Riverchase Wealth Management, Llc | 19 229 | 0,00 | 493 | 0,20 | ||||
| 2025-08-11 | 13F | CFS Investment Advisory Services, LLC | 25 536 | −0,60 | 1 | |||||
| 2025-08-14 | 13F | Godshalk Welsh Capital Management, Inc. | 24 000 | 615 | ||||||
| 2025-07-02 | 13F | Crumly & Associates Inc. | 0 | −100,00 | 0 | |||||
| 2025-08-12 | 13F | Cooper/haims Advisors, Llc | 10 000 | 0,00 | 256 | 0,39 | ||||
| 2025-07-18 | 13F | TPG Advisors LLC | 9 094 | 0,00 | 233 | 0,43 | ||||
| 2025-08-04 | 13F | Assetmark, Inc | 36 944 | 330,08 | 947 | 331,96 | ||||
| 2025-08-14 | 13F | Snowden Capital Advisors LLC | 31 700 | 0,00 | 812 | 0,25 |