Grundläggande statistik
| Institutionella ägare | 163 total, 163 long only, 0 short only, 0 long/short - change of 13,99% MRQ |
| Genomsnittlig portföljallokering | 0.4365 % - change of −5,86% MRQ |
| Institutionella aktier (lång) | 39 158 216 (ex 13D/G) - change of 2,69MM shares 7,38% MRQ |
| Institutionellt värde (lång) | $ 961 480 USD ($1000) |
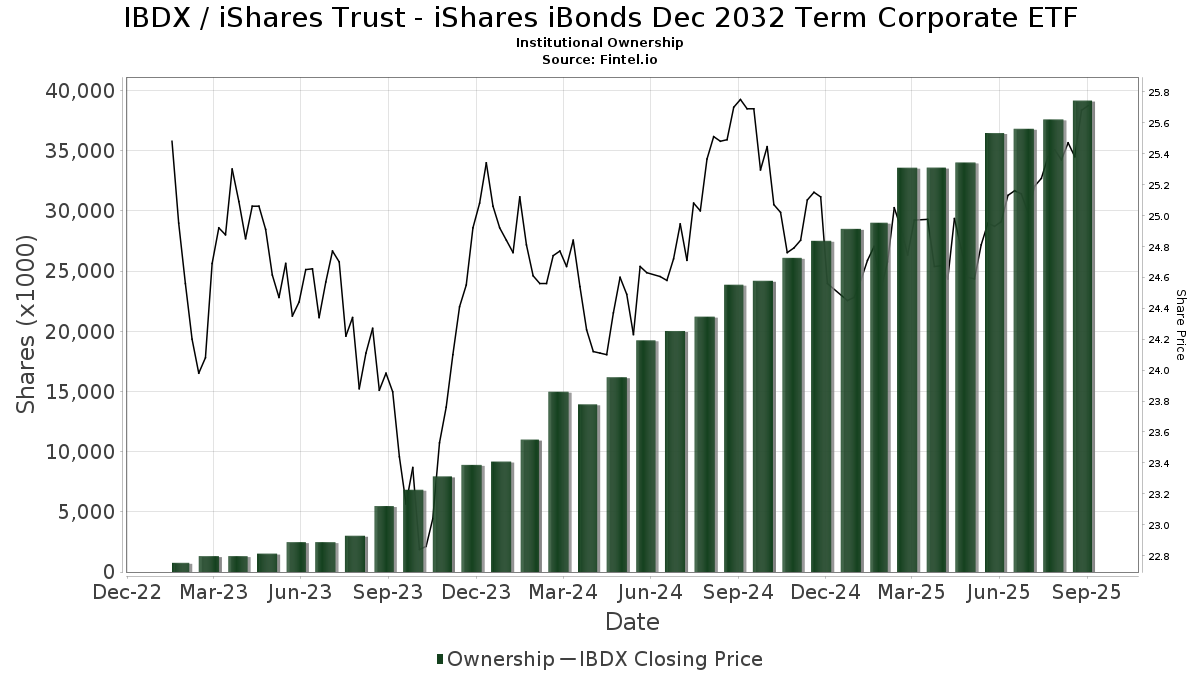
Institutionellt ägande och aktieägare
iShares Trust - iShares iBonds Dec 2032 Term Corporate ETF (US:IBDX) har 163 Institutionella ägare och aktieägare som har lämnat in 13D/G- eller 13F-formulär till Securities Exchange Commission (SEC). Dessa institut innehar totalt 39,158,216 aktier. Största aktieägare inkluderar Aptus Capital Advisors, LLC, DRSK - Aptus Defined Risk ETF, Capital Investment Advisors, LLC, Wells Fargo & Company/mn, Bank Of America Corp /de/, First Interstate Bank, Morgan Stanley, Sigma Investment Counselors Inc, Summitry Llc, and Mv Capital Management, Inc. .
iShares Trust - iShares iBonds Dec 2032 Term Corporate ETF (ARCA:IBDX) Institutionell ägarstruktur visar institutioners och fonders nuvarande positioner i företaget, samt de senaste förändringarna i positionernas storlek. Större aktieägare kan vara enskilda investerare, fonder, hedgefonder eller institutioner. Bilaga 13D visar att investeraren äger (eller ägde) mer än 5% av företaget och avser (eller avsåg) att aktivt eftersträva en förändring av affärsstrategin. Schedule 13G indikerar en passiv investering på över 5%.
The share price as of September 12, 2025 is 25,71 / share. Previously, on September 13, 2024, the share price was 25,75 / share. This represents a decline of 0,16% over that period.
Fondsentimentets poäng
Fondsentimentet poängen(fka Ägarackumulation-poäng) visar vilka aktier som är mest köpta av fonder. Det är resultatet av en sofistikerad kvantitativ flerfaktormodell som identifierar företag med de högsta nivåerna av institutionell ackumulering. Poängsättningsmodellen använder en kombination av den totala ökningen av redovisade ägare, förändringarna i portföljallokeringarna för dessa ägare och andra mått. Siffran sträcker sig från 0 till 100, där högre siffror indikerar en högre nivå av ackumulering i förhållande till sina konkurrenter, och 50 är genomsnittet.
Uppdateringsfrekvens: Dagligen
Se Ownership Explorer, som innehåller en lista över de högst rankade företagen.
Institutionell sälj/köp-kvot
Förutom att rapportera vanliga eget kapital- och skuldemissioner måste institutioner med mer än 100MM tillgångar under förvaltning också avslöja sina innehav av sälj- och köpoptioner. Eftersom säljoptioner i allmänhet indikerar ett negativt sentiment och köpoptioner indikerar ett positivt sentiment, kan vi få en uppfattning om det övergripande institutionella sentimentet genom att plotta förhållandet mellan säljoptioner och köpoptioner. Diagrammet till höger visar det historiska förhållandet mellan sälj- och köpoptioner för detta instrument.
Genom att använda sälj/köp-kvoten som en indikator på aktieägarnas sentiment undviker man en av de största bristerna med att använda det totala institutionella ägandet, nämligen att en betydande del av de förvaltade tillgångarna investeras passivt för att följa index. Passivt förvaltade fonder köper vanligtvis inte optioner, så indikatorn för sälj/köp-kvoten ger en bättre bild av stämningen i aktivt förvaltade fonder.
13F- och NPORT-arkiveringar
Detaljer om 13F-arkiveringar är gratis. Detaljer om NP-arkiveringar kräver ett premiummedlemskap. Gröna rader indikerar nya positioner. Röda rader indikerar stängda positioner. Klicka på länk symbolen för att se hela transaktionshistoriken.
Uppgradera
för att låsa upp premiumdata och exportera till Excel ![]() .
.
| Fil Datum | Källa | Investerare | Typ | Genomsnittligt pris (beräknat) |
Aktier | Δ Aktier (%) |
Rapporterat värde (1000 USD) |
Δ Värde (%) |
Portföljallokering (%) |
|
|---|---|---|---|---|---|---|---|---|---|---|
| 2025-08-14 | 13F | Wells Fargo & Company/mn | 2 675 128 | 3,42 | 67 641 | 4,64 | ||||
| 2025-07-16 | 13F | Gradient Capital Advisors, LLC | 32 548 | 0,02 | 823 | 1,11 | ||||
| 2025-08-12 | 13F | BlackRock, Inc. | 50 | 0,00 | 1 | 0,00 | ||||
| 2025-09-04 | 13F/A | Advisor Group Holdings, Inc. | 7 666 | −56,80 | 194 | −56,43 | ||||
| 2025-07-21 | 13F | Precedent Wealth Partners, Llc | 126 582 | 11,17 | 3 201 | 12,48 | ||||
| 2025-08-08 | 13F | Summitry Llc | 1 053 450 | 23,39 | 26 636 | 24,84 | ||||
| 2025-08-08 | 13F | Creative Planning | 0 | −100,00 | 0 | |||||
| 2025-08-13 | 13F | Lido Advisors, LLC | 160 433 | 2,59 | 4 057 | 3,79 | ||||
| 2025-08-06 | 13F | Commonwealth Equity Services, Llc | 345 959 | −1,50 | 9 | 0,00 | ||||
| 2025-08-11 | 13F | United Capital Financial Advisers, Llc | 56 010 | 4,97 | 1 416 | 6,15 | ||||
| 2025-08-07 | 13F | Sound View Wealth Advisors Group, LLC | 657 139 | 20,96 | 16 616 | 22,39 | ||||
| 2025-08-04 | 13F | REDW Wealth LLC | 41 744 | 1,75 | 1 055 | 2,93 | ||||
| 2025-08-14 | 13F | Mercer Global Advisors Inc /adv | 55 983 | 9,91 | 1 416 | 11,24 | ||||
| 2025-08-11 | 13F | Banque Cantonale Vaudoise | 5 298 | 0,00 | 0 | |||||
| 2025-04-29 | 13F | Element Wealth, LLC | 0 | −100,00 | 0 | |||||
| 2025-08-11 | 13F | Arrow Financial Corp | 591 999 | −0,87 | 14 969 | 0,30 | ||||
| 2025-05-07 | 13F | Spectrum Wealth Counsel, LLC | 15 544 | 1 072,25 | 388 | 1 112,50 | ||||
| 2025-07-30 | 13F | Granite Harbor Advisors, Inc. | 26 567 | 672 | ||||||
| 2025-08-14 | 13F | Mml Investors Services, Llc | 21 891 | −37,08 | 1 | |||||
| 2025-04-17 | 13F | Montecito Bank & Trust | 28 265 | 1,00 | 706 | 2,77 | ||||
| 2025-05-14 | 13F | Van Hulzen Asset Management, LLC | 0 | −100,00 | 0 | −100,00 | ||||
| 2025-07-14 | 13F | McGlone Suttner Wealth Management, Inc. | 45 000 | 0,69 | 1 138 | 1,88 | ||||
| 2025-07-08 | 13F | Parallel Advisors, LLC | 218 176 | 8,66 | 5 517 | 9,95 | ||||
| 2025-08-11 | 13F | Guidance Point Advisors, LLC | 278 413 | 0,82 | 7 040 | 2,00 | ||||
| 2025-04-29 | 13F | Hm Payson & Co | 1 177 | 29 | ||||||
| 2025-08-01 | 13F | Envestnet Asset Management Inc | 224 932 | 16,49 | 5 687 | 17,87 | ||||
| 2025-08-11 | 13F | Aptus Capital Advisors, LLC | 4 261 556 | 6,42 | 107 753 | 7,68 | ||||
| 2025-08-14 | 13F | GWM Advisors LLC | 125 946 | −24,95 | 3 185 | −24,06 | ||||
| 2025-08-13 | 13F | Peloton Wealth Strategists | 52 500 | 0,00 | 1 | 0,00 | ||||
| 2025-06-27 | NP | DRSK - Aptus Defined Risk ETF | 4 090 943 | 9,52 | 102 192 | 10,81 | ||||
| 2025-07-22 | 13F | Belpointe Asset Management LLC | 16 612 | 420 | ||||||
| 2025-08-15 | 13F | Captrust Financial Advisors | 29 042 | −17,13 | 734 | −16,11 | ||||
| 2025-08-11 | 13F | Stonebrook Private Inc. | 88 004 | 2,77 | 2 225 | 3,97 | ||||
| 2025-08-14 | 13F | Jupiter Wealth Management LLC | 5 100 | 130 | ||||||
| 2025-08-14 | 13F | Wilkins Miller Wealth Management, LLC | 55 345 | −10,48 | 1 399 | −9,39 | ||||
| 2025-08-12 | 13F | Associated Banc-corp | 40 939 | 10,50 | 1 035 | 11,89 | ||||
| 2025-08-15 | 13F | Howland Capital Management Llc | 32 890 | 52,96 | 832 | 54,75 | ||||
| 2025-08-08 | 13F | Cetera Investment Advisers | 68 529 | 20,73 | 1 733 | 22,14 | ||||
| 2025-07-16 | 13F | Evergreen Private Wealth LLC | 130 682 | 7,13 | 3 304 | 8,40 | ||||
| 2025-08-14 | 13F | Royal Bank Of Canada | 349 038 | −4,15 | 8 826 | −3,01 | ||||
| 2025-08-01 | 13F | Bank of Jackson Hole Trust | 226 | 0,00 | 6 | 0,00 | ||||
| 2025-08-19 | 13F | Advisory Services Network, LLC | 14 320 | 6,61 | 361 | 7,76 | ||||
| 2025-07-09 | 13F | Chesley Taft & Associates LLC | 28 800 | 203,16 | 728 | 207,17 | ||||
| 2025-08-12 | 13F | LPL Financial LLC | 262 135 | 10,20 | 6 628 | 11,51 | ||||
| 2025-08-14 | 13F | Headinvest, Llc | 36 890 | 0,00 | 933 | 1,19 | ||||
| 2025-07-09 | 13F | Byrne Asset Management LLC | 0 | −100,00 | 0 | |||||
| 2025-08-14 | 13F | Frisch Financial Group, Inc. | 132 456 | 3 | ||||||
| 2025-07-25 | 13F | Cwm, Llc | 103 231 | 2,87 | 3 | 0,00 | ||||
| 2025-08-13 | 13F | Hendershot Investments Inc. | 8 156 | 0,00 | 206 | 1,48 | ||||
| 2025-07-09 | 13F | Stony Point Wealth Management Inc. | 421 817 | −2,95 | 10 666 | −1,80 | ||||
| 2025-07-23 | 13F | Valmark Advisers, Inc. | 9 767 | 11,28 | 247 | 12,33 | ||||
| 2025-07-16 | 13F | NovaPoint Capital, LLC | 41 836 | 0,89 | 1 058 | 2,03 | ||||
| 2025-08-04 | 13F | Roble, Belko & Company, Inc | 10 247 | 44,06 | 0 | |||||
| 2025-07-07 | 13F | Trust Co | 1 979 | 0,00 | 50 | 2,04 | ||||
| 2025-07-23 | 13F | Meitav Dash Investments Ltd | 36 322 | 11,26 | 917 | 12,52 | ||||
| 2025-08-05 | 13F | Cherry Tree Wealth Management, LLC | 12 273 | 40,55 | 310 | 42,20 | ||||
| 2025-08-14 | 13F | Mariner, LLC | 70 106 | 6,93 | 1 773 | 8,18 | ||||
| 2025-04-15 | 13F | First United Bank Trust/ | 0 | −100,00 | 0 | |||||
| 2025-08-14 | 13F | Comerica Bank | 17 484 | −9,66 | 442 | −8,49 | ||||
| 2025-08-14 | 13F | Benjamin Edwards Inc | 180 505 | −5,24 | 4 564 | −4,12 | ||||
| 2025-04-30 | 13F | Stratos Wealth Partners, LTD. | 0 | −100,00 | 0 | |||||
| 2025-08-14 | 13F | UBS Group AG | 736 785 | −15,00 | 18 630 | −13,99 | ||||
| 2025-08-12 | 13F | Cowa, Llc | 312 775 | 86,34 | 7 899 | 88,32 | ||||
| 2025-08-12 | 13F | Farmers National Bank | 28 010 | 1,53 | 708 | 2,76 | ||||
| 2025-08-15 | 13F | Koesten, Hirschmann & Crabtree, INC. | 7 315 | 8,53 | 185 | 9,52 | ||||
| 2025-05-13 | 13F | Steward Partners Investment Advisory, Llc | 0 | −100,00 | 0 | |||||
| 2025-08-14 | 13F | Ameriprise Financial Inc | 808 343 | 26,93 | 20 243 | 27,20 | ||||
| 2025-07-11 | 13F | Quantum Financial Advisors, LLC | 66 646 | 4,87 | 1 685 | 6,11 | ||||
| 2025-08-08 | 13F | Avantax Advisory Services, Inc. | 18 434 | 7,07 | 466 | 8,37 | ||||
| 2025-07-17 | 13F | Archford Capital Strategies, LLC | 79 915 | −4,79 | 2 021 | −3,67 | ||||
| 2025-07-01 | 13F | Harbor Investment Advisory, Llc | 2 000 | 0,00 | 51 | 2,04 | ||||
| 2025-08-14 | 13F | Citadel Advisors Llc | 247 692 | 8,35 | 6 263 | 9,63 | ||||
| 2025-08-06 | 13F | Atlantic Union Bankshares Corp | 219 947 | 5 561 | ||||||
| 2025-08-07 | 13F | Kestra Private Wealth Services, Llc | 12 630 | 319 | ||||||
| 2025-08-07 | 13F | CENTRAL TRUST Co | 2 922 | −8,43 | 74 | −7,59 | ||||
| 2025-07-18 | 13F | Centricity Wealth Management, LLC | 1 625 | 0,00 | 41 | 2,50 | ||||
| 2025-08-01 | 13F | First National Trust Co | 13 560 | 3,09 | 343 | 4,27 | ||||
| 2025-08-11 | 13F | Annis Gardner Whiting Capital Advisors, LLC | 1 083 | 27 | ||||||
| 2025-05-06 | 13F | Venturi Wealth Management, LLC | 0 | −100,00 | 0 | |||||
| 2025-07-14 | 13F | Sowell Financial Services LLC | 10 515 | 266 | ||||||
| 2025-05-12 | 13F | Sandy Spring Bank | 216 387 | 6,60 | 5 408 | 8,38 | ||||
| 2025-08-04 | 13F | Arkadios Wealth Advisors | 9 315 | −3,95 | 236 | −2,89 | ||||
| 2025-08-04 | 13F | Assetmark, Inc | 0 | −100,00 | 0 | |||||
| 2025-08-15 | 13F | Morgan Stanley | 1 596 453 | 8,94 | 40 366 | 10,22 | ||||
| 2025-08-12 | 13F | Reliant Wealth Planning | 44 557 | 1 127 | ||||||
| 2025-05-16 | 13F | Coppell Advisory Solutions LLC | 0 | −100,00 | 0 | |||||
| 2025-08-12 | 13F | Global Retirement Partners, LLC | 274 | 7 | ||||||
| 2025-08-14 | 13F | Evergreen Wealth Solutions, LLC | 75 833 | −7,81 | 1 917 | −6,72 | ||||
| 2025-08-14 | 13F | STAR Financial Bank | 73 185 | 89,33 | 1 850 | 91,71 | ||||
| 2025-08-08 | 13F | Wrapmanager Inc | 137 444 | 3 475 | ||||||
| 2025-08-07 | 13F | Allworth Financial LP | 849 | 0,00 | 21 | 0,00 | ||||
| 2025-08-13 | 13F | Beacon Pointe Advisors, LLC | 31 865 | 3,45 | 806 | 4,68 | ||||
| 2025-07-30 | 13F | First Interstate Bank | 1 985 980 | −2,21 | 50 216 | −1,05 | ||||
| 2025-08-04 | 13F | Creative Financial Designs Inc /adv | 206 | 0,00 | 5 | 0,00 | ||||
| 2025-04-23 | 13F | Sabal Trust CO | 196 089 | 11,36 | 4 900 | 13,22 | ||||
| 2025-07-23 | 13F | Ironwood Financial, llc | 24 410 | 0,00 | 610 | 0,00 | ||||
| 2025-08-12 | 13F | Cooper/haims Advisors, Llc | 10 407 | 0,00 | 263 | 1,15 | ||||
| 2025-07-09 | 13F | Bank of New Hampshire | 7 030 | 603,00 | 178 | 637,50 | ||||
| 2025-08-11 | 13F | PFG Private Wealth Management, LLC | 446 942 | 2,96 | 11 301 | 4,18 | ||||
| 2025-07-31 | 13F | Keeler THomas Management LLC | 35 950 | 49,97 | 909 | 51,59 | ||||
| 2025-08-06 | 13F | Adviser Investments LLC | 154 504 | 2,15 | 3 907 | 3,36 | ||||
| 2025-08-11 | 13F | Private Advisor Group, LLC | 24 329 | 40,92 | 615 | 42,69 | ||||
| 2025-08-14 | 13F | Glenview Trust Co | 20 534 | 69,23 | 519 | 71,29 | ||||
| 2025-07-22 | 13F | 4Thought Financial Group Inc. | 192 006 | 13,33 | 4 855 | 14,67 | ||||
| 2025-08-13 | 13F | Jones Financial Companies Lllp | 5 710 | 307,86 | 144 | 323,53 | ||||
| 2025-08-13 | 13F | Northwestern Mutual Wealth Management Co | 26 958 | 28,54 | 682 | 29,96 | ||||
| 2025-08-13 | 13F | StoneX Group Inc. | 12 889 | 1,08 | 326 | 2,20 | ||||
| 2025-08-14 | 13F | Jane Street Group, Llc | 0 | −100,00 | 0 | |||||
| 2025-08-07 | 13F | Nwam Llc | 9 528 | 240 | ||||||
| 2025-07-24 | 13F | IFP Advisors, Inc | 32 288 | 17,00 | 816 | 18,43 | ||||
| 2025-08-07 | 13F | Gryphon Financial Partners LLC | 19 564 | 495 | ||||||
| 2025-05-12 | 13F | C2P Capital Advisory Group, LLC d.b.a. Prosperity Capital Advisors | 0 | −100,00 | 0 | −100,00 | ||||
| 2025-08-01 | 13F | Paradigm, Strategies in Wealth Management, LLC | 143 265 | −3,32 | 3 622 | −2,19 | ||||
| 2025-08-12 | 13F | Jpmorgan Chase & Co | 0 | −100,00 | 0 | |||||
| 2025-08-14 | 13F | Bank Of America Corp /de/ | 2 252 296 | 0,89 | 56 949 | 2,08 | ||||
| 2025-08-12 | 13F | Proequities, Inc. | 0 | 0 | ||||||
| 2025-07-29 | 13F | Mb, Levis & Associates, Llc | 503 035 | 2,42 | 12 719 | 3,63 | ||||
| 2025-08-13 | 13F | Cary Street Partners Financial Llc | 13 829 | 0,00 | 350 | 1,16 | ||||
| 2025-08-14 | 13F | 10Elms LLP | 6 850 | 705,88 | 173 | 723,81 | ||||
| 2025-07-15 | 13F | MCF Advisors LLC | 103 927 | 3,13 | 2 628 | 4,33 | ||||
| 2025-08-14 | 13F | Colony Group, LLC | 18 297 | 463 | ||||||
| 2025-07-22 | 13F | Penobscot Investment Management Company, Inc. | 12 000 | 3,45 | 303 | 4,84 | ||||
| 2025-08-14 | 13F | Raymond James Financial Inc | 283 880 | −58,33 | 7 178 | −57,84 | ||||
| 2025-08-14 | 13F | Stifel Financial Corp | 53 484 | −75,37 | 1 352 | −75,08 | ||||
| 2025-08-13 | 13F | Flow Traders U.s. Llc | 62 965 | 89,60 | 2 | |||||
| 2025-08-27 | NP | Mason Capital Fund Trust - Fundamentals First ETF | 1 992 | 0,00 | 50 | 2,04 | ||||
| 2025-07-10 | 13F | Wealth Enhancement Advisory Services, Llc | 39 199 | 3,83 | 986 | 4,45 | ||||
| 2025-07-02 | 13F | Michael S. Ryan, Inc. | 205 163 | 2,08 | 5 188 | 3,29 | ||||
| 2025-07-29 | 13F | Accretive Wealth Partners, LLC | 7 984 | 202 | ||||||
| 2025-08-07 | 13F | Rossmore Private Capital | 41 618 | 1 052 | ||||||
| 2025-07-30 | 13F | Princeton Global Asset Management LLC | 28 179 | −0,28 | 712 | 0,85 | ||||
| 2025-08-14 | 13F | Hancock Whitney Corp | 203 710 | 5 151 | ||||||
| 2025-07-11 | 13F | Adirondack Trust Co | 55 257 | 15,10 | 1 397 | 16,43 | ||||
| 2025-07-25 | 13F | We Are One Seven, LLC | 11 745 | 13,14 | 297 | 14,29 | ||||
| 2025-08-11 | 13F | Brown Brothers Harriman & Co | 7 599 | 192 | ||||||
| 2025-07-09 | 13F | Krilogy Financial LLC | 192 598 | 2,04 | 4 870 | 3,24 | ||||
| 2025-07-01 | 13F | Confluence Investment Management Llc | 401 503 | −1,46 | 10 152 | −0,28 | ||||
| 2025-08-25 | 13F/A | Neuberger Berman Group LLC | 126 635 | 0,48 | 3 202 | 1,65 | ||||
| 2025-08-01 | 13F | Rossby Financial, LCC | 496 | 13 | ||||||
| 2025-07-30 | 13F | Klingman & Associates, LLC | 514 089 | 30,66 | 12 999 | 32,20 | ||||
| 2025-08-01 | 13F | James Investment Research Inc | 14 068 | 0,00 | 356 | 1,14 | ||||
| 2025-07-21 | 13F | Cliftonlarsonallen Wealth Advisors, Llc | 37 009 | −2,64 | 936 | −1,48 | ||||
| 2025-07-09 | 13F | Sarver Vrooman Wealth Advisors | 7 288 | 594,10 | 184 | 607,69 | ||||
| 2025-07-23 | 13F | Fulton Breakefield Broenniman Llc | 61 099 | 264,29 | 1 545 | 268,50 | ||||
| 2025-07-23 | 13F | Arcataur Capital Management LLC | 73 685 | 16,10 | 1 863 | 17,54 | ||||
| 2025-07-29 | 13F | Lyell Wealth Management, Lp | 218 025 | 1,47 | 5 513 | 2,66 | ||||
| 2025-07-21 | 13F | Segment Wealth Management, LLC | 57 210 | 4,09 | 1 447 | 5,32 | ||||
| 2025-07-30 | 13F | Sonata Capital Group Inc | 12 000 | 0 | ||||||
| 2025-08-08 | 13F | Mv Capital Management, Inc. | 812 405 | −0,63 | 20 542 | 0,55 | ||||
| 2025-07-15 | 13F | Garrett Investment Advisors LLC | 26 620 | −76,49 | 673 | −76,21 | ||||
| 2025-07-30 | 13F | Probity Advisors, Inc. | 142 263 | 8,60 | 3 597 | 9,90 | ||||
| 2025-08-12 | 13F | O'shaughnessy Asset Management, Llc | 1 | 0 | ||||||
| 2025-08-06 | 13F | Stokes Family Office, LLC | 27 330 | 0,00 | 691 | 1,32 | ||||
| 2025-08-11 | 13F | HighTower Advisors, LLC | 445 324 | 4,72 | 11 260 | 5,96 | ||||
| 2025-07-17 | 13F/A | Capital Investment Advisors, LLC | 2 752 018 | 10,64 | 69 585 | 11,94 | ||||
| 2025-07-25 | 13F | Hemington Wealth Management | 2 590 | 0,00 | 0 | |||||
| 2025-07-29 | 13F | Koshinski Asset Management, Inc. | 8 040 | 203 | ||||||
| 2025-08-12 | 13F | Coldstream Capital Management Inc | 58 851 | 1,44 | 1 488 | 2,69 | ||||
| 2025-07-28 | 13F | Mutual Advisors, LLC | 19 541 | 0,36 | 493 | 1,65 | ||||
| 2025-08-05 | 13F | Bank Of Montreal /can/ | 0 | −100,00 | 0 | |||||
| 2025-08-14 | 13F/A | Rockefeller Capital Management L.P. | 504 136 | −2,26 | 12 747 | −1,10 | ||||
| 2025-08-15 | 13F | Kestra Advisory Services, LLC | 79 248 | 6,58 | 2 004 | 7,80 | ||||
| 2025-07-29 | 13F | Sigma Investment Counselors Inc | 1 316 078 | 3,23 | 33 277 | 4,45 | ||||
| 2025-08-07 | 13F | Addison Advisors LLC | 16 668 | 72,49 | 421 | 74,69 | ||||
| 2025-07-18 | 13F | Truist Financial Corp | 9 203 | 233 | ||||||
| 2025-07-09 | 13F | Beacon Financial Group | 30 280 | 19,43 | 766 | 20,85 | ||||
| 2025-04-22 | 13F | Mendota Financial Group, LLC | 0 | −100,00 | 0 | |||||
| 2025-08-11 | 13F | Dorsey & Whitney Trust CO LLC | 16 000 | 0,00 | 405 | 1,25 | ||||
| 2025-05-14 | 13F | Susquehanna International Group, Llp | 0 | −100,00 | 0 | |||||
| 2025-07-17 | 13F | Venture Visionary Partners LLC | 56 824 | −30,99 | 1 437 | −30,19 | ||||
| 2025-08-12 | 13F | J.w. Cole Advisors, Inc. | 36 041 | 911 | ||||||
| 2025-07-24 | 13F | Us Bancorp \de\ | 758 407 | 16,65 | 19 176 | 18,03 | ||||
| 2025-08-08 | 13F | Advisors Capital Management, LLC | 297 883 | 7 532 | ||||||
| 2025-08-14 | 13F | Integrated Wealth Concepts LLC | 20 903 | 24,93 | 529 | 26,32 | ||||
| 2025-07-17 | 13F | Janney Montgomery Scott LLC | 317 816 | 6,33 | 8 | 14,29 | ||||
| 2025-08-01 | 13F | Signature Wealth Management Group | 155 922 | 2,75 | 3 942 | 3,96 | ||||
| 2025-07-31 | 13F | United Community Bank | 1 570 | 96,25 | 40 | 105,26 | ||||
| 2025-08-12 | 13F | Jacobi Capital Management LLC | 18 233 | 6,79 | 461 | 8,22 | ||||
| 2025-07-09 | 13F | Lbmc Investment Advisors, Llc | 43 495 | 1 100 | ||||||
| 2025-07-08 | 13F | Little House Capital Llc | 45 234 | −0,14 | 1 144 | 0,97 |