Grundläggande statistik
| Institutionella ägare | 164 total, 161 long only, 0 short only, 3 long/short - change of −16,75% MRQ |
| Genomsnittlig portföljallokering | 0.0334 % - change of −46,29% MRQ |
| Institutionella aktier (lång) | 29 470 690 (ex 13D/G) - change of 22,51MM shares 323,56% MRQ |
| Institutionellt värde (lång) | $ 246 017 USD ($1000) |
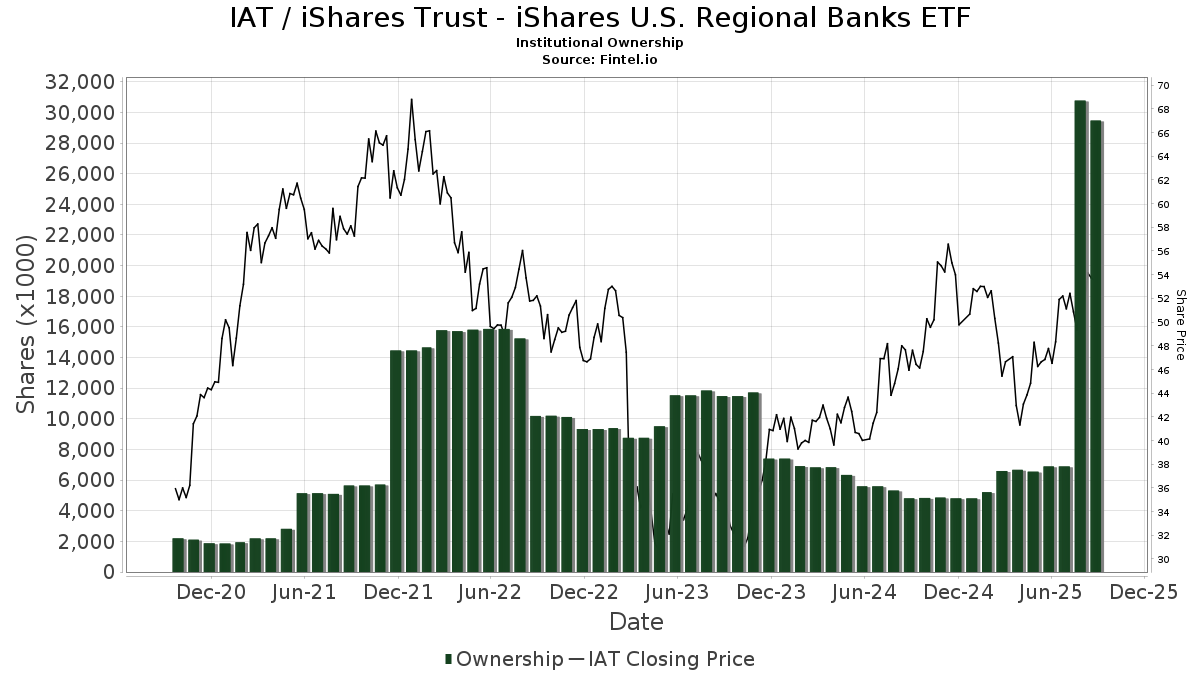
Institutionellt ägande och aktieägare
iShares Trust - iShares U.S. Regional Banks ETF (US:IAT) har 164 Institutionella ägare och aktieägare som har lämnat in 13D/G- eller 13F-formulär till Securities Exchange Commission (SEC). Dessa institut innehar totalt 29,470,690 aktier. Största aktieägare inkluderar Kingstone Capital Partners Texas, LLC, Morgan Stanley, Wells Fargo & Company/mn, Bank Of America Corp /de/, Jpmorgan Chase & Co, Royal Bank Of Canada, Us Bancorp \de\, Advisor Group Holdings, Inc., LPL Financial LLC, and Ameriprise Financial Inc .
iShares Trust - iShares U.S. Regional Banks ETF (ARCA:IAT) Institutionell ägarstruktur visar institutioners och fonders nuvarande positioner i företaget, samt de senaste förändringarna i positionernas storlek. Större aktieägare kan vara enskilda investerare, fonder, hedgefonder eller institutioner. Bilaga 13D visar att investeraren äger (eller ägde) mer än 5% av företaget och avser (eller avsåg) att aktivt eftersträva en förändring av affärsstrategin. Schedule 13G indikerar en passiv investering på över 5%.
The share price as of September 15, 2025 is 53,21 / share. Previously, on September 16, 2024, the share price was 47,15 / share. This represents an increase of 12,85% over that period.
Fondsentimentets poäng
Fondsentimentet poängen(fka Ägarackumulation-poäng) visar vilka aktier som är mest köpta av fonder. Det är resultatet av en sofistikerad kvantitativ flerfaktormodell som identifierar företag med de högsta nivåerna av institutionell ackumulering. Poängsättningsmodellen använder en kombination av den totala ökningen av redovisade ägare, förändringarna i portföljallokeringarna för dessa ägare och andra mått. Siffran sträcker sig från 0 till 100, där högre siffror indikerar en högre nivå av ackumulering i förhållande till sina konkurrenter, och 50 är genomsnittet.
Uppdateringsfrekvens: Dagligen
Se Ownership Explorer, som innehåller en lista över de högst rankade företagen.
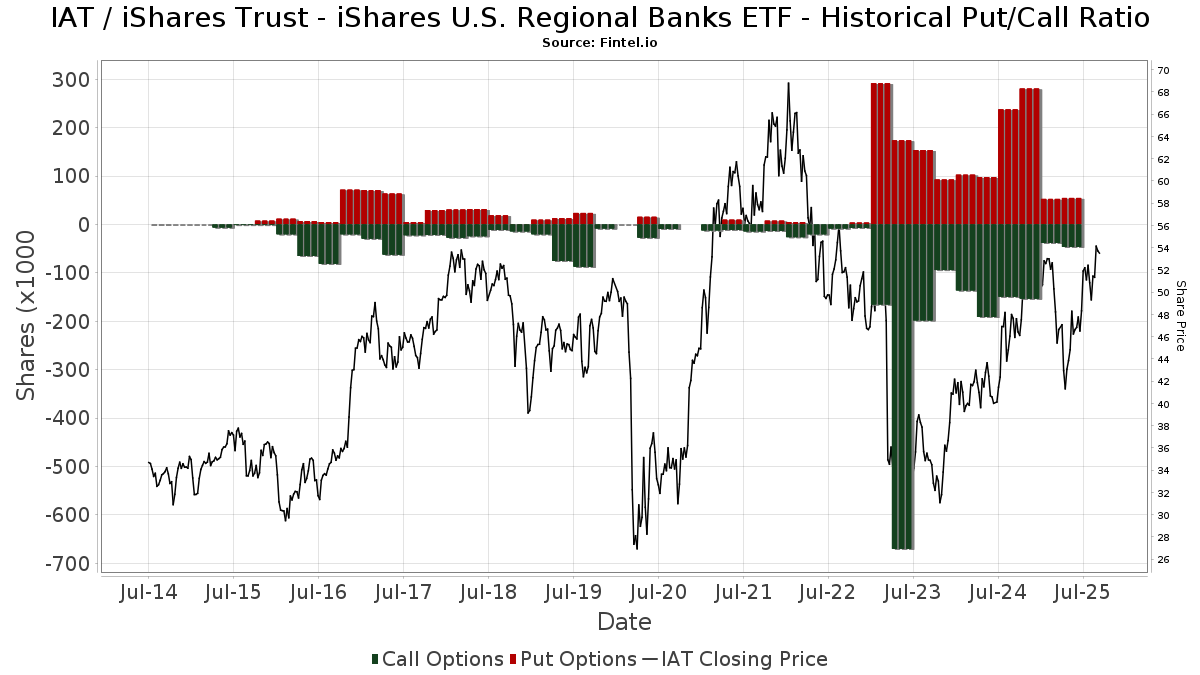
Institutionell sälj/köp-kvot
Förutom att rapportera vanliga eget kapital- och skuldemissioner måste institutioner med mer än 100MM tillgångar under förvaltning också avslöja sina innehav av sälj- och köpoptioner. Eftersom säljoptioner i allmänhet indikerar ett negativt sentiment och köpoptioner indikerar ett positivt sentiment, kan vi få en uppfattning om det övergripande institutionella sentimentet genom att plotta förhållandet mellan säljoptioner och köpoptioner. Diagrammet till höger visar det historiska förhållandet mellan sälj- och köpoptioner för detta instrument.
Genom att använda sälj/köp-kvoten som en indikator på aktieägarnas sentiment undviker man en av de största bristerna med att använda det totala institutionella ägandet, nämligen att en betydande del av de förvaltade tillgångarna investeras passivt för att följa index. Passivt förvaltade fonder köper vanligtvis inte optioner, så indikatorn för sälj/köp-kvoten ger en bättre bild av stämningen i aktivt förvaltade fonder.
13F- och NPORT-arkiveringar
Detaljer om 13F-arkiveringar är gratis. Detaljer om NP-arkiveringar kräver ett premiummedlemskap. Gröna rader indikerar nya positioner. Röda rader indikerar stängda positioner. Klicka på länk symbolen för att se hela transaktionshistoriken.
Uppgradera
för att låsa upp premiumdata och exportera till Excel ![]() .
.
| Fil Datum | Källa | Investerare | Typ | Genomsnittligt pris (beräknat) |
Aktier | Δ Aktier (%) |
Rapporterat värde (1000 USD) |
Δ Värde (%) |
Portföljallokering (%) |
|
|---|---|---|---|---|---|---|---|---|---|---|
| 2025-08-04 | 13F | Assetmark, Inc | 32 | 0,00 | 2 | 0,00 | ||||
| 2025-07-09 | 13F | Finley Financial, LLC | 3 000 | 0,00 | 149 | 12,12 | ||||
| 2025-05-15 | 13F | Squarepoint Ops LLC | Put | 0 | −100,00 | 0 | ||||
| 2025-07-29 | 13F | Chicago Partners Investment Group LLC | 5 217 | 0,81 | 273 | 18,18 | ||||
| 2025-05-15 | 13F | Squarepoint Ops LLC | Call | 0 | −100,00 | 0 | ||||
| 2025-08-14 | 13F | Cubist Systematic Strategies, LLC | 25 064 | 15,47 | 1 242 | 22,63 | ||||
| 2025-08-13 | 13F | Scotia Capital Inc. | 0 | −100,00 | 0 | |||||
| 2025-08-19 | 13F | Advisory Services Network, LLC | 56 828 | 42,79 | 2 850 | 53,58 | ||||
| 2025-08-13 | 13F | Financial Freedom, LLC | 3 006 | 0,84 | 149 | 6,47 | ||||
| 2025-05-13 | 13F | Coston, McIsaac & Partners | 0 | −100,00 | 0 | |||||
| 2025-07-09 | 13F | Breakwater Capital Group | 5 548 | −0,88 | 275 | 5,38 | ||||
| 2025-08-08 | 13F | Creative Planning | 10 307 | 0,44 | 511 | 6,69 | ||||
| 2025-08-12 | 13F | Pettyjohn, Wood & White, Inc | 4 275 | 212 | ||||||
| 2025-08-11 | 13F | Private Advisor Group, LLC | 6 007 | 298 | ||||||
| 2025-08-13 | 13F | Bare Financial Services, Inc | 8 758 | 4,04 | 434 | 10,46 | ||||
| 2025-05-06 | 13F | Venturi Wealth Management, LLC | 0 | −100,00 | 0 | |||||
| 2025-08-05 | 13F | Sigma Planning Corp | 13 616 | −23,39 | 675 | −18,60 | ||||
| 2025-08-12 | 13F | Steward Partners Investment Advisory, Llc | 78 783 | −13,57 | 3 904 | −8,16 | ||||
| 2025-08-14 | 13F | Wells Fargo & Company/mn | 469 951 | 119,46 | 23 286 | 133,21 | ||||
| 2025-08-14 | 13F | Stifel Financial Corp | 17 945 | −76,59 | 889 | −75,13 | ||||
| 2025-07-31 | 13F | Oppenheimer & Co Inc | 0 | −100,00 | 0 | |||||
| 2025-08-14 | 13F | Mml Investors Services, Llc | 0 | −100,00 | 0 | |||||
| 2025-08-14 | 13F | SummitTX Capital, L.P. | 0 | −100,00 | 0 | |||||
| 2025-04-29 | 13F | Hm Payson & Co | 87 | 0,00 | 4 | 0,00 | ||||
| 2025-05-15 | 13F | Crestline Management, LP | 0 | −100,00 | 0 | |||||
| 2025-07-14 | 13F | Park Avenue Securities Llc | 11 209 | 3,78 | 1 | |||||
| 2025-08-06 | 13F | Golden State Wealth Management, LLC | 284 | 0,71 | 14 | 7,69 | ||||
| 2025-08-19 | 13F | National Asset Management, Inc. | 0 | −100,00 | 0 | |||||
| 2025-07-21 | 13F | Barrett & Company, Inc. | 1 086 | 0,84 | 54 | 6,00 | ||||
| 2025-08-14 | 13F | Synovus Financial Corp | 6 385 | 0,19 | 317 | 6,40 | ||||
| 2025-08-14 | 13F | GWM Advisors LLC | 6 308 | −23,83 | 313 | −19,17 | ||||
| 2025-05-12 | 13F | Independent Advisor Alliance | 0 | −100,00 | 0 | |||||
| 2025-05-12 | 13F | Aveo Capital Partners, LLC | 0 | −100,00 | 0 | −100,00 | ||||
| 2025-07-22 | 13F | Luken Investment Analytics, LLC | 1 750 | 0,00 | 87 | 6,17 | ||||
| 2025-05-14 | 13F | bLong Financial, LLC | 0 | −100,00 | 0 | |||||
| 2025-08-05 | 13F | Bank Of Montreal /can/ | 4 032 | −23,01 | 200 | −18,44 | ||||
| 2025-08-14 | 13F | Mariner, LLC | 27 186 | 17,79 | 1 347 | 25,19 | ||||
| 2025-05-07 | 13F | Spectrum Wealth Counsel, LLC | 11 809 | −82,20 | 551 | −83,54 | ||||
| 2025-05-05 | 13F | IFP Advisors, Inc | 0 | −100,00 | 0 | |||||
| 2025-07-31 | 13F | Cambridge Investment Research Advisors, Inc. | 29 691 | 1,57 | 1 | 0,00 | ||||
| 2025-08-04 | 13F | Carret Asset Management, Llc | 24 920 | −1,19 | 1 235 | 4,93 | ||||
| 2025-04-28 | 13F | Pinnacle Financial Partners Inc | 3 147 | 0,00 | 158 | 6,04 | ||||
| 2025-05-07 | 13F | New Republic Capital, LLC | 0 | −100,00 | 0 | |||||
| 2025-08-11 | 13F | TD Waterhouse Canada Inc. | 800 | 0,00 | 41 | 11,11 | ||||
| 2025-08-14 | 13F/A | Rockefeller Capital Management L.P. | 19 505 | −12,44 | 967 | −6,94 | ||||
| 2025-08-14 | 13F | CIBC World Markets Inc. | 4 728 | 9,95 | 234 | 17,00 | ||||
| 2025-08-13 | 13F | Safe Harbor Fiduciary, LLC | 3 056 | 0,00 | 151 | 6,34 | ||||
| 2025-07-31 | 13F | Gallagher Capital Advisors, LLC | 0 | −100,00 | 0 | |||||
| 2025-08-11 | 13F | HHM Wealth Advisors, LLC | 85 | 0,00 | 4 | 33,33 | ||||
| 2025-08-05 | 13F | Key FInancial Inc | 78 | 0,00 | 4 | 0,00 | ||||
| 2025-08-12 | 13F | SRS Capital Advisors, Inc. | 250 | 0,00 | 12 | 9,09 | ||||
| 2025-08-14 | 13F | Heritage Wealth Management, Inc. | 17 850 | 0,00 | 884 | 6,25 | ||||
| 2025-07-28 | 13F | Patten & Patten Inc/tn | 8 970 | 0,39 | 444 | 6,73 | ||||
| 2025-04-18 | 13F | Global Trust Asset Management, LLC | 0 | −100,00 | 0 | |||||
| 2025-08-14 | 13F | Tudor Financial Inc. | 0 | −100,00 | 0 | |||||
| 2025-08-14 | 13F | Federation des caisses Desjardins du Quebec | 580 | 0,00 | 29 | 3,70 | ||||
| 2025-07-17 | 13F | Janney Montgomery Scott LLC | 20 823 | −2,36 | 1 | |||||
| 2025-07-21 | 13F | Ameritas Advisory Services, LLC | 1 332 | 66 | ||||||
| 2025-06-26 | NP | TAAAX - Thrivent Aggressive Allocation Fund Class A | 0 | −100,00 | 0 | −100,00 | ||||
| 2025-08-14 | 13F | Jane Street Group, Llc | Put | 14 300 | 26,55 | 709 | 34,60 | |||
| 2025-06-26 | NP | TCAAX - Thrivent Moderately Conservative Allocation Fund Class A | 0 | −100,00 | 0 | −100,00 | ||||
| 2025-06-26 | NP | AALGX - Thrivent Global Stock Fund Class A | 0 | −100,00 | 0 | −100,00 | ||||
| 2025-06-26 | NP | TMAAX - Thrivent Moderately Aggressive Allocation Fund Class A | 0 | −100,00 | 0 | −100,00 | ||||
| 2025-06-26 | NP | THMAX - Thrivent Moderate Allocation Fund Class A | 0 | −100,00 | 0 | −100,00 | ||||
| 2025-06-26 | NP | TSCGX - Thrivent Small Cap Growth Fund Class S | 0 | −100,00 | 0 | −100,00 | ||||
| 2025-07-02 | 13F | Dentgroup LLC | 13 593 | −13,83 | 674 | −8,44 | ||||
| 2025-08-07 | 13F | Allworth Financial LP | 1 095 | 559,64 | 54 | 671,43 | ||||
| 2025-08-14 | 13F | Headlands Technologies LLC | 500 | 25 | ||||||
| 2025-08-14 | 13F | UBS Group AG | 143 150 | −42,27 | 7 093 | −38,66 | ||||
| 2025-08-06 | 13F | Commonwealth Equity Services, Llc | 106 403 | −7,94 | 5 | 0,00 | ||||
| 2025-08-12 | 13F | Global Retirement Partners, LLC | 1 922 | 0,58 | 95 | −1,04 | ||||
| 2025-08-14 | 13F | CoreCap Advisors, LLC | 2 466 | −24,36 | 122 | −19,21 | ||||
| 2025-07-10 | 13F | Wealth Enhancement Advisory Services, Llc | 25 620 | −19,67 | 1 343 | −9,68 | ||||
| 2025-04-23 | 13F | Gimbal Financial | 0 | −100,00 | 0 | −100,00 | ||||
| 2025-07-22 | 13F | Sage Financial Group Inc | 10 042 | 0,71 | 498 | 7,11 | ||||
| 2025-07-16 | 13F | Banque Pictet & Cie Sa | 36 947 | −17,89 | 1 831 | −12,77 | ||||
| 2025-08-12 | 13F | O'shaughnessy Asset Management, Llc | 288 | 0,00 | 14 | 7,69 | ||||
| 2025-07-24 | 13F | Us Bancorp \de\ | 212 575 | −7,81 | 10 533 | −2,04 | ||||
| 2025-07-28 | 13F | Harbour Investments, Inc. | 285 | −70,00 | 14 | −68,18 | ||||
| 2025-08-12 | 13F | Proequities, Inc. | 0 | 0 | ||||||
| 2025-08-13 | 13F | Marshall Wace, Llp | 35 671 | 11,06 | 1 767 | 18,04 | ||||
| 2025-07-23 | 13F | Joel Isaacson & Co., LLC | 4 690 | 0,00 | 232 | 6,42 | ||||
| 2025-08-14 | 13F | Qube Research & Technologies Ltd | 0 | −100,00 | 0 | |||||
| 2025-07-16 | 13F | Dakota Wealth Management | 18 484 | 0,00 | 916 | 6,27 | ||||
| 2025-07-10 | 13F | High Net Worth Advisory Group LLC | 7 140 | 0,00 | 354 | 6,33 | ||||
| 2025-05-05 | 13F | Transce3nd, LLC | 0 | −100,00 | 0 | |||||
| 2025-07-08 | 13F | Ballew Advisors, Inc | 10 314 | 0,35 | 541 | 29,81 | ||||
| 2025-08-13 | 13F | Cerity Partners LLC | 4 373 | 217 | ||||||
| 2025-07-14 | 13F | AdvisorNet Financial, Inc | 1 480 | 0,68 | 73 | 7,35 | ||||
| 2025-08-08 | 13F | Smithfield Trust Co | 10 | 0 | ||||||
| 2025-08-12 | 13F | Founders Financial Alliance, LLC | 535 | 0,56 | 27 | 8,33 | ||||
| 2025-08-14 | 13F | Sand Hill Global Advisors, LLC | 4 090 | 203 | ||||||
| 2025-08-18 | 13F | Geneos Wealth Management Inc. | 314 | 0,00 | 16 | 7,14 | ||||
| 2025-07-30 | 13F | Bogart Wealth, LLC | 351 | 0,00 | 17 | 6,25 | ||||
| 2025-07-31 | 13F | City State Bank | 1 100 | 0,00 | 55 | 5,88 | ||||
| 2025-07-03 | 13F | Garde Capital, Inc. | 1 420 | 0,00 | 70 | 6,06 | ||||
| 2025-05-15 | 13F | D. E. Shaw & Co., Inc. | 0 | −100,00 | 0 | |||||
| 2025-08-29 | 13F | Centaurus Financial, Inc. | 0 | −100,00 | 0 | |||||
| 2025-07-22 | 13F | SOL Capital Management CO | 5 000 | 0,00 | 0 | |||||
| 2025-07-30 | 13F | Atlantic Edge Private Wealth Management, LLC | 0 | −100,00 | 0 | |||||
| 2025-08-14 | 13F | Prestige Wealth Management Group LLC | 16 | 0,00 | 1 | |||||
| 2025-07-24 | 13F | Blair William & Co/il | 1 567 | 22,71 | 78 | 30,51 | ||||
| 2025-05-15 | 13F | MidWestOne Financial Group, Inc. | 0 | −100,00 | 0 | |||||
| 2025-07-29 | 13F | Stephens Inc /ar/ | 11 087 | −21,81 | 549 | −16,94 | ||||
| 2025-08-14 | 13F | Citadel Advisors Llc | Call | 28 300 | 63,58 | 1 402 | 73,95 | |||
| 2025-08-14 | 13F | Citadel Advisors Llc | 57 593 | −37,43 | 2 854 | −33,53 | ||||
| 2025-07-21 | 13F | Cape Cod Five Cents Savings Bank | 4 249 | 0,00 | 202 | 0,00 | ||||
| 2025-07-11 | 13F | Orrstown Financial Services Inc | 5 595 | 277 | ||||||
| 2025-08-07 | 13F | Atala Financial Inc | 0 | −100,00 | 0 | |||||
| 2025-08-08 | 13F | Hartland & Co., LLC | 275 | 0,00 | 14 | 8,33 | ||||
| 2025-08-14 | 13F | Sunbelt Securities, Inc. | 8 143 | 169,73 | 410 | 192,86 | ||||
| 2025-08-14 | 13F | Lighthouse Investment Partners, LLC | 11 210 | 555 | ||||||
| 2025-08-13 | 13F | SCS Capital Management LLC | 49 540 | −21,16 | 2 455 | −16,25 | ||||
| 2025-08-04 | 13F | Creative Financial Designs Inc /adv | 3 583 | 0,67 | 178 | 7,27 | ||||
| 2025-05-02 | 13F | Transcendent Capital Group LLC | 0 | −100,00 | 0 | |||||
| 2025-05-13 | 13F | CacheTech Inc. | 0 | −100,00 | 0 | |||||
| 2025-07-14 | 13F | Toth Financial Advisory Corp | 1 280 | 0,00 | 63 | 6,78 | ||||
| 2025-09-04 | 13F/A | Advisor Group Holdings, Inc. | 210 154 | −2,49 | 10 413 | 3,61 | ||||
| 2025-08-12 | 13F | Bokf, Na | 0 | −100,00 | 0 | |||||
| 2025-07-02 | 13F | Neville Rodie & Shaw Inc | 6 490 | −5,60 | 0 | |||||
| 2025-07-17 | 13F | DiNuzzo Private Wealth, Inc. | 148 | 0,00 | 7 | 16,67 | ||||
| 2025-07-25 | 13F | Muirfield Wealth Advisors Llc | 0 | −100,00 | 0 | |||||
| 2025-08-14 | 13F | Citadel Advisors Llc | Put | 22 000 | −47,37 | 1 090 | −44,07 | |||
| 2025-08-14 | 13F | Ameriprise Financial Inc | 174 308 | 2,64 | 8 637 | 9,03 | ||||
| 2025-04-22 | 13F | 1858 Wealth Management, Llc | 0 | −100,00 | 0 | |||||
| 2025-08-07 | 13F | Kestra Private Wealth Services, Llc | 6 301 | −15,23 | 312 | −9,83 | ||||
| 2025-08-14 | 13F | Royal Bank Of Canada | 244 359 | −15,05 | 12 108 | −9,74 | ||||
| 2025-07-25 | 13F | Atria Wealth Solutions, Inc. | 8 207 | −1,57 | 412 | 5,93 | ||||
| 2025-08-04 | 13F | Atria Investments Llc | 0 | −100,00 | 0 | |||||
| 2025-08-01 | 13F | Envestnet Asset Management Inc | 93 699 | 23,26 | 4 643 | 30,98 | ||||
| 2025-07-16 | 13F | Minichmacgregor Wealth Management, Llc | 0 | −100,00 | 0 | |||||
| 2025-08-13 | 13F | Northwestern Mutual Wealth Management Co | 81 688 | −4,10 | 4 048 | 1,91 | ||||
| 2025-07-16 | 13F | Cadent Capital Advisors, LLC | 22 722 | −67,03 | 1 126 | −64,99 | ||||
| 2025-07-17 | 13F | Oakworth Capital, Inc. | 360 | 0,00 | 18 | 6,25 | ||||
| 2025-05-19 | 13F/A | Jane Street Group, Llc | Call | 0 | −100,00 | 0 | −100,00 | |||
| 2025-08-06 | 13F | First Horizon Advisors, Inc. | 5 367 | 0,00 | 266 | 6,00 | ||||
| 2025-08-08 | 13F | Larson Financial Group LLC | 6 382 | 8,50 | 316 | 15,33 | ||||
| 2025-07-08 | 13F | Nbc Securities, Inc. | 1 488 | −14,97 | 0 | |||||
| 2025-08-11 | 13F | Western Wealth Management, LLC | 0 | −100,00 | 0 | |||||
| 2025-07-09 | 13F | Reyes Financial Architecture, Inc. | 0 | −100,00 | 0 | |||||
| 2025-08-11 | 13F | One Capital Management, LLC | 5 804 | 16,64 | 288 | 23,71 | ||||
| 2025-08-12 | 13F | Pathstone Holdings, LLC | 45 620 | 2 260 | ||||||
| 2025-08-14 | 13F | Bank Of America Corp /de/ | 390 505 | −37,02 | 19 350 | −33,08 | ||||
| 2025-08-13 | 13F | Quadrature Capital Ltd | 0 | −100,00 | 0 | |||||
| 2025-04-10 | 13F | Arrien Investments, Inc. | 0 | −100,00 | 0 | −100,00 | ||||
| 2025-08-14 | 13F | Raymond James Financial Inc | 108 499 | −15,41 | 5 376 | −10,10 | ||||
| 2025-08-14 | 13F | Cardiff Park Advisors, Llc | 2 402 | 0,84 | 119 | 7,21 | ||||
| 2025-08-13 | 13F | Jones Financial Companies Lllp | 75 272 | 32,40 | 3 717 | 42,10 | ||||
| 2025-08-14 | 13F | Snowden Capital Advisors LLC | 10 847 | 0,38 | 537 | 6,76 | ||||
| 2025-08-12 | 13F | MAI Capital Management | 1 000 | −17,76 | 50 | −12,50 | ||||
| 2025-08-18 | 13F | N.E.W. Advisory Services LLC | 157 | 0,00 | 8 | 0,00 | ||||
| 2025-08-14 | 13F | MGB Wealth Management, LLC | 1 350 | 0,00 | 67 | 6,45 | ||||
| 2025-07-29 | 13F | Angeles Wealth Management, Llc | 59 | −41,00 | 3 | −50,00 | ||||
| 2025-08-13 | 13F | Kilter Group LLC | 836 | 41 | ||||||
| 2025-08-12 | 13F | Jpmorgan Chase & Co | 360 619 | 0,54 | 17 869 | 6,83 | ||||
| 2025-07-16 | 13F | Augustine Asset Management Inc | 20 000 | 0,00 | 991 | 6,33 | ||||
| 2025-08-04 | 13F | Spire Wealth Management | 725 | −34,63 | 36 | −31,37 | ||||
| 2025-08-14 | 13F | Fmr Llc | 982 | −48,53 | 49 | −45,45 | ||||
| 2025-07-25 | 13F | Ellis Investment Partners, LLC | 6 264 | 10,46 | 310 | 17,42 | ||||
| 2025-08-05 | 13F | Crestwood Advisors Group LLC | 51 532 | −1,95 | 2 553 | 4,20 | ||||
| 2025-08-11 | 13F | HighTower Advisors, LLC | 6 972 | −18,66 | 345 | −13,53 | ||||
| 2025-08-07 | 13F | Addison Advisors LLC | 0 | −100,00 | 0 | |||||
| 2025-08-26 | 13F/A | Thrivent Financial For Lutherans | 25 605 | 24,10 | 1 | |||||
| 2025-08-18 | 13F/A | National Bank Of Canada /fi/ | 3 393 | 0,00 | 168 | 6,33 | ||||
| 2025-08-11 | 13F | Citigroup Inc | 1 940 | −64,16 | 96 | −61,90 | ||||
| 2025-07-09 | 13F | Fiduciary Alliance LLC | 11 915 | 590 | ||||||
| 2025-08-08 | 13F | Pnc Financial Services Group, Inc. | 3 620 | 6,10 | 179 | 12,58 | ||||
| 2025-07-25 | 13F | Cwm, Llc | 16 580 | −18,57 | 1 | |||||
| 2025-08-19 | 13F | Asset Dedication, LLC | 150 | 0,00 | 7 | 16,67 | ||||
| 2025-08-01 | 13F | Logan Capital Management Inc | 1 | 0,00 | 0 | |||||
| 2025-08-11 | 13F | Principal Securities, Inc. | 1 294 | 6,07 | 64 | 4,92 | ||||
| 2025-08-12 | 13F | CIBC Private Wealth Group, LLC | 1 747 | −79,92 | 87 | −75,07 | ||||
| 2025-08-07 | 13F | Winthrop Capital Management, LLC | 95 | 0,00 | 0 | |||||
| 2025-08-08 | 13F | Family Firm, Inc. | 33 536 | 11,21 | 1 662 | 18,14 | ||||
| 2025-05-14 | 13F | Renaissance Technologies Llc | 0 | −100,00 | 0 | |||||
| 2025-07-29 | 13F | Private Trust Co Na | 700 | −9,44 | 35 | −5,56 | ||||
| 2025-08-14 | 13F | Hrt Financial Lp | 0 | −100,00 | 0 | |||||
| 2025-08-08 | 13F | Comprehensive Financial Planning, Inc./PA | 474 | 1,07 | 23 | 9,52 | ||||
| 2025-07-18 | 13F | Bartlett & Co. Wealth Management Llc | 663 | 0,00 | 33 | 6,67 | ||||
| 2025-08-13 | 13F | Martin & Co Inc /tn/ | 60 120 | −0,77 | 2 979 | 5,42 | ||||
| 2025-05-14 | 13F | Stelac Advisory Services LLC | 0 | −100,00 | 0 | |||||
| 2025-07-11 | 13F | Farther Finance Advisors, LLC | 1 530 | 75,86 | 76 | 87,50 | ||||
| 2025-07-25 | 13F | LRI Investments, LLC | 4 450 | 0,00 | 220 | 6,28 | ||||
| 2025-08-01 | 13F | Transcend Wealth Collective, Llc | 14 500 | 0,00 | 718 | 6,21 | ||||
| 2025-04-29 | 13F | Bank of New York Mellon Corp | 0 | −100,00 | 0 | |||||
| 2025-08-14 | 13F | Susquehanna International Group, Llp | 30 663 | −49,84 | 1 519 | −46,70 | ||||
| 2025-08-14 | 13F | Susquehanna International Group, Llp | Call | 17 800 | −14,01 | 882 | −8,70 | |||
| 2025-08-15 | 13F | Morgan Stanley | 471 034 | −35,83 | 23 340 | −31,81 | ||||
| 2025-08-14 | 13F | Susquehanna International Group, Llp | Put | 19 100 | 946 | |||||
| 2025-08-08 | 13F | Capital Investment Advisory Services, LLC | 430 | 0,00 | 21 | 5,00 | ||||
| 2025-08-14 | 13F | Goldman Sachs Group Inc | 159 565 | −16,35 | 7 906 | −11,12 | ||||
| 2025-04-10 | 13F | St. Clair Advisors, LLC | 0 | −100,00 | 0 | |||||
| 2025-05-13 | 13F | Annandale Capital, LLC | Put | 0 | −100,00 | 0 | ||||
| 2025-07-24 | 13F | Game Plan Financial Advisors, LLC | 5 068 | 6,14 | 251 | 13,06 | ||||
| 2025-07-16 | 13F | Signaturefd, Llc | 11 | 0,00 | 1 | |||||
| 2025-08-12 | 13F | LPL Financial LLC | 208 230 | −2,49 | 10 318 | 3,62 | ||||
| 2025-07-07 | 13F | Thurston, Springer, Miller, Herd & Titak, Inc. | 334 | 215,09 | 17 | 300,00 | ||||
| 2025-05-13 | 13F | Adams Wealth Management | 0 | −100,00 | 0 | |||||
| 2025-07-18 | 13F | SOA Wealth Advisors, LLC. | 2 311 | −9,27 | 114 | −3,39 | ||||
| 2025-08-13 | 13F | AMJ Financial Wealth Management | 0 | −100,00 | 0 | |||||
| 2025-07-11 | 13F | Spence Asset Management | 39 538 | 12,44 | 2 | 0,00 | ||||
| 2025-08-14 | 13F | Jane Street Group, Llc | 11 250 | 9,37 | 557 | 16,28 | ||||
| 2025-08-07 | 13F | Apeiron RIA LLC | 0 | −100,00 | 0 | |||||
| 2025-08-14 | 13F | Millennium Management Llc | 0 | −100,00 | 0 | |||||
| 2025-08-08 | 13F | Cetera Investment Advisers | 55 508 | −6,61 | 2 750 | −0,76 | ||||
| 2025-07-11 | 13F | Kingstone Capital Partners Texas, LLC | 24 248 343 | 277 595,18 | 1 115 | 173,96 | ||||
| 2025-08-14 | 13F | Riggs Asset Managment Co. Inc. | 755 | −89,11 | 37 | −88,54 | ||||
| 2025-07-18 | 13F | Truist Financial Corp | 142 066 | −13,46 | 7 039 | −8,05 | ||||
| 2025-07-21 | 13F | Quent Capital, LLC | 0 | −100,00 | 0 | −100,00 | ||||
| 2025-08-14 | 13F | Two Sigma Investments, Lp | 75 900 | −8,22 | 3 761 | −2,49 | ||||
| 2025-05-19 | 13F | Heck Capital Advisors, LLC | 0 | 0 | ||||||
| 2025-08-14 | 13F | Bnp Paribas Arbitrage, Sa | 31 100 | −11,77 | 1 541 | −6,21 | ||||
| 2025-07-22 | 13F | DAVENPORT & Co LLC | 0 | −100,00 | 0 | |||||
| 2025-07-23 | 13F | Viewpoint Capital Management LLC | 7 992 | 0,00 | 396 | 6,45 | ||||
| 2025-07-16 | 13F | Pictet & Cie (Europe) SA | 9 000 | 0,00 | 446 | 6,21 | ||||
| 2025-08-12 | 13F | Accredited Wealth Management, LLC | 0 | −100,00 | 0 | |||||
| 2025-08-14 | 13F | Harwood Advisory Group, LLC | 381 | 1,33 | 19 | 0,00 | ||||
| 2025-08-12 | 13F | Trexquant Investment LP | 0 | −100,00 | 0 | |||||
| 2025-08-15 | 13F | Tower Research Capital LLC (TRC) | 13 728 | 84,89 | 680 | 96,53 | ||||
| 2025-07-15 | 13F | Fifth Third Bancorp | 623 | 0,00 | 31 | 3,45 | ||||
| 2025-07-18 | 13F | QTR Family Wealth, LLC | 6 624 | 0,21 | 328 | 6,49 | ||||
| 2025-07-15 | 13F | North Star Investment Management Corp. | 9 145 | −21,70 | 453 | −16,73 | ||||
| 2025-07-21 | 13F | HighMark Wealth Management LLC | 200 | 0,00 | 10 | 0,00 | ||||
| 2025-08-14 | 13F | KKM Financial LLC | 0 | −100,00 | 0 | |||||
| 2025-08-12 | 13F | AlphaCore Capital LLC | 591 | 103,09 | 29 | 123,08 | ||||
| 2025-08-14 | 13F | Comerica Bank | 4 011 | −11,08 | 199 | −5,71 | ||||
| 2025-08-07 | 13F | Montag A & Associates Inc | 15 | 1 | ||||||
| 2025-08-14 | 13F | Moneta Group Investment Advisors Llc | 11 256 | 1,01 | 558 | 7,32 | ||||
| 2025-08-06 | 13F | Prospera Financial Services Inc | 0 | −100,00 | 0 | |||||
| 2025-07-16 | 13F/A | CX Institutional | 6 129 | −83,22 | 0 | −100,00 | ||||
| 2025-08-13 | 13F | Flow Traders U.s. Llc | 11 619 | 104,13 | 1 | |||||
| 2025-08-05 | 13F | Benchmark Financial Wealth Advisors, LLC | 0 | −100,00 | 0 | |||||
| 2025-08-06 | 13F | Kcm Investment Advisors Llc | 55 555 | 2,64 | 2 753 | 9,08 |