Grundläggande statistik
| Institutionella ägare | 258 total, 258 long only, 0 short only, 0 long/short - change of −3,70% MRQ |
| Genomsnittlig portföljallokering | 1.7075 % - change of −2,89% MRQ |
| Institutionella aktier (lång) | 98 571 997 (ex 13D/G) - change of −3,30MM shares −3,24% MRQ |
| Institutionellt värde (lång) | $ 3 597 676 USD ($1000) |
Institutionellt ägande och aktieägare
DBX ETF Trust - Xtrackers USD High Yield Corporate Bond ETF (US:HYLB) har 258 Institutionella ägare och aktieägare som har lämnat in 13D/G- eller 13F-formulär till Securities Exchange Commission (SEC). Dessa institut innehar totalt 98,571,997 aktier. Största aktieägare inkluderar Bank Of America Corp /de/, Charles Schwab Investment Management Inc, Wells Fargo & Company/mn, Valmark Advisers, Inc., Voya Investment Management Llc, Pnc Financial Services Group, Inc., Northern Lights Fund Trust - Sierra Tactical Bond Fund Investor Class Shares, Envestnet Asset Management Inc, Wright Fund Managment, LLC, and Royal Bank Of Canada .
DBX ETF Trust - Xtrackers USD High Yield Corporate Bond ETF (ARCA:HYLB) Institutionell ägarstruktur visar institutioners och fonders nuvarande positioner i företaget, samt de senaste förändringarna i positionernas storlek. Större aktieägare kan vara enskilda investerare, fonder, hedgefonder eller institutioner. Bilaga 13D visar att investeraren äger (eller ägde) mer än 5% av företaget och avser (eller avsåg) att aktivt eftersträva en förändring av affärsstrategin. Schedule 13G indikerar en passiv investering på över 5%.
The share price as of September 12, 2025 is 37,00 / share. Previously, on September 13, 2024, the share price was 36,58 / share. This represents an increase of 1,15% over that period.

Fondsentimentets poäng
Fondsentimentet poängen(fka Ägarackumulation-poäng) visar vilka aktier som är mest köpta av fonder. Det är resultatet av en sofistikerad kvantitativ flerfaktormodell som identifierar företag med de högsta nivåerna av institutionell ackumulering. Poängsättningsmodellen använder en kombination av den totala ökningen av redovisade ägare, förändringarna i portföljallokeringarna för dessa ägare och andra mått. Siffran sträcker sig från 0 till 100, där högre siffror indikerar en högre nivå av ackumulering i förhållande till sina konkurrenter, och 50 är genomsnittet.
Uppdateringsfrekvens: Dagligen
Se Ownership Explorer, som innehåller en lista över de högst rankade företagen.
Institutionell sälj/köp-kvot
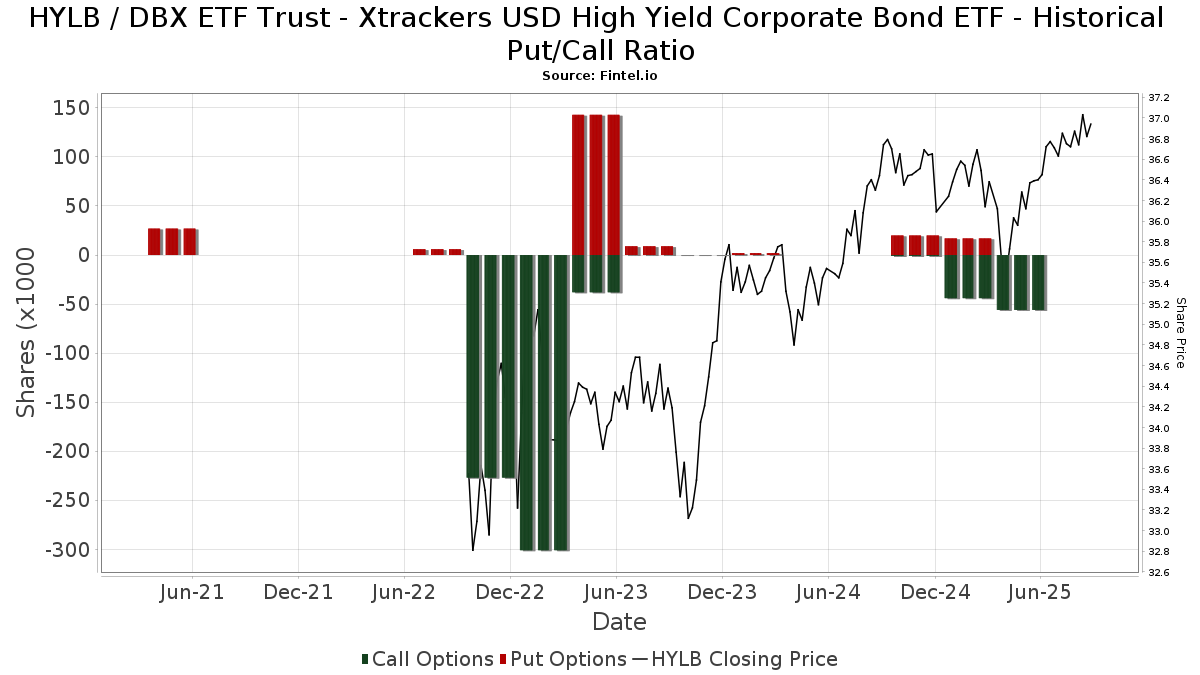
Förutom att rapportera vanliga eget kapital- och skuldemissioner måste institutioner med mer än 100MM tillgångar under förvaltning också avslöja sina innehav av sälj- och köpoptioner. Eftersom säljoptioner i allmänhet indikerar ett negativt sentiment och köpoptioner indikerar ett positivt sentiment, kan vi få en uppfattning om det övergripande institutionella sentimentet genom att plotta förhållandet mellan säljoptioner och köpoptioner. Diagrammet till höger visar det historiska förhållandet mellan sälj- och köpoptioner för detta instrument.
Genom att använda sälj/köp-kvoten som en indikator på aktieägarnas sentiment undviker man en av de största bristerna med att använda det totala institutionella ägandet, nämligen att en betydande del av de förvaltade tillgångarna investeras passivt för att följa index. Passivt förvaltade fonder köper vanligtvis inte optioner, så indikatorn för sälj/köp-kvoten ger en bättre bild av stämningen i aktivt förvaltade fonder.
13F- och NPORT-arkiveringar
Detaljer om 13F-arkiveringar är gratis. Detaljer om NP-arkiveringar kräver ett premiummedlemskap. Gröna rader indikerar nya positioner. Röda rader indikerar stängda positioner. Klicka på länk symbolen för att se hela transaktionshistoriken.
Uppgradera
för att låsa upp premiumdata och exportera till Excel ![]() .
.
| Fil Datum | Källa | Investerare | Typ | Genomsnittligt pris (beräknat) |
Aktier | Δ Aktier (%) |
Rapporterat värde (1000 USD) |
Δ Värde (%) |
Portföljallokering (%) |
|
|---|---|---|---|---|---|---|---|---|---|---|
| 2025-08-14 | 13F | Navigoe, LLC | 0 | −100,00 | 0 | |||||
| 2025-08-26 | NP | Northern Lights Variable Trust - TOPS Moderate Growth ETF Portfolio Class 1 shares | 276 550 | 4,95 | 10 210 | 7,19 | ||||
| 2025-05-06 | 13F | Fpc Investment Advisory, Inc. | 0 | −100,00 | 0 | |||||
| 2025-08-13 | 13F | Continuum Advisory, LLC | 0 | −100,00 | 0 | |||||
| 2025-05-02 | 13F | United Community Bank | 0 | −100,00 | 0 | |||||
| 2025-08-08 | 13F | Financial Gravity Companies, Inc. | 677 665 | 15,61 | 25 019 | 18,30 | ||||
| 2025-05-13 | 13F | Adams Wealth Management | 6 486 | −4,25 | 234 | −4,10 | ||||
| 2025-07-28 | 13F | Toews Corp /adv | 628 100 | 23 189 | ||||||
| 2025-08-08 | 13F | Fortis Group Advisors, LLC | 106 | 0,00 | 4 | 0,00 | ||||
| 2025-08-04 | 13F | Arkadios Wealth Advisors | 15 245 | −0,55 | 563 | 1,44 | ||||
| 2025-08-13 | 13F | Renaissance Technologies Llc | 377 700 | −9,36 | 13 945 | −7,43 | ||||
| 2025-08-14 | 13F | Engineers Gate Manager LP | 0 | −100,00 | 0 | |||||
| 2025-08-14 | 13F | Great Valley Advisor Group, Inc. | 40 834 | −3,09 | 1 508 | −1,05 | ||||
| 2025-07-17 | 13F | Wolff Wiese Magana Llc | 4 | 0 | ||||||
| 2025-05-12 | 13F | Sandy Spring Bank | 743 | 18,50 | 27 | 18,18 | ||||
| 2025-07-21 | 13F | New Century Financial Group, LLC | 0 | −100,00 | 0 | |||||
| 2025-08-12 | 13F | LPL Financial LLC | 375 703 | −32,94 | 13 871 | −31,51 | ||||
| 2025-08-13 | 13F | Employees Retirement System of Texas | 470 | 2,17 | ||||||
| 2025-08-28 | NP | GPIFX - GuidePath(R) Flexible Income Allocation Fund Service Shares | 1 125 182 | 99,13 | 41 542 | 103,37 | ||||
| 2025-07-18 | 13F | Bartlett & Co. Wealth Management Llc | 31 | 0,00 | 1 | 0,00 | ||||
| 2025-05-13 | 13F | CacheTech Inc. | 6 486 | −4,25 | 234 | −4,10 | ||||
| 2025-08-14 | 13F | Bank Of America Corp /de/ | 21 218 380 | 8,85 | 783 383 | 11,17 | ||||
| 2025-05-16 | 13F/A | Kestra Investment Management, LLC | 0 | −100,00 | 0 | |||||
| 2025-07-24 | 13F | Us Bancorp \de\ | 2 312 | −40,09 | 85 | −38,85 | ||||
| 2025-08-26 | NP | Northern Lights Variable Trust - TOPS Growth ETF Portfolio Class 2 shares | 208 595 | 10,11 | 7 701 | 12,46 | ||||
| 2025-08-18 | 13F | Geneos Wealth Management Inc. | 5 892 | −0,81 | 218 | 1,40 | ||||
| 2025-07-17 | 13F | Beacon Capital Management, LLC | 15 | 1 | ||||||
| 2025-07-24 | 13F | Endeavor Private Wealth, Inc. | 8 363 | −47,24 | 309 | −46,25 | ||||
| 2025-08-14 | 13F | Colony Group, LLC | 411 888 | 4,46 | 15 207 | 6,68 | ||||
| 2025-05-01 | 13F | Rational Advisors Llc | 0 | −100,00 | 0 | |||||
| 2025-08-14 | 13F | Susquehanna International Group, Llp | 0 | −100,00 | 0 | |||||
| 2025-07-08 | 13F | Nbc Securities, Inc. | 18 329 | 109,55 | 1 | |||||
| 2025-08-12 | 13F | Jpmorgan Chase & Co | 223 441 | 1 103,04 | 8 249 | 1 129,36 | ||||
| 2025-07-25 | 13F | Allspring Global Investments Holdings, LLC | 8 410 | 0,00 | 310 | 1,97 | ||||
| 2025-08-14 | 13F | Aqr Capital Management Llc | 240 956 | 0,00 | 8 896 | 2,14 | ||||
| 2025-06-27 | NP | THY - Agility Shares Dynamic Tactical Income ETF | 253 100 | 7,29 | 9 119 | 5,68 | ||||
| 2025-08-14 | 13F | Horizon Investments, LLC | 838 233 | 68,30 | 30 621 | 71,83 | ||||
| 2025-05-14 | 13F | Truvestments Capital Llc | 0 | −100,00 | 0 | |||||
| 2025-07-30 | 13F | Brookstone Capital Management | 24 586 | −11,75 | 908 | −9,93 | ||||
| 2025-08-14 | 13F | Hurley Capital, LLC | 0 | −100,00 | 0 | |||||
| 2025-07-28 | 13F | Harbour Investments, Inc. | 705 | −0,28 | 26 | 4,00 | ||||
| 2025-08-13 | 13F | WCG Wealth Advisors LLC | 22 634 | −9,64 | 836 | −7,73 | ||||
| 2025-07-07 | 13F | Thurston, Springer, Miller, Herd & Titak, Inc. | 187 | 567,86 | 7 | 500,00 | ||||
| 2025-08-11 | 13F | Brown Brothers Harriman & Co | 3 | 0 | ||||||
| 2025-08-11 | 13F | Citigroup Inc | 143 475 | 86,07 | 5 297 | 90,06 | ||||
| 2025-08-14 | 13F | Sunbelt Securities, Inc. | 0 | −100,00 | 0 | |||||
| 2025-05-12 | 13F | Founders Financial Securities Llc | 0 | −100,00 | 0 | |||||
| 2025-08-14 | 13F | Kovitz Investment Group Partners, LLC | 219 160 | 8 091 | ||||||
| 2025-07-11 | 13F | Pinnacle Bancorp, Inc. | 41 | 0,00 | 2 | 0,00 | ||||
| 2025-08-13 | 13F | Hsbc Holdings Plc | 31 777 | 77,68 | 1 173 | 81,58 | ||||
| 2025-08-14 | 13F | Wells Fargo & Company/mn | 4 826 048 | −1,50 | 178 178 | 0,59 | ||||
| 2025-08-06 | 13F | AE Wealth Management LLC | 2 308 | 2,21 | 85 | 4,94 | ||||
| 2025-07-21 | 13F | Mendota Financial Group, LLC | 68 | 0,00 | 3 | 0,00 | ||||
| 2025-08-28 | NP | BTSAX - BTS Managed Income Fund Class A Shares | 23 613 | −10,89 | 872 | −8,99 | ||||
| 2025-08-13 | 13F | EverSource Wealth Advisors, LLC | 508 | −25,18 | 19 | −25,00 | ||||
| 2025-08-14 | 13F | Two Sigma Securities, Llc | 0 | −100,00 | 0 | |||||
| 2025-08-15 | 13F | Kestra Advisory Services, LLC | 48 877 | 0,99 | 1 805 | 3,14 | ||||
| 2025-08-07 | 13F | FDx Advisors, Inc. | 10 596 | −1,33 | 0 | |||||
| 2025-08-28 | NP | BTFAX - BTS Tactical Fixed Income Fund Class A Shares | 571 191 | −23,52 | 21 088 | −21,89 | ||||
| 2025-08-14 | 13F | Goldman Sachs Group Inc | 1 096 690 | −47,65 | 40 490 | −46,53 | ||||
| 2025-07-30 | 13F | Bogart Wealth, LLC | 205 | 52,99 | 8 | 75,00 | ||||
| 2025-05-14 | 13F | Van Hulzen Asset Management, LLC | 0 | −100,00 | 0 | |||||
| 2025-07-25 | 13F | Envestnet Portfolio Solutions, Inc. | 12 732 | −97,05 | 470 | −96,98 | ||||
| 2025-08-07 | 13F | Resources Investment Advisors, LLC. | 7 732 | −58,19 | 285 | −57,34 | ||||
| 2025-07-09 | 13F | Christopher J. Hasenberg, Inc | 55 | 0,00 | 2 | 100,00 | ||||
| 2025-07-18 | 13F | Truist Financial Corp | 14 320 | 23,19 | 529 | 25,71 | ||||
| 2025-07-28 | 13F | WealthPlan Investment Management, LLC | 14 210 | −0,55 | 525 | 1,55 | ||||
| 2025-08-26 | NP | TBFC - The Brinsmere Fund - Conservative ETF | 173 047 | −2,62 | 6 389 | −0,54 | ||||
| 2025-07-24 | NP | HTFNX - Horizon Tactical Fixed Income Fund Investor Class | 842 587 | −36,19 | 30 721 | −36,64 | ||||
| 2025-08-04 | 13F | Assetmark, Inc | 1 118 080 | 97,95 | 41 280 | 102,17 | ||||
| 2025-08-07 | 13F | PFG Advisors | 0 | −100,00 | 0 | |||||
| 2025-07-25 | 13F | Concord Wealth Partners | 4 293 | 0,96 | 159 | 3,27 | ||||
| 2025-08-11 | 13F | Performa Ltd (US), LLC | 1 298 956 | 8,25 | 47 957 | 10,56 | ||||
| 2025-07-24 | 13F | Robertson Stephens Wealth Management, LLC | 409 926 | 15 134 | ||||||
| 2025-08-05 | 13F | Tme Financial, Inc. | 6 100 | −4,73 | 225 | −2,60 | ||||
| 2025-08-05 | 13F | Key FInancial Inc | 8 | 0,00 | 0 | |||||
| 2025-08-01 | 13F | Koss-Olinger Consulting, LLC | 14 856 | 6,59 | 548 | 8,73 | ||||
| 2025-08-14 | 13F/A | Rockefeller Capital Management L.P. | 32 945 | 111,93 | 1 216 | 116,76 | ||||
| 2025-08-08 | 13F | Avantax Advisory Services, Inc. | 18 041 | −12,53 | 666 | −10,60 | ||||
| 2025-08-11 | 13F | Strategic Wealth Partners, Ltd. | 123 | 5 | ||||||
| 2025-08-11 | 13F | Banque Cantonale Vaudoise | 760 | 0,00 | 0 | |||||
| 2025-08-11 | 13F | Root Financial Partners, LLC | 6 560 | −0,26 | 242 | 2,11 | ||||
| 2025-08-05 | 13F | Fourth Dimension Wealth, LLC | 1 989 | −15,65 | 73 | −14,12 | ||||
| 2025-08-26 | NP | Northern Lights Variable Trust - TOPS Managed Risk Growth ETF Portfolio Class 1 shares | 115 635 | −3,01 | 4 269 | −0,93 | ||||
| 2025-08-13 | 13F | Jones Financial Companies Lllp | 2 835 | 32,17 | 104 | 35,06 | ||||
| 2025-07-29 | 13F | Koshinski Asset Management, Inc. | 13 208 | −0,22 | 488 | 1,88 | ||||
| 2025-08-05 | 13F | Huntington National Bank | 0 | −100,00 | ||||||
| 2025-07-25 | 13F | Cwm, Llc | 11 405 | 24,60 | 0 | |||||
| 2025-08-12 | 13F | MAI Capital Management | 559 | 0,00 | 21 | 0,00 | ||||
| 2025-08-13 | 13F | Tranquilli Financial Advisor LLC | 0 | −100,00 | 0 | |||||
| 2025-07-25 | 13F | Sequoia Financial Advisors, LLC | 6 929 | −13,47 | 256 | −11,76 | ||||
| 2025-07-07 | 13F | Investors Research Corp | 35 | 0,00 | 1 | 0,00 | ||||
| 2025-08-15 | 13F | Morgan Stanley | 585 926 | 14,81 | 21 632 | 17,26 | ||||
| 2025-07-24 | NP | AIHAX - Horizon Active Income Fund Advisor Class | 1 753 | −99,58 | 64 | −99,59 | ||||
| 2025-08-13 | 13F/A | StoneX Group Inc. | 0 | −100,00 | 0 | −100,00 | ||||
| 2025-08-11 | 13F | HighTower Advisors, LLC | 63 220 | 14,10 | 2 334 | 16,53 | ||||
| 2025-08-14 | 13F | Citadel Advisors Llc | Put | 0 | −100,00 | 0 | ||||
| 2025-05-15 | 13F | Tower Research Capital LLC (TRC) | 0 | −100,00 | 0 | |||||
| 2025-07-29 | 13F | Liberty Square Wealth Partners Llc | 57 532 | −12,49 | 2 124 | −10,61 | ||||
| 2025-06-27 | NP | THHYX - Toews Tactical Income Fund | 300 000 | −61,29 | 10 809 | −61,87 | ||||
| 2025-08-12 | 13F | Bokf, Na | 0 | −100,00 | 0 | |||||
| 2025-08-14 | 13F | Sentinus, LLC | 21 025 | 33,82 | 776 | 36,86 | ||||
| 2025-08-07 | 13F | Commerce Bank | 9 519 | 0,68 | 351 | 2,93 | ||||
| 2025-08-11 | 13F | Hexagon Capital Partners LLC | 0 | −100,00 | 0 | |||||
| 2025-07-22 | NP | DGFFX - Destinations Global Fixed Income Opportunities Fund Class I | 271 069 | 33,75 | 9 883 | 32,82 | ||||
| 2025-08-12 | 13F | BlackRock, Inc. | 360 | 13 | ||||||
| 2025-08-13 | 13F | Beacon Pointe Advisors, LLC | 9 030 | −1,24 | 333 | 0,91 | ||||
| 2025-07-15 | 13F | Revisor Wealth Management LLC | 0 | −100,00 | 0 | |||||
| 2025-08-14 | 13F | Comerica Bank | 42 725 | −4,58 | 1 577 | −2,53 | ||||
| 2025-07-09 | 13F | Westbourne Investments, Inc. | 7 515 | 0,00 | 277 | 2,21 | ||||
| 2025-07-15 | 13F | Financial Management Professionals, Inc. | 8 | 0,00 | 0 | |||||
| 2025-07-16 | 13F | St Germain D J Co Inc | 0 | −100,00 | 0 | |||||
| 2025-07-08 | 13F | Braun-Bostich & Associates Inc. | 9 005 | 332 | ||||||
| 2025-07-07 | 13F | Horizons Wealth Management | 3 823 | −40,03 | 141 | −38,70 | ||||
| 2025-04-23 | 13F | GenTrust, LLC | 0 | −100,00 | 0 | |||||
| 2025-07-29 | 13F | Regions Financial Corp | 419 906 | 0,84 | 15 503 | 2,99 | ||||
| 2025-08-13 | 13F | Transce3nd, LLC | 52 | 0,00 | 2 | 0,00 | ||||
| 2025-04-30 | 13F | Sofos Investments, Inc. | 631 250 | 8,41 | 22 820 | 11,25 | ||||
| 2025-08-12 | 13F | AlphaCore Capital LLC | 114 | 714,29 | 4 | |||||
| 2025-08-11 | 13F | Aptus Capital Advisors, LLC | 1 665 | 27,20 | 61 | 29,79 | ||||
| 2025-08-14 | 13F | Fmr Llc | 3 416 | 5,46 | 126 | 7,69 | ||||
| 2025-07-28 | 13F | Kiker Wealth Management, LLC | 64 | 68,42 | 2 | 100,00 | ||||
| 2025-08-12 | 13F | Deutsche Bank Ag\ | 2 384 675 | −0,11 | 88 042 | 2,02 | ||||
| 2025-08-05 | 13F | Bank Of Montreal /can/ | 9 585 | 20 736,96 | 354 | 35 200,00 | ||||
| 2025-08-11 | 13F | Lake Street Financial Llc | 0 | −100,00 | 0 | |||||
| 2025-07-25 | 13F | Atria Wealth Solutions, Inc. | 0 | −100,00 | 0 | |||||
| 2025-07-15 | 13F | Boyd Wealth Management, LLC | 323 073 | −0,84 | 11 928 | 1,27 | ||||
| 2025-05-07 | 13F | Objective Capital Management, LLC | 0 | −100,00 | 0 | |||||
| 2025-07-15 | 13F | Heritage Oak Wealth Advisors Llc | 99 711 | −0,71 | 3 681 | 1,40 | ||||
| 2025-07-22 | 13F | DAVENPORT & Co LLC | 9 786 | −12,41 | 361 | −10,42 | ||||
| 2025-08-14 | 13F | Voya Investment Management Llc | 4 458 140 | 2,23 | 164 595 | 4,40 | ||||
| 2025-07-29 | 13F | Activest Wealth Management | 0 | 0 | ||||||
| 2025-07-15 | 13F | Td Private Client Wealth Llc | 253 299 | 15,96 | 9 352 | 18,43 | ||||
| 2025-07-30 | 13F | BTS Asset Management, Inc. | 823 411 | −22,56 | 30 400 | −20,91 | ||||
| 2025-07-16 | 13F | ORG Partners LLC | 0 | −100,00 | 0 | |||||
| 2025-08-11 | 13F | Theory Financial Llc | 208 465 | 43,53 | 7 665 | 46,00 | ||||
| 2025-08-26 | NP | IDXKX - Voya Index Solution 2040 Portfolio Class ADV | 564 879 | 0,24 | 20 855 | 2,37 | ||||
| 2025-07-25 | NP | USCRX - Cornerstone Moderately Aggressive Fund | 286 722 | 0,00 | 10 454 | −0,71 | ||||
| 2025-07-22 | 13F | Merit Financial Group, LLC | 65 273 | 695,04 | 2 410 | 713,85 | ||||
| 2025-08-25 | 13F/A | Promus Capital, LLC | 18 | 0,00 | 1 | |||||
| 2025-08-13 | 13F | Flow Traders U.s. Llc | 16 084 | 1 | ||||||
| 2025-08-18 | 13F/A | National Bank Of Canada /fi/ | 267 000 | 20,40 | 9 858 | 22,97 | ||||
| 2025-08-18 | 13F | Front Row Advisors LLC | 40 | 0,00 | 1 | 0,00 | ||||
| 2025-08-06 | 13F | Commonwealth Equity Services, Llc | 38 189 | −69,53 | 1 | −75,00 | ||||
| 2025-07-25 | 13F | Prostatis Group LLC | 0 | −100,00 | 0 | −100,00 | ||||
| 2025-07-16 | 13F | Signaturefd, Llc | 33 | 1 | ||||||
| 2025-07-15 | 13F | GSB Wealth Management, LLC | 12 | 0,00 | 0 | |||||
| 2025-07-23 | 13F | Columbus Macro, LLC | 8 643 | −1,56 | 319 | 0,63 | ||||
| 2025-07-16 | 13F | Maridea Wealth Management LLC | 17 965 | −1,14 | 663 | 1,07 | ||||
| 2025-07-25 | NP | UCAGX - Cornerstone Aggressive Fund | 42 134 | 0,00 | 1 536 | −0,71 | ||||
| 2025-08-08 | 13F | Wiser Advisor Group LLC | 33 363 | 2,27 | 1 232 | 4,41 | ||||
| 2025-05-14 | 13F | BOK Financial Private Wealth, Inc. | 0 | −100,00 | 0 | |||||
| 2025-07-03 | 13F | Whitcomb & Hess, Inc. | 18 188 | 0,80 | 671 | 2,91 | ||||
| 2025-08-14 | 13F | Aspen Grove Capital, LLC | 0 | −100,00 | 0 | |||||
| 2025-08-13 | 13F | NEOS Investment Management LLC | 1 200 718 | 22,74 | 44 091 | 25,28 | ||||
| 2025-08-07 | 13F | Allworth Financial LP | 2 290 | −5,25 | 85 | −3,45 | ||||
| 2025-08-29 | 13F | Total Investment Management Inc | 17 | 1 | ||||||
| 2025-08-12 | 13F | Proequities, Inc. | 0 | 0 | ||||||
| 2025-08-01 | 13F | May Hill Capital, LLC | 0 | −100,00 | 0 | |||||
| 2025-08-14 | 13F | Smartleaf Asset Management LLC | 2 | 0,00 | 0 | |||||
| 2025-08-11 | 13F | Wbi Investments, Inc. | 33 775 | −4,15 | 1 247 | −2,12 | ||||
| 2025-08-14 | 13F | Mml Investors Services, Llc | 20 186 | 1,38 | 1 | |||||
| 2025-07-24 | NP | HYGY - NEOS Enhanced Income Credit Select ETF | 1 226 968 | 23,24 | 44 735 | 22,36 | ||||
| 2025-04-17 | 13F | Stewardship Advisors, LLC | 0 | −100,00 | 0 | |||||
| 2025-07-25 | NP | USBSX - Cornerstone Moderate Fund | 127 113 | 0,00 | 4 635 | −0,71 | ||||
| 2025-08-14 | 13F | Ameriprise Financial Inc | 679 733 | 0,74 | 25 005 | 2,49 | ||||
| 2025-08-14 | 13F | Raymond James Financial Inc | 211 199 | −25,41 | 7 797 | −23,83 | ||||
| 2025-07-16 | 13F | ORG Wealth Partners, LLC | 46 | 0,00 | 2 | 0,00 | ||||
| 2025-08-08 | 13F | Larson Financial Group LLC | 330 | −74,46 | 12 | −73,91 | ||||
| 2025-08-14 | 13F | Wiley Bros.-aintree Capital, Llc | 105 980 | 9,57 | 3 915 | 12,47 | ||||
| 2025-07-21 | 13F | Ameriflex Group, Inc. | 1 017 | 9,00 | 37 | 12,12 | ||||
| 2025-05-13 | 13F | Franklin Resources Inc | 0 | −100,00 | 0 | |||||
| 2025-07-17 | 13F | Keystone Global Partners, LLC | 0 | −100,00 | 0 | |||||
| 2025-08-27 | 13F/A | Brinker Capital Investments, LLC | 11 046 | 408 | ||||||
| 2025-08-01 | 13F | Solstein Capital, LLC | 11 | 0 | ||||||
| 2025-07-14 | 13F | AdvisorNet Financial, Inc | 156 | −21,21 | 6 | −28,57 | ||||
| 2025-08-19 | 13F | National Asset Management, Inc. | 0 | −100,00 | 0 | |||||
| 2025-08-06 | 13F | Atlantic Union Bankshares Corp | 631 | 23 | ||||||
| 2025-04-08 | 13F | Avenue 1 Advisors, LLC | 0 | −100,00 | 0 | |||||
| 2025-07-17 | 13F | Hengehold Capital Management Llc | 23 844 | −1,57 | 880 | 0,57 | ||||
| 2025-08-11 | 13F | Rothschild Investment Llc | 12 | 0 | ||||||
| 2025-08-05 | 13F | Optivise Advisory Services LLC | 44 195 | 1 632 | ||||||
| 2025-07-18 | 13F/A | MJT & Associates Financial Advisory Group, Inc. | 5 035 | −0,18 | 186 | 1,65 | ||||
| 2025-08-13 | 13F | Northwestern Mutual Wealth Management Co | 1 988 | 9,59 | 73 | 12,31 | ||||
| 2025-07-21 | 13F | Curran Financial Partners, LLC | 120 728 | 15,53 | 4 457 | 18,00 | ||||
| 2025-08-11 | 13F | Principal Securities, Inc. | 21 655 | −75,32 | 800 | −74,76 | ||||
| 2025-06-20 | NP | ABXB - TrimTabs Donoghue Forlines Tactical High Yield ETF | 1 955 | −83,12 | 70 | −83,45 | ||||
| 2025-08-11 | 13F | Delta Asset Management Llc/tn | 147 | 0,00 | 5 | 0,00 | ||||
| 2025-08-13 | 13F | Capital Analysts, Inc. | 2 522 | 79,37 | 0 | |||||
| 2025-04-29 | 13F | Pensionmark Financial Group, Llc | 0 | −100,00 | 0 | |||||
| 2025-07-14 | 13F | Iams Wealth Management, Llc | 22 706 | 838 | ||||||
| 2025-08-07 | 13F | Retirement Investment Advisors, Inc. | 508 003 | 5,34 | 18 755 | 7,58 | ||||
| 2025-08-14 | 13F | MIRAE ASSET GLOBAL ETFS HOLDINGS Ltd. | 329 612 | 10,18 | 12 130 | 12,32 | ||||
| 2025-08-12 | 13F | Ameritas Investment Partners, Inc. | 2 591 | −37,75 | 96 | −36,67 | ||||
| 2025-08-05 | 13F | Marion Wealth Management | 171 253 | 2,34 | 6 323 | 4,51 | ||||
| 2025-08-13 | 13F | Baird Financial Group, Inc. | 104 831 | 2,13 | 3 870 | 4,31 | ||||
| 2025-07-31 | 13F | Wright Fund Managment, LLC | 2 470 000 | 0,00 | 89 290 | 0,00 | ||||
| 2025-08-13 | 13F | Russell Investments Group, Ltd. | 0 | −100,00 | 0 | |||||
| 2025-08-07 | 13F | Efficient Advisors, LLC | 0 | −100,00 | 0 | |||||
| 2025-08-14 | 13F | Bnp Paribas Arbitrage, Sa | 69 903 | 2 581 | ||||||
| 2025-07-10 | 13F | Wealth Enhancement Advisory Services, Llc | 43 974 | −37,93 | 1 617 | −36,86 | ||||
| 2025-08-12 | 13F | Wayfinding Financial, LLC | 0 | −100,00 | 0 | |||||
| 2025-08-05 | 13F | GPS Wealth Strategies Group, LLC | 135 | 2 600,00 | 5 | |||||
| 2025-05-15 | 13F | Rakuten Investment Management, Inc. | 248 156 | 16,94 | 8 958 | 14,35 | ||||
| 2025-07-21 | 13F | Barrett & Company, Inc. | 0 | −100,00 | 0 | |||||
| 2025-08-01 | 13F | Ashton Thomas Private Wealth, LLC | 0 | −100,00 | 0 | |||||
| 2025-05-16 | 13F | Coppell Advisory Solutions LLC | 0 | −100,00 | 0 | |||||
| 2025-05-02 | 13F | Leelyn Smith, LLC | 0 | −100,00 | 0 | |||||
| 2025-08-08 | 13F | Pnc Financial Services Group, Inc. | 2 770 286 | 16,45 | 102 279 | 18,93 | ||||
| 2025-07-24 | 13F | Ronald Blue Trust, Inc. | 1 109 | 176,56 | 41 | 185,71 | ||||
| 2025-08-12 | 13F | Steward Partners Investment Advisory, Llc | 11 454 | −28,02 | 423 | −26,61 | ||||
| 2025-07-17 | 13F | Fifth Third Securities, Inc. | 38 692 | −4,77 | 1 429 | −2,72 | ||||
| 2025-07-08 | 13F | Parallel Advisors, LLC | 197 | 7,65 | 7 | 16,67 | ||||
| 2025-07-30 | 13F | Onyx Bridge Wealth Group LLC | 55 498 | −3,73 | 2 049 | −1,68 | ||||
| 2025-08-26 | NP | IDXHX - Voya Index Solution 2030 Portfolio Class S | 511 356 | −0,26 | 18 879 | 1,87 | ||||
| 2025-04-11 | 13F | Davis Capital Management | 359 | 0,00 | 13 | 0,00 | ||||
| 2025-08-08 | 13F | Hartland & Co., LLC | 453 808 | −14,84 | 16 755 | −13,03 | ||||
| 2025-08-12 | NP | KAMIX - Kensington Managed Income Fund Institutional Class Shares | 1 889 800 | 94,82 | 69 771 | 98,98 | ||||
| 2025-08-12 | 13F | Charles Schwab Investment Management Inc | 6 310 158 | −3,54 | 232 971 | −1,48 | ||||
| 2025-07-22 | 13F | Simplicity Wealth,LLC | 23 256 | 110,06 | 859 | 114,50 | ||||
| 2025-08-06 | 13F | Adviser Investments LLC | 0 | −100,00 | 0 | |||||
| 2025-08-12 | 13F | TCTC Holdings, LLC | 1 961 | 72 | ||||||
| 2025-04-14 | 13F | Umb Bank N A/mo | 0 | −100,00 | 0 | |||||
| 2025-07-17 | 13F | Sound Income Strategies, LLC | 2 755 | −2,30 | 102 | 0,00 | ||||
| 2025-07-21 | 13F | Ameritas Advisory Services, LLC | 269 | 10 | ||||||
| 2025-08-07 | 13F | Vise Technologies, Inc. | 31 863 | 143,53 | 1 176 | 149,15 | ||||
| 2025-08-26 | NP | Northern Lights Variable Trust - TOPS Managed Risk Balanced ETF Portfolio Class 2 shares | 55 809 | −3,12 | 2 060 | −1,06 | ||||
| 2025-08-13 | 13F | Townsquare Capital Llc | 0 | −100,00 | 0 | |||||
| 2025-07-25 | 13F | Concurrent Investment Advisors, LLC | 5 618 | 207 | ||||||
| 2025-08-14 | 13F | CoreCap Advisors, LLC | 1 045 | 150,60 | 39 | 153,33 | ||||
| 2025-07-14 | 13F | Park Avenue Securities Llc | 8 263 | −13,97 | 0 | |||||
| 2025-08-14 | 13F | GWM Advisors LLC | 22 985 | 35,56 | 849 | 38,56 | ||||
| 2025-08-14 | 13F | UBS Group AG | 283 892 | −69,42 | 10 481 | −68,77 | ||||
| 2025-08-26 | NP | ISDAX - Voya Index Solution 2025 Portfolio Class ADV | 938 990 | 11,77 | 34 668 | 14,15 | ||||
| 2025-08-28 | NP | Northern Lights Fund Trust - Sierra Tactical Bond Fund Investor Class Shares | 2 755 500 | 11,56 | 101 733 | 13,94 | ||||
| 2025-04-15 | 13F | Transform Wealth, LLC | 166 491 | −13,65 | 6 019 | −13,48 | ||||
| 2025-08-14 | 13F | Jane Street Group, Llc | 0 | −100,00 | 0 | |||||
| 2025-08-06 | 13F | First Horizon Advisors, Inc. | 323 | −94,28 | 12 | −94,61 | ||||
| 2025-08-13 | 13F | Virtue Capital Management, LLC | 23 438 | 865 | ||||||
| 2025-07-31 | 13F | CVA Family Office, LLC | 65 | 0,00 | 2 | 0,00 | ||||
| 2025-08-14 | 13F | Prelude Capital Management, Llc | 0 | −100,00 | 0 | |||||
| 2025-08-14 | 13F | Royal Bank Of Canada | 2 467 457 | −28,59 | 91 099 | −27,07 | ||||
| 2025-07-15 | 13F | Fifth Third Bancorp | 557 239 | −14,27 | 20 573 | −12,44 | ||||
| 2025-07-24 | 13F | IFP Advisors, Inc | 2 254 | 17,89 | 83 | 20,29 | ||||
| 2025-08-13 | 13F | Congress Wealth Management LLC / DE / | 54 176 | 2,91 | 2 000 | 5,10 | ||||
| 2025-08-26 | NP | Northern Lights Variable Trust - TOPS Balanced ETF Portfolio Class 1 shares | 144 821 | 2,22 | 5 347 | 4,39 | ||||
| 2025-07-15 | 13F | World Equity Group, Inc. | 17 659 | 652 | ||||||
| 2025-07-09 | 13F | Dynamic Advisor Solutions LLC | 181 140 | 4,39 | 6 688 | 6,62 | ||||
| 2025-08-13 | 13F | Amundi | 226 793 | −31,17 | 8 339 | −29,06 | ||||
| 2025-08-26 | NP | ISKAX - Voya Index Solution Income Portfolio Class ADV | 605 895 | −2,25 | 22 370 | −0,17 | ||||
| 2025-08-05 | 13F | Centennial Bank/AR/ | 1 056 | 0,00 | 39 | 0,00 | ||||
| 2025-08-12 | 13F | Prudential Plc | 880 259 | −46,24 | 32 499 | −45,10 | ||||
| 2025-08-13 | 13F | Quadrature Capital Ltd | 180 946 | 6 681 | ||||||
| 2025-08-14 | 13F | Headlands Technologies LLC | 0 | −100,00 | 0 | −100,00 | ||||
| 2025-05-09 | 13F | GeoWealth Management, LLC | 0 | −100,00 | 0 | |||||
| 2025-08-05 | 13F | Bank of New York Mellon Corp | 0 | −100,00 | 0 | |||||
| 2025-08-07 | 13F | 1620 Investment Advisors, Inc. | 206 | 0,00 | 8 | 0,00 | ||||
| 2025-08-26 | NP | ISEIX - Voya Index Solution 2035 Portfolio Class I | 867 248 | −0,48 | 32 019 | 1,64 | ||||
| 2025-07-17 | 13F | C2C Wealth Management, LLC | 38 298 | 0,00 | 1 414 | 2,10 | ||||
| 2025-08-12 | 13F | American Century Companies Inc | 1 459 555 | −0,32 | 53 887 | 1,81 | ||||
| 2025-08-14 | 13F | Betterment LLC | 263 187 | −8,22 | 10 | −10,00 | ||||
| 2025-08-11 | 13F | HHM Wealth Advisors, LLC | 718 | 0,00 | 27 | 4,00 | ||||
| 2025-08-12 | 13F | Coldstream Capital Management Inc | 0 | −100,00 | 0 | |||||
| 2025-08-13 | 13F | Kilter Group LLC | 8 | 0 | ||||||
| 2025-08-14 | 13F | Citadel Advisors Llc | Call | 56 600 | 26,91 | 2 090 | 29,59 | |||
| 2025-08-04 | 13F | Atria Investments Llc | 137 038 | 42,34 | 5 059 | 45,37 | ||||
| 2025-04-22 | 13F | Castleview Partners, Llc | 0 | −100,00 | 0 | |||||
| 2025-08-19 | 13F | Delos Wealth Advisors, LLC | 46 | 2 | ||||||
| 2025-09-04 | 13F/A | Advisor Group Holdings, Inc. | 36 837 | 17,36 | 1 360 | 19,82 | ||||
| 2025-07-11 | 13F | Farther Finance Advisors, LLC | 4 037 | 1,46 | 149 | 4,20 | ||||
| 2025-08-01 | 13F | Envestnet Asset Management Inc | 2 470 463 | −48,14 | 91 209 | −47,04 | ||||
| 2025-08-12 | 13F | Kensington Asset Management, LLC | 1 889 800 | 94,82 | 69 771 | 98,98 | ||||
| 2025-08-12 | 13F | Richard W. Paul & Associates, LLC | 31 | 0,00 | 1 | 0,00 | ||||
| 2025-08-14 | 13F | Citadel Advisors Llc | 18 744 | 692 | ||||||
| 2025-08-14 | 13F | Stifel Financial Corp | 11 144 | 6,76 | 411 | 9,02 | ||||
| 2025-08-14 | 13F | Mercer Global Advisors Inc /adv | 9 253 | −32,88 | 342 | −31,53 | ||||
| 2025-08-13 | 13F | Edgestream Partners, L.P. | 12 072 | 47,80 | 446 | 50,85 | ||||
| 2025-04-04 | 13F | Legacy Private Trust Co. | 0 | −100,00 | 0 | |||||
| 2025-07-25 | NP | UCMCX - Cornerstone Moderately Conservative Fund | 20 332 | 0,00 | 741 | −0,67 | ||||
| 2025-07-23 | 13F | Prime Capital Investment Advisors, LLC | 7 503 | −2,37 | 277 | 0,00 | ||||
| 2025-08-26 | NP | ISJAX - Voya Index Solution 2045 Portfolio Class ADV | 728 264 | 1,23 | 26 888 | 3,39 | ||||
| 2025-07-31 | 13F | Wealthfront Advisers Llc | 1 146 590 | 7,73 | 42 332 | 10,02 | ||||
| 2025-07-23 | 13F | Valmark Advisers, Inc. | 4 658 164 | 3,28 | 171 979 | 5,48 | ||||
| 2025-08-19 | 13F | Newbridge Financial Services Group, Inc. | 0 | −100,00 | 0 | |||||
| 2025-04-28 | 13F | Mutual Advisors, LLC | 0 | −100,00 | 0 | −100,00 | ||||
| 2025-05-15 | 13F | Colton Groome Financial Advisors, Llc | 0 | −100,00 | 0 | |||||
| 2025-08-06 | 13F | Aspect Partners, LLC | 242 | 9 | ||||||
| 2025-07-31 | 13F | Cambridge Investment Research Advisors, Inc. | 109 676 | −28,68 | 4 | −20,00 | ||||
| 2025-07-30 | 13F | Strategic Blueprint, LLC | 9 471 | −3,19 | 350 | −1,13 | ||||
| 2025-08-06 | 13F | Penserra Capital Management LLC | 380 896 | −0,80 | 14 | 7,69 | ||||
| 2025-08-08 | 13F | Cercano Management LLC | 706 147 | 0,00 | 26 071 | 2,13 | ||||
| 2025-08-08 | 13F | Cetera Investment Advisers | 39 488 | −88,83 | 1 458 | −88,60 | ||||
| 2025-07-16 | 13F | Perigon Wealth Management, LLC | 47 418 | −0,15 | 1 751 | 1,98 | ||||
| 2025-08-14 | 13F | Hrt Financial Lp | 78 475 | 67,16 | 3 | 100,00 | ||||
| 2025-08-26 | NP | Northern Lights Variable Trust - TOPS Conservative ETF Portfolio Class 1 shares | 45 253 | 1,91 | 1 671 | 4,05 | ||||
| 2025-07-18 | 13F | Martel Wealth Advisors Inc | 69 350 | −1,44 | 2 560 | 0,67 | ||||
| 2025-07-25 | NP | HYRM - Xtrackers Risk Managed USD High Yield Strategy ETF | 1 230 279 | 1,08 | 44 856 | 0,36 | ||||
| 2025-05-08 | 13F | Moors & Cabot, Inc. | 0 | −100,00 | 0 | |||||
| 2025-08-14 | 13F | Graney & King, LLC | 6 | 0,00 | 0 | |||||
| 2025-08-08 | 13F | Creative Planning | 6 195 | −24,90 | 229 | −23,49 | ||||
| 2025-08-13 | 13F | Johnson Financial Group, Inc. | 4 700 | −9,62 | 174 | −7,49 | ||||
| 2025-05-01 | 13F | Quest 10 Wealth Builders, Inc. | 5 | 0,00 | 0 | |||||
| 2025-07-18 | 13F | SigFig Wealth Management, LLC | 22 005 | 10,10 | 810 | 12,21 | ||||
| 2025-05-14 | 13F | Oarsman Capital, Inc. | 0 | −100,00 | 0 | −100,00 | ||||
| 2025-08-26 | NP | Northern Lights Variable Trust - TOPS Managed Risk Flex ETF Portfolio | 122 902 | −4,89 | 4 538 | −2,87 | ||||
| 2025-05-08 | 13F | We Are One Seven, LLC | 0 | −100,00 | 0 | |||||
| 2025-08-14 | 13F | Toroso Investments, LLC | 61 166 | 2 246 | ||||||
| 2025-07-29 | NP | JOJO - ATAC Credit Rotation ETF | 70 336 | 185,99 | 2 564 | 185,84 | ||||
| 2025-08-14 | 13F | Old Mission Capital Llc | 139 886 | 5 165 | ||||||
| 2025-07-08 | 13F | Webster Bank, N. A. | 983 | −56,16 | 36 | −55,56 | ||||
| 2025-08-14 | 13F | Millennium Management Llc | 0 | −100,00 | 0 | |||||
| 2025-08-14 | 13F | Hilltop Holdings Inc. | 29 724 | 2,12 | 1 097 | 4,28 | ||||
| 2025-08-15 | 13F | American Family Investments, Inc. | 284 808 | 0,00 | 10 515 | 2,14 | ||||
| 2025-08-26 | NP | TBFG - The Brinsmere Fund - Growth ETF | 207 849 | 0,77 | 7 674 | 2,91 | ||||
| 2025-07-09 | 13F | VisionPoint Advisory Group, LLC | 79 396 | 618,52 | 2 931 | 634,59 | ||||
| 2025-08-12 | 13F | CIBC Private Wealth Group, LLC | 189 | 0,00 | 7 | 0,00 | ||||
| 2025-04-25 | 13F | Hutchens & Kramer Investment Management Group, LLC | 0 | −100,00 | 0 | |||||
| 2025-07-24 | 13F | rebel Financial LLC | 112 614 | 4 158 | ||||||
| 2025-08-26 | NP | Northern Lights Variable Trust - TOPS Managed Risk Moderate Growth ETF Portfolio Class 1 shares | 121 704 | −4,40 | 4 493 | −2,37 | ||||
| 2025-08-13 | 13F | Victory Capital Management Inc | 476 301 | 0,00 | 17 585 | 2,13 | ||||
| 2025-04-25 | 13F | Smallwood Wealth Investment Management, LLC | 11 | 0 | ||||||
| 2025-07-17 | 13F | Nelson, Van Denburg & Campbell Wealth Management Group, LLC | 306 381 | 1,38 | 11 312 | 3,54 | ||||
| 2025-07-15 | 13F | Fortitude Family Office, LLC | 0 | −100,00 | 0 | |||||
| 2025-08-12 | 13F | O'shaughnessy Asset Management, Llc | 1 | −92,86 | 0 | |||||
| 2025-08-14 | 13F | Gotham Asset Management, LLC | 7 729 | 285 | ||||||
| 2025-08-12 | 13F | Global Retirement Partners, LLC | 2 001 | −12,54 | 74 | −10,98 | ||||
| 2025-08-06 | 13F | Wedbush Securities Inc | 5 994 | −6,26 | 0 | |||||
| 2025-05-15 | 13F | Manufacturers Life Insurance Company, The | 0 | −100,00 | 0 | |||||
| 2025-07-14 | 13F | Sowell Financial Services LLC | 10 817 | 0,45 | 399 | 2,57 | ||||
| 2025-07-10 | 13F | Global Financial Private Client, LLC | 15 651 | 3,92 | 578 | 6,07 |