Grundläggande statistik
| Institutionella ägare | 204 total, 204 long only, 0 short only, 0 long/short - change of 1,49% MRQ |
| Genomsnittlig portföljallokering | 0.7246 % - change of −2,98% MRQ |
| Institutionella aktier (lång) | 37 922 402 (ex 13D/G) - change of 3,15MM shares 9,06% MRQ |
| Institutionellt värde (lång) | $ 1 671 219 USD ($1000) |
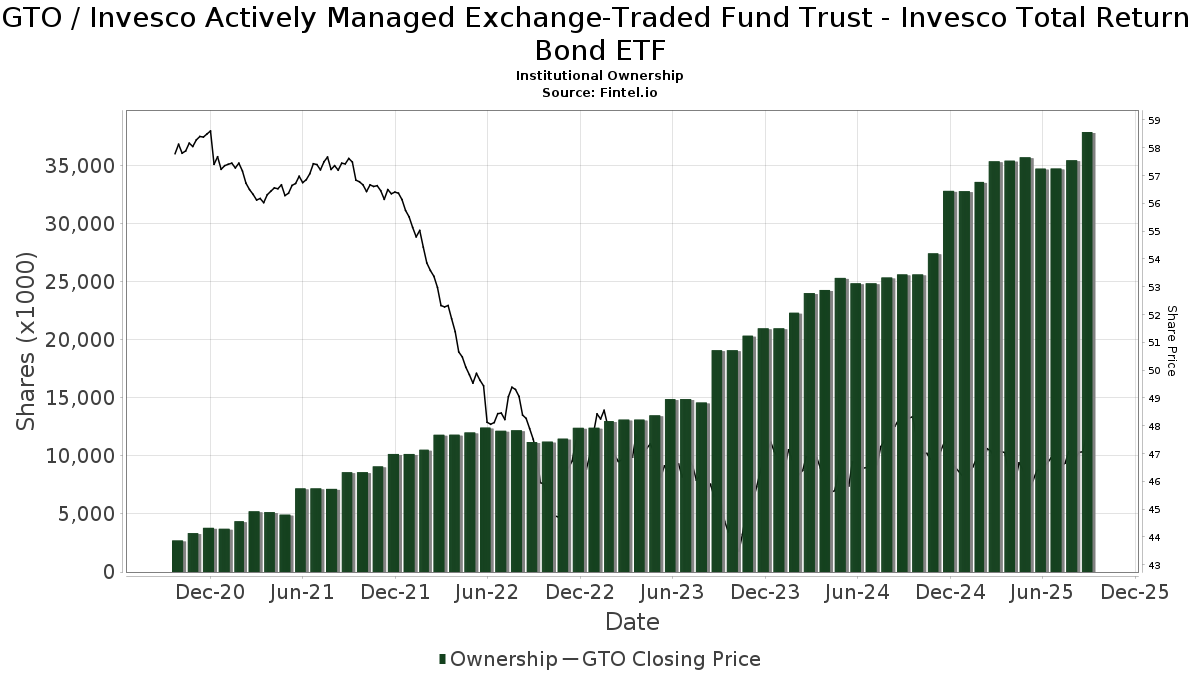
Institutionellt ägande och aktieägare
Invesco Actively Managed Exchange-Traded Fund Trust - Invesco Total Return Bond ETF (US:GTO) har 204 Institutionella ägare och aktieägare som har lämnat in 13D/G- eller 13F-formulär till Securities Exchange Commission (SEC). Dessa institut innehar totalt 37,922,402 aktier. Största aktieägare inkluderar LPL Financial LLC, Advisor Group Holdings, Inc., Envestnet Asset Management Inc, Invesco Ltd., Morgan Stanley, Cwm, Llc, Private Advisor Group, LLC, Bank of New York Mellon Corp, Bank Of America Corp /de/, and Brio Consultants, LLC .
Invesco Actively Managed Exchange-Traded Fund Trust - Invesco Total Return Bond ETF (ARCA:GTO) Institutionell ägarstruktur visar institutioners och fonders nuvarande positioner i företaget, samt de senaste förändringarna i positionernas storlek. Större aktieägare kan vara enskilda investerare, fonder, hedgefonder eller institutioner. Bilaga 13D visar att investeraren äger (eller ägde) mer än 5% av företaget och avser (eller avsåg) att aktivt eftersträva en förändring av affärsstrategin. Schedule 13G indikerar en passiv investering på över 5%.
The share price as of September 10, 2025 is 47,63 / share. Previously, on September 11, 2024, the share price was 48,58 / share. This represents a decline of 1,96% over that period.
Fondsentimentets poäng
Fondsentimentet poängen(fka Ägarackumulation-poäng) visar vilka aktier som är mest köpta av fonder. Det är resultatet av en sofistikerad kvantitativ flerfaktormodell som identifierar företag med de högsta nivåerna av institutionell ackumulering. Poängsättningsmodellen använder en kombination av den totala ökningen av redovisade ägare, förändringarna i portföljallokeringarna för dessa ägare och andra mått. Siffran sträcker sig från 0 till 100, där högre siffror indikerar en högre nivå av ackumulering i förhållande till sina konkurrenter, och 50 är genomsnittet.
Uppdateringsfrekvens: Dagligen
Se Ownership Explorer, som innehåller en lista över de högst rankade företagen.
Institutionell sälj/köp-kvot
Förutom att rapportera vanliga eget kapital- och skuldemissioner måste institutioner med mer än 100MM tillgångar under förvaltning också avslöja sina innehav av sälj- och köpoptioner. Eftersom säljoptioner i allmänhet indikerar ett negativt sentiment och köpoptioner indikerar ett positivt sentiment, kan vi få en uppfattning om det övergripande institutionella sentimentet genom att plotta förhållandet mellan säljoptioner och köpoptioner. Diagrammet till höger visar det historiska förhållandet mellan sälj- och köpoptioner för detta instrument.
Genom att använda sälj/köp-kvoten som en indikator på aktieägarnas sentiment undviker man en av de största bristerna med att använda det totala institutionella ägandet, nämligen att en betydande del av de förvaltade tillgångarna investeras passivt för att följa index. Passivt förvaltade fonder köper vanligtvis inte optioner, så indikatorn för sälj/köp-kvoten ger en bättre bild av stämningen i aktivt förvaltade fonder.
13F- och NPORT-arkiveringar
Detaljer om 13F-arkiveringar är gratis. Detaljer om NP-arkiveringar kräver ett premiummedlemskap. Gröna rader indikerar nya positioner. Röda rader indikerar stängda positioner. Klicka på länk symbolen för att se hela transaktionshistoriken.
Uppgradera
för att låsa upp premiumdata och exportera till Excel ![]() .
.
| Fil Datum | Källa | Investerare | Typ | Genomsnittligt pris (beräknat) |
Aktier | Δ Aktier (%) |
Rapporterat värde (1000 USD) |
Δ Värde (%) |
Portföljallokering (%) |
|
|---|---|---|---|---|---|---|---|---|---|---|
| 2025-08-14 | 13F | Avid Wealth Partners LLC | 80 192 | −27,02 | 3 760 | −27,08 | ||||
| 2025-08-13 | 13F | VestGen Advisors, LLC | 209 747 | 1,81 | 9 867 | 2,05 | ||||
| 2025-08-14 | 13F | IHT Wealth Management, LLC | 130 771 | 16,28 | 6 132 | 16,18 | ||||
| 2025-08-14 | 13F | Wiley Bros.-aintree Capital, Llc | 13 200 | −64,98 | 619 | −64,91 | ||||
| 2025-08-14 | 13F | Ausdal Financial Partners, Inc. | 4 554 | −45,81 | 214 | −45,94 | ||||
| 2025-08-14 | 13F | Arete Wealth Advisors, LLC | 31 052 | −7,73 | 1 | 0,00 | ||||
| 2025-08-14 | 13F | Treasure Coast Financial Planning | 34 095 | −1,98 | 1 599 | −2,08 | ||||
| 2025-08-11 | 13F | Principal Securities, Inc. | 13 635 | 12,98 | 639 | 14,11 | ||||
| 2025-07-02 | 13F | Howard Financial Services, Ltd. | 711 727 | −0,43 | 33 373 | −0,52 | ||||
| 2025-08-12 | 13F | Founders Financial Alliance, LLC | 14 711 | 0,00 | 690 | −0,14 | ||||
| 2025-08-14 | 13F | Prestige Wealth Management Group LLC | 559 | −65,26 | 26 | −65,33 | ||||
| 2025-08-14 | 13F | UBS Group AG | 17 | −88,19 | 1 | −100,00 | ||||
| 2025-07-10 | 13F | Stewardship Advisors, LLC | 245 800 | 0,27 | 11 526 | 0,18 | ||||
| 2025-07-10 | 13F | Exchange Traded Concepts, Llc | 18 585 | 871 | ||||||
| 2025-08-04 | 13F | Arkadios Wealth Advisors | 16 101 | 0,42 | 755 | 0,27 | ||||
| 2025-08-12 | 13F | Jpmorgan Chase & Co | 82 012 | −25,90 | 3 846 | −25,96 | ||||
| 2025-08-11 | 13F | Vista Cima Wealth Management LLC | 18 002 | 0,04 | 844 | 0,00 | ||||
| 2025-08-07 | 13F | CENTRAL TRUST Co | 0 | −100,00 | 0 | |||||
| 2025-07-09 | 13F | Dynamic Advisor Solutions LLC | 598 765 | 2,91 | 28 076 | 2,82 | ||||
| 2025-08-12 | 13F | Change Path, LLC | 7 549 | −16,26 | 354 | −16,55 | ||||
| 2025-07-11 | 13F | SILVER OAK SECURITIES, Inc | 20 527 | 0,00 | 963 | 0,21 | ||||
| 2025-05-12 | 13F | Sandy Spring Bank | 0 | −100,00 | 0 | |||||
| 2025-07-17 | 13F | Financial Designs Corp | 16 673 | −4,91 | 782 | −4,99 | ||||
| 2025-08-07 | 13F | Verus Capital Partners, Llc | 274 892 | 11,51 | 12 890 | 11,42 | ||||
| 2025-08-12 | 13F | BlackRock, Inc. | 0 | −100,00 | 0 | |||||
| 2025-08-11 | 13F | Strategic Wealth Partners, Ltd. | 42 | 2 | ||||||
| 2025-08-13 | 13F | Jones Financial Companies Lllp | 224 356 | 14,78 | 10 486 | 14,64 | ||||
| 2025-08-12 | 13F | Integrated Advisors Network LLC | 0 | −100,00 | 0 | |||||
| 2025-07-22 | 13F | Merit Financial Group, LLC | 26 014 | −40,36 | 1 220 | −40,45 | ||||
| 2025-07-25 | 13F | Total Clarity Wealth Management, Inc. | 110 188 | 49,38 | 5 167 | 50,96 | ||||
| 2025-08-13 | 13F | Baird Financial Group, Inc. | 643 497 | 7,40 | 30 174 | 7,30 | ||||
| 2025-04-02 | 13F | Marcum Wealth, LLC | 57 117 | 2,57 | 2 681 | 3,76 | ||||
| 2025-07-24 | 13F | IFP Advisors, Inc | 68 699 | 157,05 | 3 221 | 156,86 | ||||
| 2025-08-07 | 13F | Brio Consultants, LLC | 1 013 133 | 3,98 | 47 506 | 3,89 | ||||
| 2025-08-14 | 13F | Integrated Wealth Concepts LLC | 138 649 | −0,26 | 6 501 | −0,34 | ||||
| 2025-08-08 | 13F | Fortis Group Advisors, LLC | 5 906 | 275 | ||||||
| 2025-07-14 | 13F | Park Avenue Securities Llc | 41 025 | 14,57 | 2 | 0,00 | ||||
| 2025-08-15 | 13F | First Heartland Consultants, Inc. | 10 269 | −4,94 | 482 | −4,94 | ||||
| 2025-08-12 | 13F | Global Retirement Partners, LLC | 4 167 | 195 | ||||||
| 2025-08-14 | 13F | Money Concepts Capital Corp | 32 320 | −2,37 | 1 515 | −2,45 | ||||
| 2025-07-24 | 13F | Mainstay Capital Management Llc /adv | 15 340 | 103,99 | 719 | 104,26 | ||||
| 2025-08-11 | 13F | PAX Financial Group, LLC | 32 882 | 1,43 | 1 542 | 1,31 | ||||
| 2025-08-11 | 13F | Alteri Wealth LLC | 6 748 | 15,83 | 316 | 15,75 | ||||
| 2025-07-29 | 13F | Private Trust Co Na | 2 099 | 0,00 | 98 | 0,00 | ||||
| 2025-08-04 | 13F | Creative Financial Designs Inc /adv | 430 | 0,00 | 20 | 0,00 | ||||
| 2025-08-11 | 13F | Tidemark, LLC | 782 477 | 1,05 | 36 690 | 0,97 | ||||
| 2025-05-12 | 13F | Condor Capital Management | 0 | −100,00 | 0 | |||||
| 2025-08-06 | 13F | AE Wealth Management LLC | 452 | 201,33 | 21 | 200,00 | ||||
| 2025-08-15 | 13F | Captrust Financial Advisors | 85 430 | 150,88 | 4 006 | 150,63 | ||||
| 2025-08-19 | 13F | Advisory Services Network, LLC | 6 208 | 1,22 | 289 | 0,70 | ||||
| 2025-08-25 | 13F | BLVD Private Wealth, LLC | 16 985 | 796 | ||||||
| 2025-07-17 | 13F | KWB Wealth | 770 147 | −1,18 | 36 143 | −0,05 | ||||
| 2025-08-12 | 13F | SRS Capital Advisors, Inc. | 13 | 0,00 | 1 | |||||
| 2025-07-25 | 13F | Pathway Financial Advisors LLC | 13 209 | 0,00 | 619 | 0,00 | ||||
| 2025-07-22 | 13F | Simplicity Wealth,LLC | 78 672 | −52,77 | 3 689 | −52,81 | ||||
| 2025-07-29 | 13F | Empirical Asset Management, LLC | 7 408 | 20,85 | 347 | 20,91 | ||||
| 2025-05-07 | 13F | Foundations Investment Advisors, LLC | 0 | −100,00 | 0 | |||||
| 2025-04-23 | 13F | Mascagni Wealth Management, Inc. | 0 | −100,00 | 0 | −100,00 | ||||
| 2025-08-08 | 13F | Larson Financial Group LLC | 0 | −100,00 | 0 | |||||
| 2025-08-05 | 13F | Landmark Wealth Management, Inc. | 25 411 | −81,14 | 1 192 | −81,16 | ||||
| 2025-08-08 | 13F | Evolution Wealth Advisors, LLC | 14 695 | 0,20 | 689 | 0,15 | ||||
| 2025-08-07 | 13F | Vise Technologies, Inc. | 20 696 | 38,27 | 970 | 39,77 | ||||
| 2025-07-29 | NP | ACPSX - Invesco Core Plus Bond Fund Class A | 100 000 | 0,00 | 4 626 | −2,18 | ||||
| 2025-08-13 | 13F | Cerity Partners LLC | 58 790 | 2 737 | ||||||
| 2025-07-02 | 13F | HBW Advisory Services LLC | 0 | −100,00 | 0 | |||||
| 2025-07-14 | 13F | Mechanics Bank Trust Department | 69 541 | −8,30 | 3 261 | −8,38 | ||||
| 2025-08-12 | 13F | J.w. Cole Advisors, Inc. | 28 877 | 13,77 | 1 354 | 13,69 | ||||
| 2025-07-18 | 13F | Cooper Financial Group | 60 421 | −10,46 | 2 833 | −10,52 | ||||
| 2025-08-14 | 13F | Royal Bank Of Canada | 62 655 | −24,21 | 2 938 | −24,28 | ||||
| 2025-08-12 | 13F | Entropy Technologies, LP | 33 501 | 528 | ||||||
| 2025-07-28 | 13F | RFG Advisory, LLC | 24 636 | −17,91 | 1 155 | −17,97 | ||||
| 2025-08-14 | 13F | Integrity Wealth Advisors, Inc. | 23 039 | −24,57 | 1 080 | −24,63 | ||||
| 2025-07-16 | 13F | Perigon Wealth Management, LLC | 12 175 | 3,49 | 571 | 3,26 | ||||
| 2025-05-15 | 13F | Tower Research Capital LLC (TRC) | 0 | −100,00 | 0 | |||||
| 2025-07-21 | 13F | Ameriflex Group, Inc. | 645 | 46,26 | 30 | 50,00 | ||||
| 2025-08-14 | 13F | GWM Advisors LLC | 116 242 | −0,24 | 5 451 | −0,33 | ||||
| 2025-07-25 | 13F | Concurrent Investment Advisors, LLC | 53 933 | 29,13 | 2 529 | 28,98 | ||||
| 2025-08-13 | 13F | WCG Wealth Advisors LLC | 0 | −100,00 | 0 | |||||
| 2025-08-15 | 13F | Cooksen Wealth, LLC | 0 | −100,00 | 0 | |||||
| 2025-07-11 | 13F | Farther Finance Advisors, LLC | 5 760 | 13,45 | 270 | 13,45 | ||||
| 2025-07-10 | 13F | Kmg Fiduciary Partners, Llc | 310 921 | 3,24 | 14 579 | 3,15 | ||||
| 2025-08-15 | 13F | Koesten, Hirschmann & Crabtree, INC. | 5 | 400,00 | 0 | |||||
| 2025-08-08 | 13F | Avantax Advisory Services, Inc. | 96 902 | 6,46 | 4 544 | 6,37 | ||||
| 2025-07-14 | 13F | Rooted Wealth Advisors, Inc. | 264 347 | 6,34 | 12 316 | 4,97 | ||||
| 2025-08-06 | 13F | Axim Planning & Wealth | 8 709 | 408 | ||||||
| 2025-07-25 | 13F | Atria Wealth Solutions, Inc. | 0 | −100,00 | 0 | |||||
| 2025-04-22 | 13F | Castleview Partners, Llc | 0 | −100,00 | 0 | |||||
| 2025-08-06 | 13F | Destiny Capital Corp/CO | 56 566 | −1,19 | 2 652 | −1,27 | ||||
| 2025-08-05 | 13F | American Capital Advisory, LLC | 186 842 | 0,85 | 8 761 | 0,77 | ||||
| 2025-07-15 | 13F | Colonial River Wealth Management, LLC | 81 182 | 9,02 | 3 794 | 8,59 | ||||
| 2025-07-25 | 13F | Northwest Capital Management Inc | 913 | −34,69 | 43 | −35,38 | ||||
| 2025-08-07 | 13F | PFG Advisors | 170 237 | 5,61 | 7 982 | 5,53 | ||||
| 2025-08-14 | 13F | TCG Advisory Services, LLC | 36 452 | −13,91 | 1 709 | −13,99 | ||||
| 2025-07-31 | 13F | Opes Wealth Management LLC | 0 | −100,00 | 0 | |||||
| 2025-07-09 | 13F | Sandbox Financial Partners, LLC | 73 093 | 2,83 | 3 427 | 2,76 | ||||
| 2025-07-31 | 13F | Insight Wealth Partners, LLC | 102 875 | 1,56 | 4 824 | 1,47 | ||||
| 2025-08-27 | NP | LAWAX - LADENBURG AGGRESSIVE GROWTH FUND Class A Shares | 23 726 | 0,00 | 1 113 | −0,09 | ||||
| 2025-07-30 | 13F | Drive Wealth Management, Llc | 14 005 | 657 | ||||||
| 2025-08-04 | 13F | Pensionmark Financial Group, Llc | 218 389 | 10,60 | 10 240 | 10,51 | ||||
| 2025-07-11 | 13F | Pinnacle Bancorp, Inc. | 1 044 | −11,22 | 49 | −12,73 | ||||
| 2025-07-18 | 13F | Truist Financial Corp | 14 062 | −92,37 | 659 | −92,38 | ||||
| 2025-08-08 | 13F | Hartland & Co., LLC | 32 514 | 38,34 | 1 525 | 38,29 | ||||
| 2025-08-27 | NP | LGWAX - LADENBURG GROWTH FUND Class A Shares | 126 767 | −4,65 | 5 944 | −4,73 | ||||
| 2025-07-09 | 13F | Channel Wealth Llc | 142 771 | −1,40 | 6 695 | −1,49 | ||||
| 2025-08-06 | 13F | Commonwealth Equity Services, Llc | 57 354 | −8,03 | 3 | 0,00 | ||||
| 2025-07-10 | 13F | Focus Financial Network, Inc. | 299 941 | −19,85 | 14 064 | −19,92 | ||||
| 2025-08-14 | 13F | Citadel Advisors Llc | 44 317 | 605,35 | 2 078 | 606,80 | ||||
| 2025-08-13 | 13F | Lido Advisors, LLC | 42 117 | −8,49 | 1 975 | −8,57 | ||||
| 2025-08-11 | 13F | TD Waterhouse Canada Inc. | 543 | 0,00 | 25 | 0,00 | ||||
| 2025-08-14 | 13F | Hurley Capital, LLC | 0 | −100,00 | 0 | |||||
| 2025-08-12 | 13F | Steward Partners Investment Advisory, Llc | 168 | 0,00 | 8 | 0,00 | ||||
| 2025-08-08 | 13F | Petix & Botte Co | 351 101 | 17,24 | 16 463 | 17,14 | ||||
| 2025-08-14 | 13F | Wells Fargo & Company/mn | 353 964 | 3,28 | 16 597 | 3,19 | ||||
| 2025-08-14 | 13F | Jane Street Group, Llc | 28 506 | −75,83 | 1 337 | −75,87 | ||||
| 2025-08-06 | 13F | Wedbush Securities Inc | 5 491 | 7,35 | 0 | |||||
| 2025-04-21 | 13F | Trivant Custom Portfolio Group, LLC | 0 | −100,00 | 0 | |||||
| 2025-08-04 | 13F | Impact Partnership Wealth, LLC | 4 369 | −1,11 | 205 | −1,45 | ||||
| 2025-08-27 | 13F/A | Brinker Capital Investments, LLC | 32 034 | −3,59 | 1 502 | −3,66 | ||||
| 2025-08-11 | 13F | Private Advisor Group, LLC | 1 349 313 | 126,76 | 63 269 | 126,57 | ||||
| 2025-07-10 | 13F | Wealth Enhancement Advisory Services, Llc | 205 289 | −22,60 | 9 597 | −22,90 | ||||
| 2025-08-11 | 13F | Regal Investment Advisors LLC | 154 613 | 2,78 | 7 250 | 2,69 | ||||
| 2025-08-07 | 13F | Resources Investment Advisors, LLC. | 10 881 | 0,00 | 510 | 0,00 | ||||
| 2025-07-31 | 13F | Cambridge Investment Research Advisors, Inc. | 64 601 | 10,83 | 3 | 50,00 | ||||
| 2025-08-08 | 13F | Gts Securities Llc | 5 420 | 254 | ||||||
| 2025-08-06 | 13F | Atlas Legacy Advisors, LLC | 128 740 | 4,51 | 6 037 | 4,83 | ||||
| 2025-07-24 | 13F | MSH Capital Advisors LLC | 21 569 | 0,50 | 1 011 | 0,40 | ||||
| 2025-08-12 | 13F | Financial Advocates Investment Management | 12 986 | 15,43 | 609 | 15,37 | ||||
| 2025-08-04 | 13F | Spire Wealth Management | 491 422 | −12,48 | 22 901 | −13,09 | ||||
| 2025-08-18 | 13F | Geneos Wealth Management Inc. | 2 185 | −68,76 | 102 | −68,90 | ||||
| 2025-08-14 | 13F | CoreCap Advisors, LLC | 3 105 | 146 | ||||||
| 2025-07-29 | NP | ACCEX - Invesco Corporate Bond Fund Class C | 100 000 | 0,00 | 4 626 | −2,18 | ||||
| 2025-07-25 | 13F | Concord Wealth Partners | 1 203 | −6,96 | 56 | −6,67 | ||||
| 2025-08-14 | 13F | Mml Investors Services, Llc | 200 907 | 15,71 | 9 | 12,50 | ||||
| 2025-08-13 | 13F | Flow Traders U.s. Llc | 22 987 | 46,81 | 1 | |||||
| 2025-04-16 | 13F | Fortitude Family Office, LLC | 0 | −100,00 | 0 | |||||
| 2025-08-14 | 13F | Fmr Llc | 14 | 27,27 | 1 | |||||
| 2025-08-13 | 13F | Elios Financial Group Inc. | 23 213 | 15,94 | 1 088 | 15,87 | ||||
| 2025-08-19 | 13F | Newbridge Financial Services Group, Inc. | 501 | 0,00 | 23 | 0,00 | ||||
| 2025-04-30 | 13F | Sofos Investments, Inc. | 43 | −97,94 | 2 | −97,92 | ||||
| 2025-08-13 | 13F | Invesco Ltd. | 2 411 115 | 2,63 | 113 057 | 2,54 | ||||
| 2025-07-15 | 13F | Beacon Financial Planning, Inc | 198 553 | −6,18 | 9 310 | −6,25 | ||||
| 2025-08-14 | 13F | Aqr Capital Management Llc | 98 980 | 15,31 | 4 641 | 15,22 | ||||
| 2025-08-04 | 13F | Assetmark, Inc | 16 277 | 41,44 | 763 | 41,30 | ||||
| 2025-08-13 | 13F | GeoWealth Management, LLC | 28 676 | −11,75 | 1 345 | −11,81 | ||||
| 2025-08-13 | 13F | Renaissance Technologies Llc | 50 000 | 66,11 | 2 344 | 66,01 | ||||
| 2025-07-15 | 13F | Aspire Capital Advisors LLC | 10 843 | 144,32 | 508 | 144,23 | ||||
| 2025-08-27 | NP | LNOAX - LADENBURG INCOME & GROWTH FUND Class A Shares | 138 159 | 0,00 | 6 478 | −0,08 | ||||
| 2025-08-15 | 13F | Equitable Holdings, Inc. | 0 | −100,00 | 0 | |||||
| 2025-05-15 | 13F | EP Wealth Advisors, Inc. | 0 | −100,00 | 0 | −100,00 | ||||
| 2025-08-04 | 13F | Flagship Harbor Advisors, Llc | 37 049 | −9,14 | 1 737 | −9,20 | ||||
| 2025-07-15 | 13F | RTD Financial Advisors, Inc. | 843 410 | −1,02 | 39 548 | −1,11 | ||||
| 2025-07-30 | 13F | Retirement Planning Group | 33 023 | −4,58 | 1 548 | −4,68 | ||||
| 2025-07-14 | 13F | Sowell Financial Services LLC | 6 577 | 19,36 | 308 | 19,38 | ||||
| 2025-08-12 | 13F | Cook Wealth Management Group Llc | 0 | −100,00 | 0 | |||||
| 2025-08-05 | 13F | Scarborough Advisors, LLC | 63 313 | −0,34 | 2 969 | −0,44 | ||||
| 2025-07-24 | 13F | Williams & Novak, LLC | 4 513 | 212 | ||||||
| 2025-07-24 | 13F | Acima Private Wealth, Llc | 207 755 | −8,96 | 9 742 | −9,03 | ||||
| 2025-08-13 | 13F | JT Stratford LLC | 25 414 | 1,10 | 1 192 | 1,02 | ||||
| 2025-08-05 | 13F | Key FInancial Inc | 2 439 | −1,77 | 114 | −1,72 | ||||
| 2025-08-14 | 13F | NorthLanding Financial Partners, LLC | 5 167 | 1,02 | 242 | 0,83 | ||||
| 2025-07-24 | 13F | Gilliland Jeter Wealth Management LLC | 0 | −100,00 | 0 | |||||
| 2025-08-14 | 13F | Sequent Planning LLC | 24 284 | 8,99 | 1 139 | 8,90 | ||||
| 2025-07-09 | 13F | WealthCare Investment Partners, LLC | 5 524 | 1,14 | 258 | 3,20 | ||||
| 2025-08-12 | 13F | LPL Financial LLC | 4 043 609 | 26,49 | 189 605 | 26,38 | ||||
| 2025-08-05 | 13F | Bank of New York Mellon Corp | 1 135 448 | 2,44 | 53 241 | 2,36 | ||||
| 2025-08-13 | 13F | IAG Wealth Partners, LLC | 6 672 | −92,26 | 313 | −92,29 | ||||
| 2025-08-14 | 13F | Betterment LLC | 7 240 | −38,09 | 0 | |||||
| 2025-08-27 | NP | LNCAX - LADENBURG INCOME FUND Class A Shares | 28 559 | 0,00 | 1 339 | −0,07 | ||||
| 2025-08-12 | 13F | Richmond Investment Services, LLC | 236 542 | 752,19 | 11 091 | 751,84 | ||||
| 2025-07-17 | 13F | Wagner Wealth Management, Llc | 29 | 0,00 | 1 | 0,00 | ||||
| 2025-07-30 | 13F | Brookstone Capital Management | 518 467 | 3,70 | 24 311 | 3,61 | ||||
| 2025-08-14 | 13F | Raymond James Financial Inc | 481 003 | 16,10 | 22 554 | 16,00 | ||||
| 2025-08-04 | 13F | Barnes Dennig Private Wealth Management LLC | 3 034 | 142 | ||||||
| 2025-08-12 | 13F | Journey Strategic Wealth Llc | 317 586 | 4,93 | 14 892 | 4,84 | ||||
| 2025-07-28 | 13F | Kiker Wealth Management, LLC | 65 | −95,12 | 3 | −95,16 | ||||
| 2025-08-08 | 13F | Financial Gravity Companies, Inc. | 43 | 0,00 | 2 | 100,00 | ||||
| 2025-08-04 | 13F | Northwest Financial Advisors | 52 342 | −23,47 | 2 454 | −23,53 | ||||
| 2025-08-14 | 13F | Financial Engines Advisors L.L.C. | 7 016 | 0,42 | 329 | 0,30 | ||||
| 2025-08-13 | 13F | Daner Wealth Management, LLC | 108 661 | 54,42 | 5 107 | 55,84 | ||||
| 2025-08-14 | 13F | Mercer Global Advisors Inc /adv | 41 428 | −9,48 | 1 943 | −9,55 | ||||
| 2025-08-14 | 13F | Snowden Capital Advisors LLC | 200 969 | 1,53 | 9 423 | 1,44 | ||||
| 2025-08-07 | 13F | Allworth Financial LP | 2 545 | 0,00 | 119 | 1,71 | ||||
| 2025-05-15 | 13F/A | Orion Portfolio Solutions, LLC | 33 228 | 27,04 | 1 559 | 28,52 | ||||
| 2025-08-06 | 13F | Vestmark Advisory Solutions, Inc. | 103 340 | 4 846 | ||||||
| 2025-08-13 | 13F | Level Four Advisory Services, Llc | 4 476 | −14,51 | 210 | −14,69 | ||||
| 2025-07-30 | 13F | LGT Financial Advisors LLC | 823 | −27,62 | 39 | −28,30 | ||||
| 2025-08-14 | 13F | Mariner, LLC | 5 043 | 236 | ||||||
| 2025-08-13 | 13F | Transce3nd, LLC | 121 | 0,00 | 6 | 0,00 | ||||
| 2025-07-08 | 13F | Parallel Advisors, LLC | 18 | −98,47 | 1 | −100,00 | ||||
| 2025-07-21 | 13F | Ashton Thomas Securities, Llc | 102 590 | 55,54 | 4 810 | 55,41 | ||||
| 2025-08-12 | 13F | Gladstone Institutional Advisory LLC | 66 173 | 21,70 | 3 103 | 21,60 | ||||
| 2025-07-18 | 13F | Consolidated Portfolio Review Corp | 7 649 | 15,51 | 359 | 15,48 | ||||
| 2025-04-14 | 13F | LexAurum Advisors, LLC | 0 | −100,00 | 0 | −100,00 | ||||
| 2025-08-12 | 13F | Proequities, Inc. | 0 | 0 | ||||||
| 2025-07-25 | 13F | Envestnet Portfolio Solutions, Inc. | 205 582 | −0,26 | 9 640 | −0,35 | ||||
| 2025-07-28 | 13F | Harbour Investments, Inc. | 1 352 | 49,72 | 63 | 50,00 | ||||
| 2025-08-04 | 13F | IFG Advisory, LLC | 262 776 | −30,87 | 12 322 | −30,93 | ||||
| 2025-08-15 | 13F | Asset Allocation Strategies LLC | 127 926 | 24,88 | 5 998 | 24,78 | ||||
| 2025-07-09 | 13F | Fjell Capital, LLC | 101 702 | −1,51 | 4 769 | −1,61 | ||||
| 2025-08-14 | 13F | Comerica Bank | 16 449 | −0,69 | 771 | −0,77 | ||||
| 2025-07-25 | 13F | Cwm, Llc | 1 699 341 | 0,20 | 80 | 0,00 | ||||
| 2025-07-29 | 13F | Stratos Wealth Partners, LTD. | 9 236 | −11,75 | 433 | −11,81 | ||||
| 2025-08-15 | 13F | Morgan Stanley | 1 894 960 | −2,65 | 88 855 | −2,73 | ||||
| 2025-08-01 | 13F | Envestnet Asset Management Inc | 2 829 210 | −3,42 | 132 662 | −3,50 | ||||
| 2025-08-27 | 13F | Barnes Wealth Management Group, Inc | 10 867 | 0,80 | 510 | 0,79 | ||||
| 2025-07-22 | 13F | USAdvisors Wealth Management, LLC | 99 891 | 14,76 | 5 | 0,00 | ||||
| 2025-08-13 | 13F | Capital Analysts, Inc. | 224 | 0,45 | 0 | |||||
| 2025-07-28 | 13F | Frazier Financial Advisors, LLC | 37 | 2,78 | 2 | 0,00 | ||||
| 2025-08-08 | 13F | Good Life Advisors, LLC | 260 620 | 15,97 | 12 220 | 15,87 | ||||
| 2025-07-16 | 13F | BOS Asset Management, LLC | 124 986 | 0,54 | 5 861 | 0,45 | ||||
| 2025-07-28 | 13F | Axxcess Wealth Management, Llc | 79 007 | 324,40 | 3 705 | 324,28 | ||||
| 2025-08-14 | 13F | Stifel Financial Corp | 5 130 | −41,32 | 241 | −41,46 | ||||
| 2025-04-16 | 13F/A | Western Wealth Management, LLC | 0 | −100,00 | 0 | |||||
| 2025-09-04 | 13F/A | Advisor Group Holdings, Inc. | 2 988 723 | 1,44 | 140 143 | 1,35 | ||||
| 2025-08-14 | 13F | Bank Of America Corp /de/ | 1 070 063 | 45,71 | 50 175 | 45,59 | ||||
| 2025-04-15 | 13F | Fifth Third Bancorp | 0 | −100,00 | 0 | |||||
| 2025-08-18 | 13F | Goodman Advisory Group, LLC | 0 | −100,00 | 0 | |||||
| 2025-07-17 | 13F | Janney Montgomery Scott LLC | 21 206 | 38,50 | 1 | |||||
| 2025-08-13 | 13F | Kuhn & Co Investment Counsel | 15 663 | 0,00 | 734 | −0,14 | ||||
| 2025-08-15 | 13F | Kestra Advisory Services, LLC | 50 495 | −0,53 | 2 368 | −0,63 | ||||
| 2025-07-31 | 13F | Schneider Downs Wealth Management Advisors, LP | 9 385 | −50,90 | 440 | −50,89 | ||||
| 2025-07-30 | 13F | Cullen/frost Bankers, Inc. | 5 952 | 4,42 | 279 | 4,49 | ||||
| 2025-08-14 | 13F | Hilltop Holdings Inc. | 11 636 | 1,19 | 546 | 1,11 | ||||
| 2025-08-27 | NP | LOWAX - LADENBURG GROWTH & INCOME FUND Class A Shares | 250 202 | 0,00 | 11 732 | −0,09 | ||||
| 2025-07-23 | 13F | High Note Wealth, LLC | 0 | 0 | ||||||
| 2025-07-21 | 13F | Ameritas Advisory Services, LLC | 423 | 20 | ||||||
| 2025-07-30 | 13F | Bogart Wealth, LLC | 6 348 | −10,55 | 298 | −10,81 | ||||
| 2025-08-11 | 13F | HighTower Advisors, LLC | 23 016 | 9,08 | 1 079 | 8,99 | ||||
| 2025-08-13 | 13F | Solutions 4 Wealth, Ltd | 6 560 | 308 | ||||||
| 2025-08-13 | 13F | Northwestern Mutual Wealth Management Co | 125 | −88,68 | 6 | −90,20 | ||||
| 2025-08-14 | 13F | Susquehanna International Group, Llp | 163 910 | 220,63 | 7 686 | 220,34 | ||||
| 2025-08-08 | 13F | Cetera Investment Advisers | 414 325 | 4,21 | 19 428 | 4,12 | ||||
| 2025-05-12 | 13F | Independent Advisor Alliance | 0 | −100,00 | 0 |
Other Listings
| PE:GTO |