Grundläggande statistik
| Institutionella ägare | 126 total, 125 long only, 0 short only, 1 long/short - change of −4,51% MRQ |
| Genomsnittlig portföljallokering | 0.1824 % - change of 15,33% MRQ |
| Institutionella aktier (lång) | 27 601 565 (ex 13D/G) - change of −1,52MM shares −5,23% MRQ |
| Institutionellt värde (lång) | $ 594 753 USD ($1000) |
Institutionellt ägande och aktieägare
iShares S&P GSCI Commodity-Indexed Trust (US:GSG) har 126 Institutionella ägare och aktieägare som har lämnat in 13D/G- eller 13F-formulär till Securities Exchange Commission (SEC). Dessa institut innehar totalt 27,601,565 aktier. Största aktieägare inkluderar BlackRock, Inc., USA Financial Portformulas Corp, Morgan Stanley, Strategic Investment Management, Llc, Quent Capital, LLC, Bank Of America Corp /de/, Wells Fargo & Company/mn, Quadrature Capital Ltd, Deutsche Bank Ag\, and Goldman Sachs Group Inc .
iShares S&P GSCI Commodity-Indexed Trust (ARCA:GSG) Institutionell ägarstruktur visar institutioners och fonders nuvarande positioner i företaget, samt de senaste förändringarna i positionernas storlek. Större aktieägare kan vara enskilda investerare, fonder, hedgefonder eller institutioner. Bilaga 13D visar att investeraren äger (eller ägde) mer än 5% av företaget och avser (eller avsåg) att aktivt eftersträva en förändring av affärsstrategin. Schedule 13G indikerar en passiv investering på över 5%.
The share price as of September 11, 2025 is 22,67 / share. Previously, on September 12, 2024, the share price was 20,43 / share. This represents an increase of 10,96% over that period.

Fondsentimentets poäng
Fondsentimentet poängen(fka Ägarackumulation-poäng) visar vilka aktier som är mest köpta av fonder. Det är resultatet av en sofistikerad kvantitativ flerfaktormodell som identifierar företag med de högsta nivåerna av institutionell ackumulering. Poängsättningsmodellen använder en kombination av den totala ökningen av redovisade ägare, förändringarna i portföljallokeringarna för dessa ägare och andra mått. Siffran sträcker sig från 0 till 100, där högre siffror indikerar en högre nivå av ackumulering i förhållande till sina konkurrenter, och 50 är genomsnittet.
Uppdateringsfrekvens: Dagligen
Se Ownership Explorer, som innehåller en lista över de högst rankade företagen.
Institutionell sälj/köp-kvot
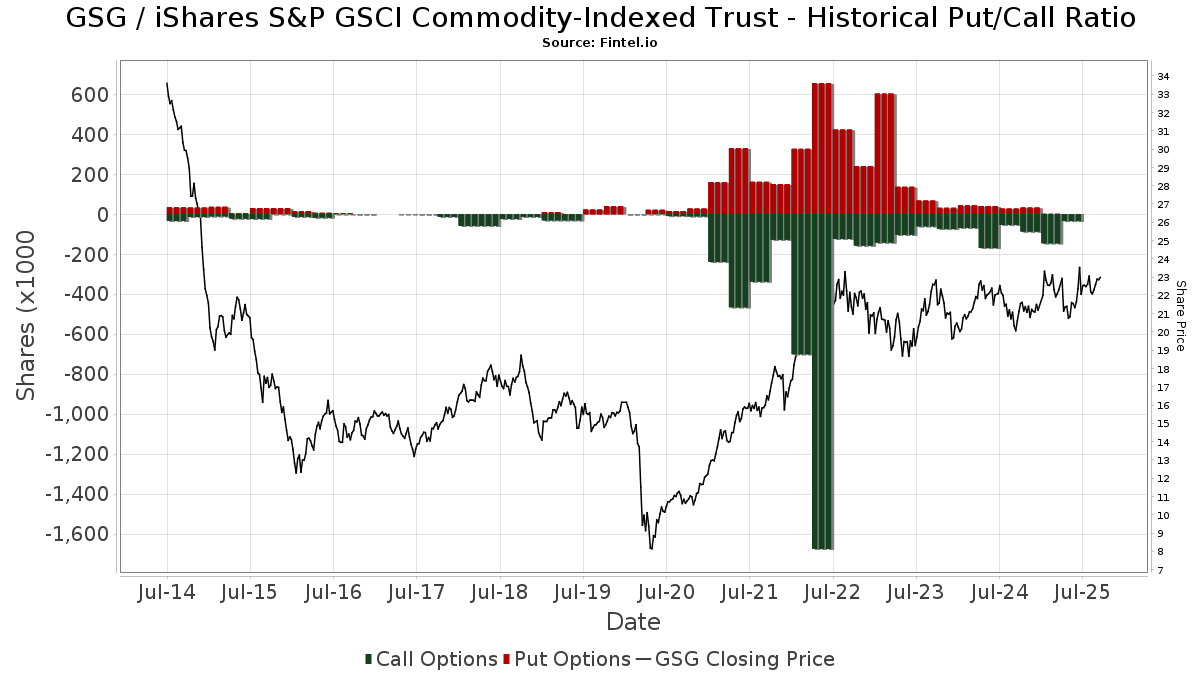
Förutom att rapportera vanliga eget kapital- och skuldemissioner måste institutioner med mer än 100MM tillgångar under förvaltning också avslöja sina innehav av sälj- och köpoptioner. Eftersom säljoptioner i allmänhet indikerar ett negativt sentiment och köpoptioner indikerar ett positivt sentiment, kan vi få en uppfattning om det övergripande institutionella sentimentet genom att plotta förhållandet mellan säljoptioner och köpoptioner. Diagrammet till höger visar det historiska förhållandet mellan sälj- och köpoptioner för detta instrument.
Genom att använda sälj/köp-kvoten som en indikator på aktieägarnas sentiment undviker man en av de största bristerna med att använda det totala institutionella ägandet, nämligen att en betydande del av de förvaltade tillgångarna investeras passivt för att följa index. Passivt förvaltade fonder köper vanligtvis inte optioner, så indikatorn för sälj/köp-kvoten ger en bättre bild av stämningen i aktivt förvaltade fonder.
13F- och NPORT-arkiveringar
Detaljer om 13F-arkiveringar är gratis. Detaljer om NP-arkiveringar kräver ett premiummedlemskap. Gröna rader indikerar nya positioner. Röda rader indikerar stängda positioner. Klicka på länk symbolen för att se hela transaktionshistoriken.
Uppgradera
för att låsa upp premiumdata och exportera till Excel ![]() .
.
| Fil Datum | Källa | Investerare | Typ | Genomsnittligt pris (beräknat) |
Aktier | Δ Aktier (%) |
Rapporterat värde (1000 USD) |
Δ Värde (%) |
Portföljallokering (%) |
|
|---|---|---|---|---|---|---|---|---|---|---|
| 2025-08-14 | 13F | Citadel Advisors Llc | Call | 19 400 | 2,11 | 428 | −1,16 | |||
| 2025-08-14 | 13F | Raymond James Financial Inc | 40 484 | −8,70 | 892 | −11,60 | ||||
| 2025-05-09 | 13F | Atria Wealth Solutions, Inc. | 0 | −100,00 | 0 | |||||
| 2025-05-15 | 13F | Rakuten Investment Management, Inc. | 107 840 | 8,24 | 2 415 | 15,06 | ||||
| 2025-07-15 | 13F | Cordant, Inc. | 3 058 | 0,00 | 67 | −2,90 | ||||
| 2025-08-08 | 13F | Capstone Financial Advisors, Inc. | 9 600 | 0,00 | 212 | −3,21 | ||||
| 2025-07-08 | 13F | Nbc Securities, Inc. | 2 172 | 0,56 | 0 | |||||
| 2025-08-13 | 13F | EverSource Wealth Advisors, LLC | 22 | 0,00 | 0 | |||||
| 2025-08-13 | 13F | Amundi | 0 | −100,00 | 0 | |||||
| 2025-08-12 | 13F | Southeast Asset Advisors Inc. | 18 514 | 31,65 | 408 | 27,50 | ||||
| 2025-08-19 | 13F | Advisory Services Network, LLC | 47 817 | −0,10 | 1 090 | 0,09 | ||||
| 2025-08-08 | 13F | Chandler Asset Management, Inc. | 23 595 | 0,00 | 520 | −3,17 | ||||
| 2025-08-13 | 13F | Avestar Capital, LLC | 25 250 | 0,00 | 557 | −3,14 | ||||
| 2025-07-18 | 13F | USA Financial Portformulas Corp | 1 009 519 | 22 250 | ||||||
| 2025-07-08 | 13F | Arlington Trust Co LLC | 6 250 | 0,00 | 138 | −3,52 | ||||
| 2025-07-31 | 13F | Optimum Investment Advisors | 50 | 0,00 | 1 | 0,00 | ||||
| 2025-08-13 | 13F | Scotia Capital Inc. | 17 076 | −74,37 | 376 | −75,21 | ||||
| 2025-08-04 | 13F | Assetmark, Inc | 0 | −100,00 | 0 | |||||
| 2025-08-12 | 13F | Steward Partners Investment Advisory, Llc | 664 | 0,00 | 15 | −6,67 | ||||
| 2025-08-01 | 13F | First National Trust Co | 15 476 | 3,17 | 341 | 0,00 | ||||
| 2025-08-14 | 13F | Citadel Advisors Llc | 45 188 | 996 | ||||||
| 2025-05-05 | 13F | St. Louis Trust Co | 0 | −100,00 | 0 | |||||
| 2025-07-30 | 13F | Strategic Investment Management, Llc | 873 720 | 0,00 | 19 257 | −3,21 | ||||
| 2025-08-14 | 13F | Bnp Paribas Arbitrage, Sa | 34 330 | 30 551,79 | 757 | 37 700,00 | ||||
| 2025-08-13 | 13F | Continuum Advisory, LLC | 0 | −100,00 | 0 | |||||
| 2025-05-16 | 13F | Coppell Advisory Solutions LLC | 0 | −100,00 | 0 | |||||
| 2025-08-06 | 13F | Aspect Partners, LLC | 23 795 | 524 | ||||||
| 2025-08-04 | 13F | Creative Financial Designs Inc /adv | 700 | 0,00 | 15 | 0,00 | ||||
| 2025-08-13 | 13F | Flow Traders U.s. Llc | 0 | −100,00 | 0 | |||||
| 2025-04-10 | 13F | Sugar Maple Asset Management, LLC | 0 | −100,00 | 0 | |||||
| 2025-08-13 | 13F | Northwestern Mutual Wealth Management Co | 37 271 | −0,60 | 821 | −3,75 | ||||
| 2025-08-05 | 13F | Simplex Trading, Llc | Put | 100 | 0 | |||||
| 2025-05-14 | 13F | Group One Trading, L.p. | Put | 0 | −100,00 | 0 | −100,00 | |||
| 2025-08-05 | 13F | Simplex Trading, Llc | Call | 1 000 | 25,00 | 0 | ||||
| 2025-08-08 | 13F | Avantax Advisory Services, Inc. | 22 695 | 8,37 | 500 | 5,04 | ||||
| 2025-08-12 | 13F | Coldstream Capital Management Inc | 0 | −100,00 | 0 | |||||
| 2025-04-22 | 13F | Heartland Bank & Trust Co | 0 | −100,00 | 0 | |||||
| 2025-08-04 | 13F | Pinnacle Associates Ltd | 55 301 | 0,00 | 1 219 | −3,26 | ||||
| 2025-04-18 | 13F | Global Trust Asset Management, LLC | 0 | −100,00 | 0 | |||||
| 2025-08-13 | 13F/A | StoneX Group Inc. | 28 715 | 0,40 | 610 | 3,57 | ||||
| 2025-04-21 | 13F | Beacon Capital Management, LLC | 0 | −100,00 | 0 | |||||
| 2025-08-13 | 13F | Congress Wealth Management LLC / DE / | 17 930 | 0,00 | 395 | −3,19 | ||||
| 2025-07-17 | 13F | Fifth Third Securities, Inc. | 10 783 | 19,56 | 238 | 15,61 | ||||
| 2025-08-14 | 13F | Citadel Advisors Llc | Put | 0 | −100,00 | 0 | ||||
| 2025-08-15 | 13F | Equitable Holdings, Inc. | 12 932 | 285 | ||||||
| 2025-07-28 | 13F | Private Wealth Asset Management, LLC | 5 000 | 0,00 | 110 | −2,65 | ||||
| 2025-08-12 | 13F | Proequities, Inc. | Put | 0 | 0 | |||||
| 2025-05-12 | 13F | Citigroup Inc | 0 | −100,00 | 0 | |||||
| 2025-08-12 | 13F | Proequities, Inc. | Call | 0 | 0 | |||||
| 2025-05-14 | 13F | Oarsman Capital, Inc. | 0 | −100,00 | 0 | −100,00 | ||||
| 2025-08-11 | 13F | GW&K Investment Management, LLC | 14 000 | 0,00 | 0 | |||||
| 2025-08-05 | 13F | Bank of New York Mellon Corp | 141 256 | −27,47 | 3 113 | −29,79 | ||||
| 2025-05-12 | 13F | Sandy Spring Bank | 17 | 0,00 | 0 | |||||
| 2025-07-08 | 13F | Rise Advisors, LLC | 300 | 0,00 | 7 | 0,00 | ||||
| 2025-07-08 | 13F | Parallel Advisors, LLC | 9 630 | 0,00 | 212 | −3,20 | ||||
| 2025-07-23 | 13F | West Paces Advisors Inc. | 0 | −100,00 | 0 | |||||
| 2025-08-13 | 13F | Transce3nd, LLC | 42 | 366,67 | 1 | |||||
| 2025-08-13 | 13F | Bank Of Nova Scotia | 14 240 | 0,00 | 314 | −3,40 | ||||
| 2025-08-14 | 13F | State Street Corp | 66 900 | −48,38 | 1 474 | −50,03 | ||||
| 2025-08-06 | 13F | Golden State Wealth Management, LLC | 3 409 | −20,33 | 75 | −22,68 | ||||
| 2025-08-12 | 13F | Boreal Capital Management LLC | 670 | 15 | ||||||
| 2025-08-07 | 13F | Pinnacle Wealth Management Advisory Group, LLC | 55 000 | 0,00 | 1 212 | −3,19 | ||||
| 2025-08-14 | 13F | Susquehanna International Group, Llp | Call | 12 600 | 278 | |||||
| 2025-08-14 | 13F | Susquehanna International Group, Llp | 44 549 | −51,92 | 982 | −53,49 | ||||
| 2025-08-05 | 13F | Simplex Trading, Llc | 0 | −100,00 | 0 | |||||
| 2025-08-11 | 13F | TD Waterhouse Canada Inc. | 550 | 0,00 | 12 | 0,00 | ||||
| 2025-07-21 | 13F | Quent Capital, LLC | 676 447 | 22,06 | 14 909 | 18,15 | ||||
| 2025-07-31 | 13F | Cambridge Investment Research Advisors, Inc. | 12 422 | −18,89 | 0 | |||||
| 2025-08-13 | 13F | MONECO Advisors, LLC | 95 648 | 0,22 | 2 108 | −2,99 | ||||
| 2025-05-01 | 13F | Cwm, Llc | 0 | −100,00 | 0 | |||||
| 2025-05-15 | 13F | Human Investing LLC | 0 | −100,00 | 0 | |||||
| 2025-08-06 | 13F | Prospera Financial Services Inc | 64 531 | −0,74 | 1 422 | −3,92 | ||||
| 2025-08-14 | 13F | Royal Bank Of Canada | 51 892 | −5,56 | 1 144 | −8,48 | ||||
| 2025-08-01 | 13F | Envestnet Asset Management Inc | 75 091 | −23,69 | 1 655 | −26,12 | ||||
| 2025-07-16 | 13F | Castleview Partners, Llc | 0 | −100,00 | 0 | |||||
| 2025-08-13 | 13F | Quadrature Capital Ltd | 360 943 | 422,05 | 7 961 | 405,72 | ||||
| 2025-08-12 | 13F | Inscription Capital, LLC | 199 182 | −17,78 | 4 390 | −17,87 | ||||
| 2025-08-14 | 13F | Mariner, LLC | 33 064 | −29,12 | 729 | −31,45 | ||||
| 2025-07-16 | 13F | Highline Wealth Partners Llc | 1 700 | 0,00 | 37 | −2,63 | ||||
| 2025-08-11 | 13F | Strategic Wealth Partners, Ltd. | 800 | 18 | ||||||
| 2025-07-29 | 13F | Empirical Asset Management, LLC | 114 908 | 4,10 | 2 533 | 0,76 | ||||
| 2025-08-14 | 13F | GWM Advisors LLC | 619 | 0,00 | 14 | −7,14 | ||||
| 2025-08-12 | 13F | OneAscent Financial Services LLC | 44 778 | −26,93 | 1 | −100,00 | ||||
| 2025-08-06 | 13F | Moors & Cabot, Inc. | 36 972 | −3,23 | 815 | −6,33 | ||||
| 2025-08-11 | 13F | Sierra Capital LLC | 18 098 | −16,40 | 0 | |||||
| 2025-08-13 | 13F | Generation Capital Management LLC | 0 | −100,00 | 0 | |||||
| 2025-08-05 | 13F | Sumitomo Life Insurance Co | 0 | −100,00 | 0 | |||||
| 2025-08-15 | 13F | Morgan Stanley | 917 140 | −0,70 | 20 214 | −3,88 | ||||
| 2025-07-21 | 13F | Barrett & Company, Inc. | 150 | 0,00 | 3 | 0,00 | ||||
| 2025-05-14 | 13F | Mml Investors Services, Llc | 0 | −100,00 | 0 | |||||
| 2025-07-09 | 13F | Intelligence Driven Advisers, LLC | 0 | −100,00 | 0 | |||||
| 2025-07-22 | 13F | DT Investment Partners, LLC | 172 885 | 4,98 | 3 810 | 1,63 | ||||
| 2025-05-05 | 13F | CBIZ Investment Advisory Services, LLC | 0 | −100,00 | 0 | |||||
| 2025-08-14 | 13F | Goldman Sachs Group Inc | 208 970 | −22,77 | 4 606 | −25,26 | ||||
| 2025-07-21 | 13F | Washington Growth Strategies Llc | 135 919 | 590 852,17 | 3 | −33,33 | ||||
| 2025-08-14 | 13F | Gould Capital, LLC | 1 771 | −1,94 | 39 | −4,88 | ||||
| 2025-08-14 | 13F | Bank Of America Corp /de/ | 456 125 | −14,41 | 10 053 | −17,16 | ||||
| 2025-08-08 | 13F | Red Cedar Investment Management, Llc | 184 379 | 0,00 | 4 064 | −3,22 | ||||
| 2025-07-24 | 13F | Us Bancorp \de\ | 42 817 | −38,81 | 944 | −40,80 | ||||
| 2025-08-07 | 13F | Davis R M Inc | 9 150 | 0,00 | 202 | −3,37 | ||||
| 2025-08-13 | 13F | Mackenzie Financial Corp | 12 221 | −1,24 | 269 | −4,27 | ||||
| 2025-07-09 | 13F | Krilogy Financial LLC | 10 210 | −25,58 | 225 | −27,88 | ||||
| 2025-05-09 | 13F | Strategic Investment Solutions, Inc. /IL | 0 | −100,00 | 0 | |||||
| 2025-07-18 | 13F | PFG Investments, LLC | 53 112 | 0,93 | 1 171 | −2,34 | ||||
| 2025-07-31 | 13F | Oppenheimer & Co Inc | 25 400 | 0,00 | 560 | −3,29 | ||||
| 2025-08-05 | 13F | Aurdan Capital Management, LLC | 10 550 | 0,00 | 233 | −3,33 | ||||
| 2025-07-14 | 13F | Westend Capital Management LLC | 30 | 0,00 | 1 | |||||
| 2025-07-14 | 13F | Wealth Advisory Solutions, LLC | 29 970 | 1,23 | 661 | −2,08 | ||||
| 2025-08-04 | 13F | Creekmur Asset Management LLC | 180 | 80,00 | 4 | 50,00 | ||||
| 2025-08-14 | 13F | Wells Fargo & Company/mn | 362 009 | −34,43 | 7 979 | −36,54 | ||||
| 2025-08-08 | 13F | Financial Gravity Companies, Inc. | 82 | 0,00 | 2 | 0,00 | ||||
| 2025-08-12 | 13F | Proequities, Inc. | 0 | 0 | ||||||
| 2025-07-10 | 13F | Sovran Advisors, LLC | 136 380 | −3,27 | 3 075 | 1,05 | ||||
| 2025-07-24 | 13F | Strengthening Families & Communities, LLC | 1 174 | 26 | ||||||
| 2025-04-22 | 13F | Synergy Financial Management, LLC | 0 | −100,00 | 0 | |||||
| 2025-08-08 | 13F | Cetera Investment Advisers | 10 483 | −11,29 | 231 | −14,13 | ||||
| 2025-07-16 | 13F | Perigon Wealth Management, LLC | 16 586 | 0,00 | 366 | −3,18 | ||||
| 2025-08-14 | 13F | Sunbelt Securities, Inc. | 2 331 | 0,00 | 51 | −5,66 | ||||
| 2025-08-14 | 13F | Headlands Technologies LLC | 1 571 | 35 | ||||||
| 2025-09-04 | 13F/A | Advisor Group Holdings, Inc. | 56 763 | 56,57 | 1 252 | 51,64 | ||||
| 2025-08-11 | 13F | HighTower Advisors, LLC | 38 901 | −21,64 | 857 | −24,16 | ||||
| 2025-08-12 | 13F | LPL Financial LLC | 85 965 | −2,65 | 1 895 | −5,77 | ||||
| 2025-08-12 | 13F | BlackRock, Inc. | 18 508 255 | 6,56 | 407 922 | 3,15 | ||||
| 2025-08-05 | 13F | Huntington National Bank | 38 | −15,91 | ||||||
| 2025-08-14 | 13F | Stifel Financial Corp | 60 801 | 99,91 | 1 340 | 93,64 | ||||
| 2025-08-04 | 13F | Atria Investments Llc | 0 | −100,00 | 0 | |||||
| 2025-08-13 | 13F | Natixis Advisors, L.p. | 198 992 | −6,75 | 4 | 0,00 | ||||
| 2025-08-13 | 13F | F/M Investments LLC | 26 166 | 0,00 | 577 | −3,19 | ||||
| 2025-07-16 | 13F | Signaturefd, Llc | 0 | −100,00 | 0 | |||||
| 2025-07-18 | 13F | SOA Wealth Advisors, LLC. | 40 | 0,00 | 1 | |||||
| 2025-07-15 | 13F | Evanson Asset Management, LLC | 47 347 | 0,00 | 1 044 | −3,25 | ||||
| 2025-08-12 | 13F | Jpmorgan Chase & Co | 28 381 | −95,45 | 626 | −95,60 | ||||
| 2025-07-16 | 13F | BOS Asset Management, LLC | 11 330 | 0,00 | 250 | −3,11 | ||||
| 2025-08-12 | 13F | Deutsche Bank Ag\ | 311 479 | −60,97 | 6 865 | −62,23 | ||||
| 2025-08-14 | 13F | Stonehaven Wealth & Tax Solutions, Llc | 19 402 | −0,97 | 428 | −4,26 | ||||
| 2025-07-25 | 13F | Envestnet Portfolio Solutions, Inc. | 16 303 | 34,45 | 359 | 30,07 | ||||
| 2025-05-01 | 13F | Schechter Investment Advisors, LLC | 144 259 | −0,35 | 3 285 | 4,22 | ||||
| 2025-08-07 | 13F | Allworth Financial LP | 1 753 | 0,00 | 39 | 2,70 | ||||
| 2025-08-14 | 13F | UBS Group AG | 57 238 | −14,57 | 1 262 | −17,31 | ||||
| 2025-08-05 | 13F | Bank Of Montreal /can/ | 0 | −100,00 | 0 | |||||
| 2025-07-31 | 13F | Mycio Wealth Partners, Llc | 0 | −100,00 | 0 | |||||
| 2025-08-12 | 13F | CIBC Private Wealth Group, LLC | 1 500 | 0,00 | 33 | 10,00 | ||||
| 2025-08-14 | 13F | Fmr Llc | 0 | −100,00 | 0 | |||||
| 2025-08-14 | 13F | CoreCap Advisors, LLC | 394 | 0,00 | 9 | 0,00 | ||||
| 2025-07-09 | 13F | Breakwater Investment Management | 8 493 | −57,29 | 187 | −58,63 | ||||
| 2025-08-14 | 13F | SIH Partners, LLLP | Call | 0 | −100,00 | 0 | ||||
| 2025-05-15 | 13F | Wolverine Trading, Llc | Put | 0 | −100,00 | 0 | ||||
| 2025-08-25 | 13F/A | Neuberger Berman Group LLC | 41 262 | −14,86 | 909 | −17,59 | ||||
| 2025-08-14 | 13F | Jane Street Group, Llc | 35 491 | −86,31 | 782 | −86,75 | ||||
| 2025-08-05 | 13F | Key FInancial Inc | 158 | 0,00 | 3 | 0,00 | ||||
| 2025-08-12 | 13F | AlphaCore Capital LLC | 11 348 | 0,00 | 250 | −3,10 | ||||
| 2025-07-17 | 13F | Sound Income Strategies, LLC | 1 852 | 41 | ||||||
| 2025-08-19 | 13F | Asset Dedication, LLC | 1 125 | 0,00 | 25 | −4,00 | ||||
| 2025-05-15 | 13F | Wolverine Trading, Llc | Call | 0 | −100,00 | 0 | ||||
| 2025-08-14 | 13F | Comerica Bank | 6 383 | 0,00 | 141 | −3,45 | ||||
| 2025-08-01 | 13F | Red Lighthouse Investment Management, Llc | 650 | 0,00 | 14 | 0,00 | ||||
| 2025-08-11 | 13F | Brown Brothers Harriman & Co | 0 | −100,00 | 0 | |||||
| 2025-08-13 | 13F | M Holdings Securities, Inc. | 132 290 | 47,40 | 3 | 0,00 | ||||
| 2025-07-25 | 13F | Stephens Consulting, LLC | 580 | 0,00 | 13 | −7,69 | ||||
| 2025-08-07 | 13F | Kestra Private Wealth Services, Llc | 12 090 | 266 | ||||||
| 2025-07-16 | 13F | Patton Fund Management, Inc. | 69 454 | −1,81 | 1 531 | −4,97 | ||||
| 2025-08-15 | 13F | CI Private Wealth, LLC | 14 634 | 7,44 | 323 | 3,87 | ||||
| 2025-08-14 | 13F | Ameriprise Financial Inc | 98 599 | −42,78 | 2 173 | −44,62 | ||||
| 2025-08-18 | 13F/A | National Bank Of Canada /fi/ | 47 948 | −35,22 | 1 057 | −37,25 | ||||
| 2025-07-28 | 13F | Harbour Investments, Inc. | 369 | 0,00 | 8 | 0,00 | ||||
| 2025-08-06 | 13F | Commonwealth Equity Services, Llc | 65 954 | 70,26 | 1 | |||||
| 2025-04-30 | 13F | Sofos Investments, Inc. | 82 | 2 | ||||||
| 2025-08-15 | 13F | Tower Research Capital LLC (TRC) | 364 | 8 | ||||||
| 2025-08-08 | 13F | Pnc Financial Services Group, Inc. | 2 170 | 0,00 | 48 | −4,08 | ||||
| 2025-05-15 | 13F | First Commonwealth Financial Corp /pa/ | 0 | −100,00 | 0 | |||||
| 2025-08-14 | 13F | Group One Trading, L.p. | Call | 1 100 | 0,00 | 24 | −4,00 |