Grundläggande statistik
| Institutionella ägare | 147 total, 145 long only, 0 short only, 2 long/short - change of 34,55% MRQ |
| Genomsnittlig portföljallokering | 0.4256 % - change of 15,88% MRQ |
| Institutionella aktier (lång) | 21 069 906 (ex 13D/G) - change of 8,09MM shares 62,35% MRQ |
| Institutionellt värde (lång) | $ 376 176 USD ($1000) |
Institutionellt ägande och aktieägare
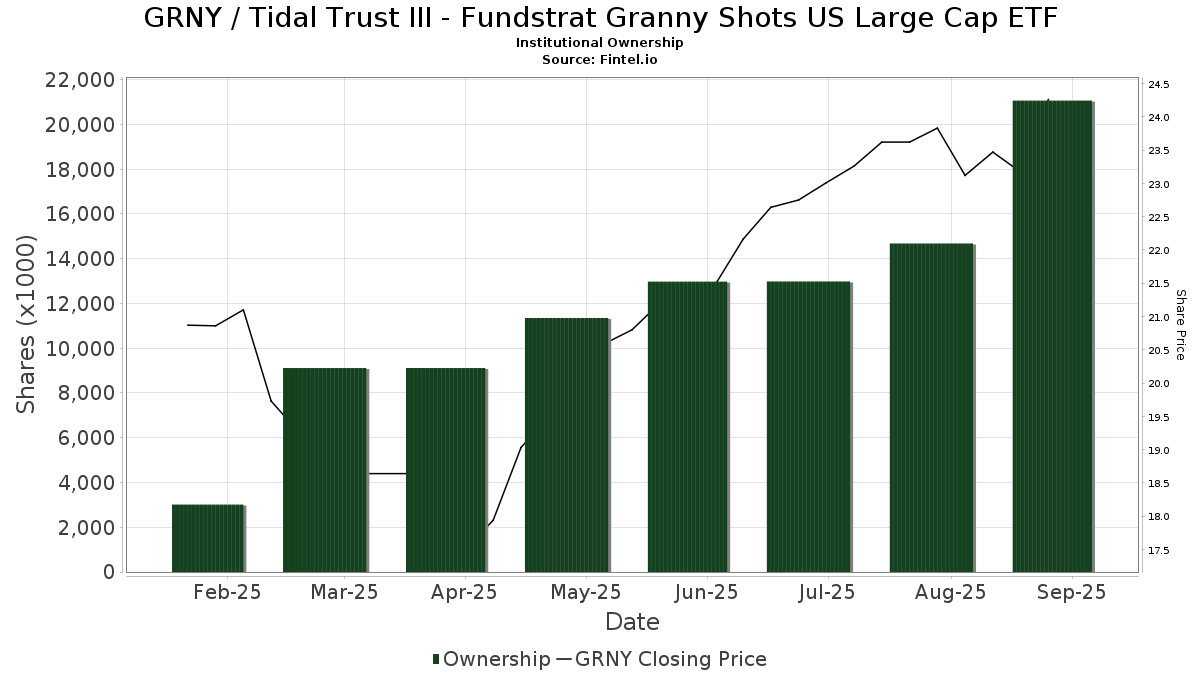
Tidal Trust III - Fundstrat Granny Shots US Large Cap ETF (US:GRNY) har 147 Institutionella ägare och aktieägare som har lämnat in 13D/G- eller 13F-formulär till Securities Exchange Commission (SEC). Dessa institut innehar totalt 21,069,906 aktier. Största aktieägare inkluderar Thrivent Financial For Lutherans, Royal Bank Of Canada, HighTower Advisors, LLC, TrueWealth Advisors, LLC, Reliant Wealth Planning, Venture Visionary Partners LLC, Smith, Moore & Co., Meitav Dash Investments Ltd, Mml Investors Services, Llc, and Ttp Investments, Inc. .
Tidal Trust III - Fundstrat Granny Shots US Large Cap ETF (ARCA:GRNY) Institutionell ägarstruktur visar institutioners och fonders nuvarande positioner i företaget, samt de senaste förändringarna i positionernas storlek. Större aktieägare kan vara enskilda investerare, fonder, hedgefonder eller institutioner. Bilaga 13D visar att investeraren äger (eller ägde) mer än 5% av företaget och avser (eller avsåg) att aktivt eftersträva en förändring av affärsstrategin. Schedule 13G indikerar en passiv investering på över 5%.
The share price as of September 12, 2025 is 24,41 / share. Previously, on November 7, 2024, the share price was 20,18 / share. This represents an increase of 20,96% over that period.
Fondsentimentets poäng
Fondsentimentet poängen(fka Ägarackumulation-poäng) visar vilka aktier som är mest köpta av fonder. Det är resultatet av en sofistikerad kvantitativ flerfaktormodell som identifierar företag med de högsta nivåerna av institutionell ackumulering. Poängsättningsmodellen använder en kombination av den totala ökningen av redovisade ägare, förändringarna i portföljallokeringarna för dessa ägare och andra mått. Siffran sträcker sig från 0 till 100, där högre siffror indikerar en högre nivå av ackumulering i förhållande till sina konkurrenter, och 50 är genomsnittet.
Uppdateringsfrekvens: Dagligen
Se Ownership Explorer, som innehåller en lista över de högst rankade företagen.
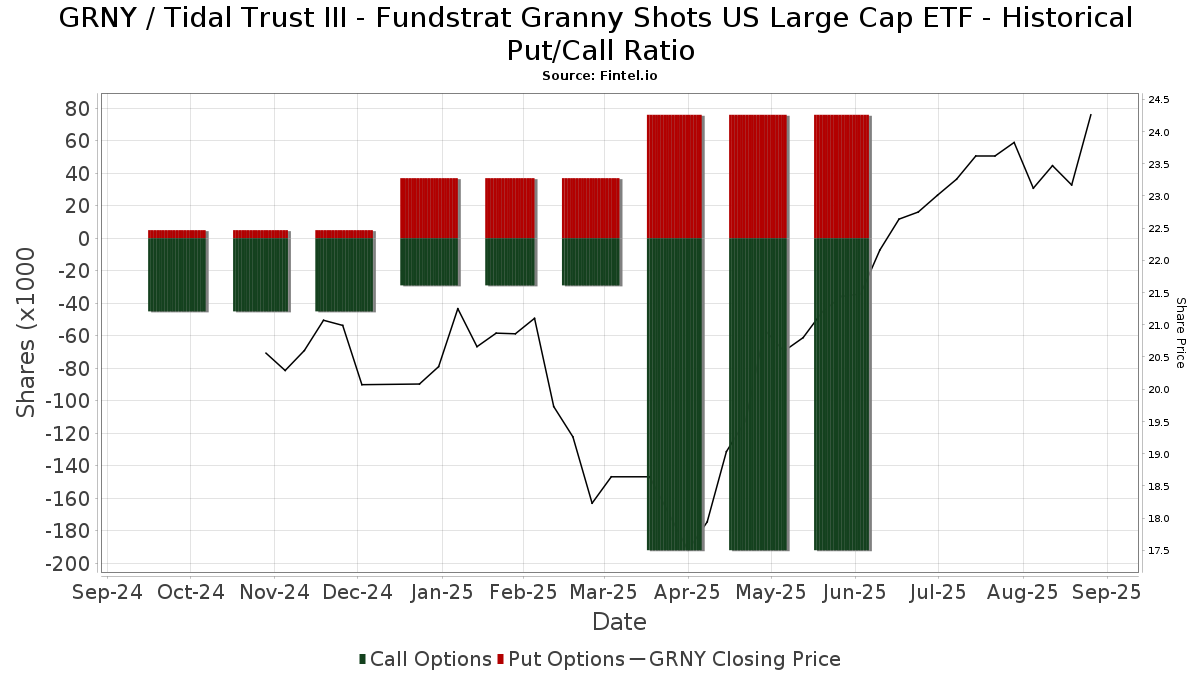
Institutionell sälj/köp-kvot
Förutom att rapportera vanliga eget kapital- och skuldemissioner måste institutioner med mer än 100MM tillgångar under förvaltning också avslöja sina innehav av sälj- och köpoptioner. Eftersom säljoptioner i allmänhet indikerar ett negativt sentiment och köpoptioner indikerar ett positivt sentiment, kan vi få en uppfattning om det övergripande institutionella sentimentet genom att plotta förhållandet mellan säljoptioner och köpoptioner. Diagrammet till höger visar det historiska förhållandet mellan sälj- och köpoptioner för detta instrument.
Genom att använda sälj/köp-kvoten som en indikator på aktieägarnas sentiment undviker man en av de största bristerna med att använda det totala institutionella ägandet, nämligen att en betydande del av de förvaltade tillgångarna investeras passivt för att följa index. Passivt förvaltade fonder köper vanligtvis inte optioner, så indikatorn för sälj/köp-kvoten ger en bättre bild av stämningen i aktivt förvaltade fonder.
13F- och NPORT-arkiveringar
Detaljer om 13F-arkiveringar är gratis. Detaljer om NP-arkiveringar kräver ett premiummedlemskap. Gröna rader indikerar nya positioner. Röda rader indikerar stängda positioner. Klicka på länk symbolen för att se hela transaktionshistoriken.
Uppgradera
för att låsa upp premiumdata och exportera till Excel ![]() .
.
| Fil Datum | Källa | Investerare | Typ | Genomsnittligt pris (beräknat) |
Aktier | Δ Aktier (%) |
Rapporterat värde (1000 USD) |
Δ Värde (%) |
Portföljallokering (%) |
|
|---|---|---|---|---|---|---|---|---|---|---|
| 2025-07-30 | 13F | Lionsbridge Wealth Management LLC | 185 753 | 4 213 | ||||||
| 2025-08-14 | 13F | Geneva Partners, LLC | 12 802 | 290 | ||||||
| 2025-07-07 | 13F | Thurston, Springer, Miller, Herd & Titak, Inc. | 1 000 | 23 | ||||||
| 2025-09-11 | 13F | Silicon Valley Capital Partners | 100 | 2 | ||||||
| 2025-07-03 | 13F | TrueWealth Advisors, LLC | 1 062 010 | 10,56 | 24 086 | 37,97 | ||||
| 2025-07-08 | 13F/A | Salem Investment Counselors Inc | 5 | 0 | ||||||
| 2025-07-23 | 13F | Kingswood Wealth Advisors, Llc | 28 130 | 638 | ||||||
| 2025-08-11 | 13F | HighTower Advisors, LLC | 1 164 996 | 4,06 | 26 422 | 29,85 | ||||
| 2025-07-08 | 13F | Parallel Advisors, LLC | 31 300 | 213,00 | 710 | 291,71 | ||||
| 2025-08-14 | 13F | Visionary Wealth Advisors | 67 454 | 125,33 | 1 530 | 181,07 | ||||
| 2025-08-14 | 13F | Susquehanna International Group, Llp | Put | 45 900 | 149,46 | 1 041 | 211,68 | |||
| 2025-07-10 | 13F | Family Legacy Financial Solutions, LLC | 10 | 0 | ||||||
| 2025-08-14 | 13F | Susquehanna International Group, Llp | 22 300 | −70,93 | 506 | −63,77 | ||||
| 2025-08-08 | 13F | Citizens Financial Group Inc/ri | 32 614 | 740 | ||||||
| 2025-08-14 | 13F | Susquehanna International Group, Llp | Call | 77 100 | 350,88 | 1 749 | 463,87 | |||
| 2025-08-12 | 13F | Proequities, Inc. | 0 | 0 | ||||||
| 2025-08-14 | 13F | IPG Investment Advisors LLC | 16 800 | 13,51 | 381 | 42,16 | ||||
| 2025-04-11 | 13F | Vanguard Capital Wealth Advisors This fund is a listed as child fund of Vanguard Group Inc and if that institution has disclosed ownership in this security, then these positions will not be double counted when calculating total shares and total value | 0 | −100,00 | 0 | |||||
| 2025-08-14 | 13F | Federation des caisses Desjardins du Quebec | 34 735 | 32,63 | 788 | 65,34 | ||||
| 2025-08-14 | 13F | TCG Advisory Services, LLC | 12 781 | 4,33 | 290 | 30,18 | ||||
| 2025-08-13 | 13F | Continuum Advisory, LLC | 0 | −100,00 | 0 | |||||
| 2025-07-30 | 13F | D.a. Davidson & Co. | 95 065 | 57,43 | 2 156 | 96,54 | ||||
| 2025-05-13 | 13F | Coston, McIsaac & Partners | 0 | −100,00 | 0 | |||||
| 2025-08-13 | 13F | VestGen Advisors, LLC | 187 912 | 31,30 | 4 262 | 63,82 | ||||
| 2025-07-21 | 13F | West Financial Advisors, LLC | 880 | 20 | ||||||
| 2025-07-31 | 13F | Oppenheimer & Co Inc | 37 511 | 851 | ||||||
| 2025-08-14 | 13F | CIBC World Markets Inc. | 317 866 | 0,88 | 7 209 | 25,88 | ||||
| 2025-08-14 | 13F | Royal Bank Of Canada | 2 197 306 | 60,77 | 49 835 | 100,62 | ||||
| 2025-08-14 | 13F | Vivaldi Capital Management, LLC | 86 569 | −37,82 | 1 963 | −22,41 | ||||
| 2025-07-25 | 13F | CV Advisors LLC | 18 278 | 415 | ||||||
| 2025-07-31 | 13F | Cambridge Investment Research Advisors, Inc. | 536 279 | 94,58 | 12 | 140,00 | ||||
| 2025-08-04 | 13F | Pensionmark Financial Group, Llc | 24 683 | 103,52 | 560 | 154,09 | ||||
| 2025-07-31 | 13F | Kranot Hishtalmut Le Morim Tichoniim Havera Menahelet LTD | 171 852 | 0,00 | 3 900 | 24,93 | ||||
| 2025-08-14 | 13F | Group One Trading, L.p. | 100 562 | 282,69 | 2 281 | 377,99 | ||||
| 2025-07-18 | 13F | SOA Wealth Advisors, LLC. | 72 447 | 32,23 | 1 643 | 65,13 | ||||
| 2025-07-21 | 13F | DHJJ Financial Advisors, Ltd. | 101 | 0,00 | 2 | 100,00 | ||||
| 2025-08-04 | 13F | NBZ Investment Advisors LLC | 405 805 | 16,15 | 9 204 | 44,93 | ||||
| 2025-08-06 | 13F | Disciplined Investors, L.L.C. | 46 827 | 67,24 | 1 062 | 109,06 | ||||
| 2025-08-13 | 13F | BlackDiamond Wealth Management Inc. | 52 120 | 1 166 | ||||||
| 2025-07-18 | 13F | Truist Financial Corp | 12 500 | 0,00 | 284 | 24,67 | ||||
| 2025-08-13 | 13F | EverSource Wealth Advisors, LLC | 0 | −100,00 | 0 | |||||
| 2025-08-14 | 13F | UBS Group AG | 9 300 | 520,00 | 211 | 677,78 | ||||
| 2025-07-07 | 13F | Teamwork Financial Advisors, LLC | 333 448 | 2,35 | 7 563 | 27,71 | ||||
| 2025-08-06 | 13F | Prospera Financial Services Inc | 12 826 | 291 | ||||||
| 2025-08-08 | 13F | Horrell Capital Management, Inc. | 9 416 | 47,12 | 214 | 83,62 | ||||
| 2025-05-15 | 13F | Gts Securities Llc | 0 | −100,00 | 0 | |||||
| 2025-07-24 | 13F | Vivid Wealth Management, LLC | 180 035 | 2,72 | 4 083 | 28,19 | ||||
| 2025-07-28 | 13F | Mutual Advisors, LLC | 18 278 | 1,34 | 431 | 27,14 | ||||
| 2025-08-01 | 13F | Belvedere Trading LLC | 0 | −100,00 | 0 | |||||
| 2025-08-05 | 13F | Redwood Wealth Management Group, LLC | 219 537 | 1,63 | 4 979 | 26,85 | ||||
| 2025-07-24 | 13F | Game Plan Financial Advisors, LLC | 37 943 | 11,41 | 861 | 38,93 | ||||
| 2025-08-18 | 13F | Arq Wealth Advisors, Llc | 49 813 | 0,00 | 905 | 0,00 | ||||
| 2025-07-11 | 13F | Farther Finance Advisors, LLC | 251 | 3,72 | 6 | 25,00 | ||||
| 2025-08-07 | 13F | Prudent Man Investment Management, Inc. | 100 | 0,00 | 2 | 0,00 | ||||
| 2025-08-14 | 13F | Citadel Advisors Llc | Call | 115 300 | 868,91 | 2 615 | 1 110,65 | |||
| 2025-05-14 | 13F | ZEGA Investments, LLC | 0 | −100,00 | 0 | |||||
| 2025-08-14 | 13F | Citadel Advisors Llc | Put | 30 100 | 54,36 | 683 | 92,66 | |||
| 2025-07-18 | 13F | Institute for Wealth Management, LLC. | 62 950 | 42,28 | 1 428 | 77,49 | ||||
| 2025-08-07 | 13F | Allworth Financial LP | 3 250 | 74 | ||||||
| 2025-08-14 | 13F | Garden State Investment Advisory Services LLC | 34 953 | −2,05 | 793 | 22,22 | ||||
| 2025-07-15 | 13F | Bnc Wealth Management, Llc | 15 528 | 14,36 | 352 | 43,09 | ||||
| 2025-08-12 | 13F | BlackRock, Inc. | 2 771 | 98,78 | 63 | 148,00 | ||||
| 2025-08-13 | 13F | Smith, Moore & Co. | 730 283 | 33,80 | 16 563 | 66,97 | ||||
| 2025-08-05 | 13F | Mirae Asset Securities (usa) Inc. | 9 591 | 218 | ||||||
| 2025-08-05 | 13F | Mountain Hill Investment Partners Corp. | 1 050 | 24 | ||||||
| 2025-07-17 | 13F | Janney Montgomery Scott LLC | 542 414 | 4,38 | 12 | 33,33 | ||||
| 2025-06-26 | NP | FIRS - FIRE Funds(TM) Wealth Builder ETF | 8 556 | 442,55 | 163 | 406,25 | ||||
| 2025-08-07 | 13F | Nwam Llc | 16 959 | 401 | ||||||
| 2025-07-21 | 13F | Ntv Asset Management Llc | 52 390 | 9,40 | 1 188 | 36,55 | ||||
| 2025-08-11 | 13F | NewEdge Wealth, LLC | 19 548 | 463 | ||||||
| 2025-08-18 | 13F | Brick & Kyle, Associates | 67 295 | 134,31 | 2 | |||||
| 2025-07-10 | 13F | Wealth Enhancement Advisory Services, Llc | 64 905 | 45,53 | 1 484 | 83,21 | ||||
| 2025-08-11 | 13F | TRUE Private Wealth Advisors | 17 865 | 8,42 | 405 | 35,45 | ||||
| 2025-08-19 | 13F | Advisory Services Network, LLC | 234 070 | −0,26 | 5 496 | 28,84 | ||||
| 2025-08-12 | 13F | Global Retirement Partners, LLC | 3 600 | 82 | ||||||
| 2025-05-14 | 13F | bLong Financial, LLC | 0 | −100,00 | 0 | |||||
| 2025-08-12 | 13F | SRS Capital Advisors, Inc. | 2 863 | −7,62 | 65 | 14,29 | ||||
| 2025-08-14 | 13F | Mml Investors Services, Llc | 597 389 | 14 | ||||||
| 2025-05-09 | 13F | TD Waterhouse Canada Inc. | 0 | −100,00 | 0 | |||||
| 2025-07-02 | 13F | Capital Market Strategies LLC | 15 390 | −6,10 | 349 | 17,51 | ||||
| 2025-07-29 | 13F | BXM Wealth LLC | 65 970 | −21,85 | 1 487 | −3,38 | ||||
| 2025-07-14 | 13F | AdvisorNet Financial, Inc | 512 | 0,00 | 12 | 22,22 | ||||
| 2025-05-06 | 13F | Venturi Wealth Management, LLC | 0 | −100,00 | 0 | |||||
| 2025-08-13 | 13F | Cresset Asset Management, LLC | 17 368 | 52,40 | 394 | 89,86 | ||||
| 2025-07-10 | 13F | Western Pacific Wealth Management, LP | 1 000 | 0,00 | 23 | 22,22 | ||||
| 2025-08-14 | 13F | Stifel Financial Corp | 225 242 | 402,59 | 5 108 | 527,52 | ||||
| 2025-07-14 | 13F | U.S. Capital Wealth Advisors, LLC | 38 018 | 862 | ||||||
| 2025-08-18 | 13F | Tactive Advisors, LLC | 22 200 | 503 | ||||||
| 2025-08-08 | 13F | Pnc Financial Services Group, Inc. | 500 | 11 | ||||||
| 2025-07-11 | 13F | Ttp Investments, Inc. | 545 875 | 12 380 | ||||||
| 2025-08-08 | 13F | Tortoise Investment Management, LLC | 100 | 0,00 | 2 | 100,00 | ||||
| 2025-08-12 | 13F | Jpmorgan Chase & Co | 0 | −100,00 | 0 | |||||
| 2025-08-14 | 13F | Citadel Advisors Llc | 0 | −100,00 | 0 | |||||
| 2025-05-06 | 13F | Tempus Wealth Planning, LLC | 0 | −100,00 | 0 | |||||
| 2025-08-11 | 13F | Private Advisor Group, LLC | 23 163 | 525 | ||||||
| 2025-08-15 | 13F | Kestra Advisory Services, LLC | 32 340 | 73,96 | 733 | 117,51 | ||||
| 2025-08-07 | 13F | Kestra Private Wealth Services, Llc | 320 876 | 54,33 | 7 277 | 92,62 | ||||
| 2025-07-23 | 13F | Steel Peak Wealth Management LLC | 48 000 | 1 089 | ||||||
| 2025-08-04 | 13F | Creative Financial Designs Inc /adv | 2 822 | 0,00 | 64 | 25,49 | ||||
| 2025-07-22 | 13F | IMC-Chicago, LLC | 26 600 | 603 | ||||||
| 2025-08-12 | 13F | Reliant Wealth Planning | 1 018 585 | 10,50 | 23 102 | 37,89 | ||||
| 2025-08-13 | 13F | StoneX Group Inc. | 34 005 | 771 | ||||||
| 2025-05-14 | 13F | Capital Analysts, Inc. | 0 | −100,00 | 0 | |||||
| 2025-07-08 | 13F | Nbc Securities, Inc. | 0 | −100,00 | 0 | |||||
| 2025-08-14 | 13F | Osterweis Capital Management Inc | 2 | 100,00 | ||||||
| 2025-07-21 | 13F | Kennebec Savings Bank | 0 | −100,00 | 0 | |||||
| 2025-07-25 | 13F | Acorn Creek Capital Llc | 9 580 | 217 | ||||||
| 2025-08-14 | 13F | Colony Group, LLC | 69 080 | 379,72 | 1 567 | 500,00 | ||||
| 2025-07-14 | 13F | Masso Torrence Wealth Management Inc. | 31 867 | 81,69 | 723 | 127,04 | ||||
| 2025-07-09 | 13F | Act Wealth Management, Llc | 10 526 | 0,00 | 239 | 24,61 | ||||
| 2025-07-21 | 13F | Barrett & Company, Inc. | 5 100 | 0,00 | 116 | 25,00 | ||||
| 2025-07-28 | 13F | Private Wealth Asset Management, LLC | 163 685 | 89,45 | 3 712 | 136,43 | ||||
| 2025-05-05 | 13F | Hazlett, Burt & Watson, Inc. | 0 | −100,00 | 0 | |||||
| 2025-08-05 | 13F | Bank Of Montreal /can/ | 1 564 | 35 | ||||||
| 2025-07-31 | 13F | CAP Partners, LLC | 41 806 | 948 | ||||||
| 2025-08-01 | 13F | Gwn Securities Inc. | 87 508 | 308,53 | 1 985 | 410,03 | ||||
| 2025-08-06 | 13F | Wedbush Securities Inc | 32 666 | 96,37 | 1 | |||||
| 2025-07-25 | 13F | Apollon Wealth Management, LLC | 38 579 | −1,83 | 875 | 22,41 | ||||
| 2025-08-12 | 13F | Steward Partners Investment Advisory, Llc | 976 | 43,53 | 22 | 83,33 | ||||
| 2025-09-04 | 13F/A | Advisor Group Holdings, Inc. | 26 128 | −42,01 | 593 | −27,72 | ||||
| 2025-07-14 | 13F | Financial Enhancement Group LLC | 52 487 | 1 189 | ||||||
| 2025-08-14 | 13F | Fortress Private Ledger, Llc | 33 318 | 2,40 | 756 | 27,75 | ||||
| 2025-08-13 | 13F | Flow Traders U.s. Llc | 0 | −100,00 | 0 | |||||
| 2025-07-22 | 13F | Coastal Investment Advisors, Inc. | 0 | −100,00 | 0 | |||||
| 2025-08-14 | 13F | Core Wealth Advisors, Inc. | 16 079 | 365 | ||||||
| 2025-07-16 | 13F | Essex Financial Services, Inc. | 9 000 | 204 | ||||||
| 2025-09-12 | 13F/A | Valeo Financial Advisors, LLC | 26 621 | 200 | ||||||
| 2025-07-10 | 13F | Atticus Wealth Management, Llc | 1 000 | 0,00 | 23 | 22,22 | ||||
| 2025-08-14 | 13F | Jane Street Group, Llc | 0 | −100,00 | 0 | |||||
| 2025-07-28 | 13F | Harbour Investments, Inc. | 76 208 | 72,81 | 1 728 | 115,73 | ||||
| 2025-08-08 | 13F | Your Advocates Ltd., LLP | 0 | −100,00 | 0 | |||||
| 2025-08-15 | 13F | Captrust Financial Advisors | 26 200 | 127,08 | 594 | 184,21 | ||||
| 2025-08-14 | 13F | Raymond James Financial Inc | 5 153 | 117 | ||||||
| 2025-08-15 | 13F | Morgan Stanley | 13 318 | 7,90 | 302 | 34,82 | ||||
| 2025-08-14 | 13F | Diversify Advisory Services, LLC | 483 977 | 11 591 | ||||||
| 2025-08-14 | 13F | Mariner, LLC | 9 450 | 214 | ||||||
| 2025-05-15 | 13F | Tower Research Capital LLC (TRC) | 0 | −100,00 | 0 | |||||
| 2025-07-21 | 13F | HighMark Wealth Management LLC | 0 | −100,00 | 0 | |||||
| 2025-08-12 | 13F | Weaver Consulting Group | 228 880 | 17,39 | 5 191 | 46,49 | ||||
| 2025-07-07 | 13F | Whitaker-Myers Wealth Managers, LTD. | 37 800 | 41,93 | 857 | 77,07 | ||||
| 2025-07-07 | 13F | OMNI 360 Wealth, Inc. | 38 059 | 7,05 | 863 | 33,59 | ||||
| 2025-08-12 | 13F | J.w. Cole Advisors, Inc. | 10 415 | 236 | ||||||
| 2025-08-05 | 13F | Simplex Trading, Llc | 57 285 | 198,25 | 1 | |||||
| 2025-07-17 | 13F | Venture Visionary Partners LLC | 825 788 | 3,80 | 18 729 | 29,52 | ||||
| 2025-07-22 | 13F | DAVENPORT & Co LLC | 71 955 | 34,21 | 1 632 | 67,45 | ||||
| 2025-08-26 | 13F/A | Thrivent Financial For Lutherans | 2 425 830 | 55 | ||||||
| 2025-08-08 | 13F | Larson Financial Group LLC | 13 595 | −0,44 | 308 | 24,19 | ||||
| 2025-08-12 | 13F | Integrated Advisors Network LLC | 35 877 | 2,91 | 814 | 28,44 | ||||
| 2025-08-06 | 13F | Commonwealth Equity Services, Llc | 218 790 | 48,89 | 5 | 100,00 | ||||
| 2025-08-21 | 13F | Aveo Capital Partners, LLC | 0 | −100,00 | 0 | |||||
| 2025-07-17 | 13F | Nelson, Van Denburg & Campbell Wealth Management Group, LLC | 9 606 | 218 | ||||||
| 2025-08-01 | 13F | Envestnet Asset Management Inc | 48 180 | 205,79 | 1 093 | 281,82 | ||||
| 2025-07-16 | 13F | Dakota Wealth Management | 12 317 | 279 | ||||||
| 2025-08-14 | 13F | GWM Advisors LLC | 295 097 | 231,18 | 6 693 | 313,34 | ||||
| 2025-07-24 | 13F | IFP Advisors, Inc | 223 493 | 21,13 | 5 069 | 51,15 | ||||
| 2025-07-09 | 13F | Sandbox Financial Partners, LLC | 11 057 | −49,56 | 251 | −37,19 | ||||
| 2025-07-25 | 13F | Cwm, Llc | 22 004 | 4 789,78 | 0 | |||||
| 2025-07-31 | 13F | Kranot Hishtalmut Le Morim Ve Gananot Havera Menahelet LTD | 495 148 | 0,00 | 11 237 | 24,93 | ||||
| 2025-08-14 | 13F | Harmony Asset Management Llc | 9 240 | 210 | ||||||
| 2025-08-12 | 13F | CIBC Private Wealth Group, LLC | 4 500 | 102 | ||||||
| 2025-04-23 | 13F | Western Wealth Management, LLC | 0 | −100,00 | 0 | −100,00 | ||||
| 2025-08-11 | 13F | Principal Securities, Inc. | 9 463 | 157,36 | 215 | 193,15 | ||||
| 2025-08-14 | 13F | Snowden Capital Advisors LLC | 124 881 | 15,11 | 2 832 | 43,68 | ||||
| 2025-08-13 | 13F | Jones Financial Companies Lllp | 0 | −100,00 | 0 | |||||
| 2025-08-14 | 13F | Toroso Investments, LLC | 11 110 | 252 | ||||||
| 2025-08-06 | 13F | AE Wealth Management LLC | 1 857 | 42 | ||||||
| 2025-08-14 | 13F | Riggs Asset Managment Co. Inc. | 78 557 | 133,20 | 1 782 | 191,01 | ||||
| 2025-07-23 | 13F | Meitav Dash Investments Ltd | 667 000 | 0,00 | 15 128 | 24,79 | ||||
| 2025-08-13 | 13F | Truvestments Capital Llc | 16 250 | 369 | ||||||
| 2025-08-14 | 13F | Bank Of America Corp /de/ | 6 235 | 259,37 | 141 | 354,84 | ||||
| 2025-07-15 | 13F | DKM Wealth Management, Inc. | 307 876 | 15,06 | 6 983 | 43,57 | ||||
| 2025-08-13 | 13F | Renaissance Technologies Llc | 132 200 | 2 998 | ||||||
| 2025-08-11 | 13F | Theory Financial Llc | 188 853 | 4 434 | ||||||
| 2025-08-15 | 13F | First Heartland Consultants, Inc. | 180 295 | 62,33 | 4 089 | 102,63 | ||||
| 2025-08-12 | 13F | LPL Financial LLC | 79 327 | 1 799 | ||||||
| 2025-07-22 | 13F | Cedar Mountain Advisors, LLC | 750 | 0,00 | 17 | 30,77 | ||||
| 2025-08-13 | 13F | Scotia Capital Inc. | 50 695 | 1 150 | ||||||
| 2025-08-08 | 13F | Avantax Advisory Services, Inc. | 12 669 | 287 |