Grundläggande statistik
| Institutionella ägare | 98 total, 98 long only, 0 short only, 0 long/short - change of 3,09% MRQ |
| Genomsnittlig portföljallokering | 0.0802 % - change of 0,34% MRQ |
| Institutionella aktier (lång) | 4 786 203 (ex 13D/G) - change of −0,38MM shares −7,32% MRQ |
| Institutionellt värde (lång) | $ 146 269 USD ($1000) |
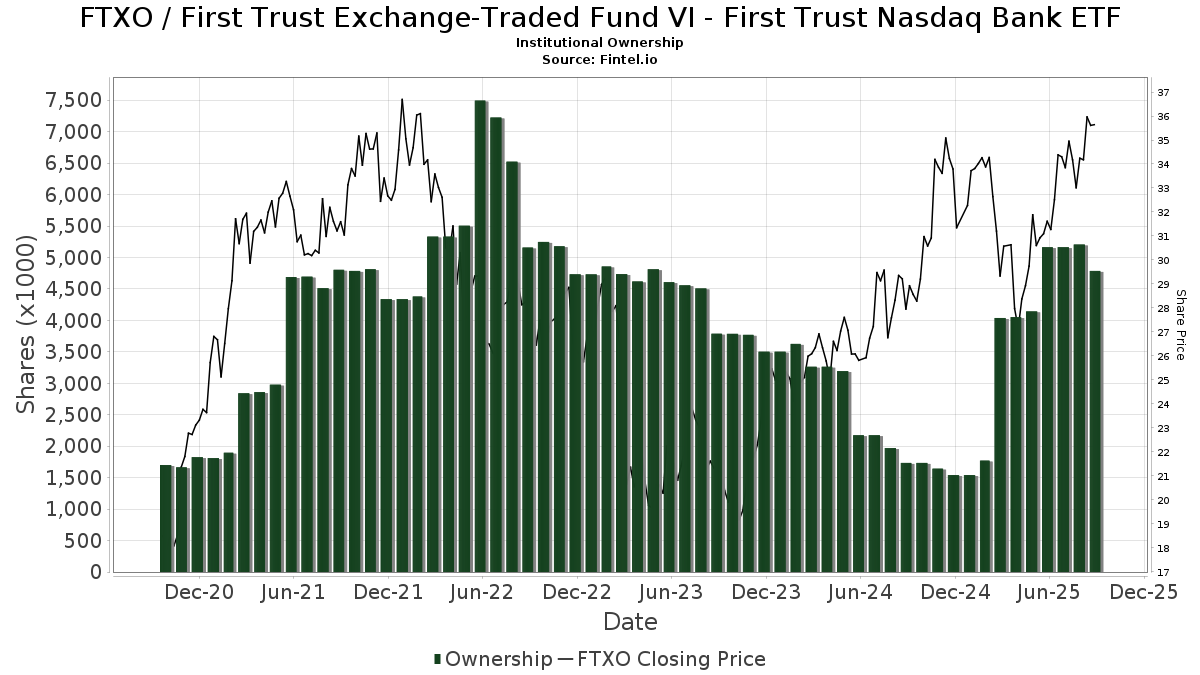
Institutionellt ägande och aktieägare
First Trust Exchange-Traded Fund VI - First Trust Nasdaq Bank ETF (US:FTXO) har 98 Institutionella ägare och aktieägare som har lämnat in 13D/G- eller 13F-formulär till Securities Exchange Commission (SEC). Dessa institut innehar totalt 4,786,203 aktier. Största aktieägare inkluderar LPL Financial LLC, Morgan Stanley, Envestnet Asset Management Inc, Wells Fargo & Company/mn, UBS Group AG, TradeWell Securities, LLC., Wagner Wealth Management, Llc, Royal Bank Of Canada, Raymond James Financial Inc, and Bank Of America Corp /de/ .
First Trust Exchange-Traded Fund VI - First Trust Nasdaq Bank ETF (NasdaqGM:FTXO) Institutionell ägarstruktur visar institutioners och fonders nuvarande positioner i företaget, samt de senaste förändringarna i positionernas storlek. Större aktieägare kan vara enskilda investerare, fonder, hedgefonder eller institutioner. Bilaga 13D visar att investeraren äger (eller ägde) mer än 5% av företaget och avser (eller avsåg) att aktivt eftersträva en förändring av affärsstrategin. Schedule 13G indikerar en passiv investering på över 5%.
The share price as of September 5, 2025 is 35,56 / share. Previously, on September 9, 2024, the share price was 28,65 / share. This represents an increase of 24,12% over that period.
Fondsentimentets poäng
Fondsentimentet poängen(fka Ägarackumulation-poäng) visar vilka aktier som är mest köpta av fonder. Det är resultatet av en sofistikerad kvantitativ flerfaktormodell som identifierar företag med de högsta nivåerna av institutionell ackumulering. Poängsättningsmodellen använder en kombination av den totala ökningen av redovisade ägare, förändringarna i portföljallokeringarna för dessa ägare och andra mått. Siffran sträcker sig från 0 till 100, där högre siffror indikerar en högre nivå av ackumulering i förhållande till sina konkurrenter, och 50 är genomsnittet.
Uppdateringsfrekvens: Dagligen
Se Ownership Explorer, som innehåller en lista över de högst rankade företagen.
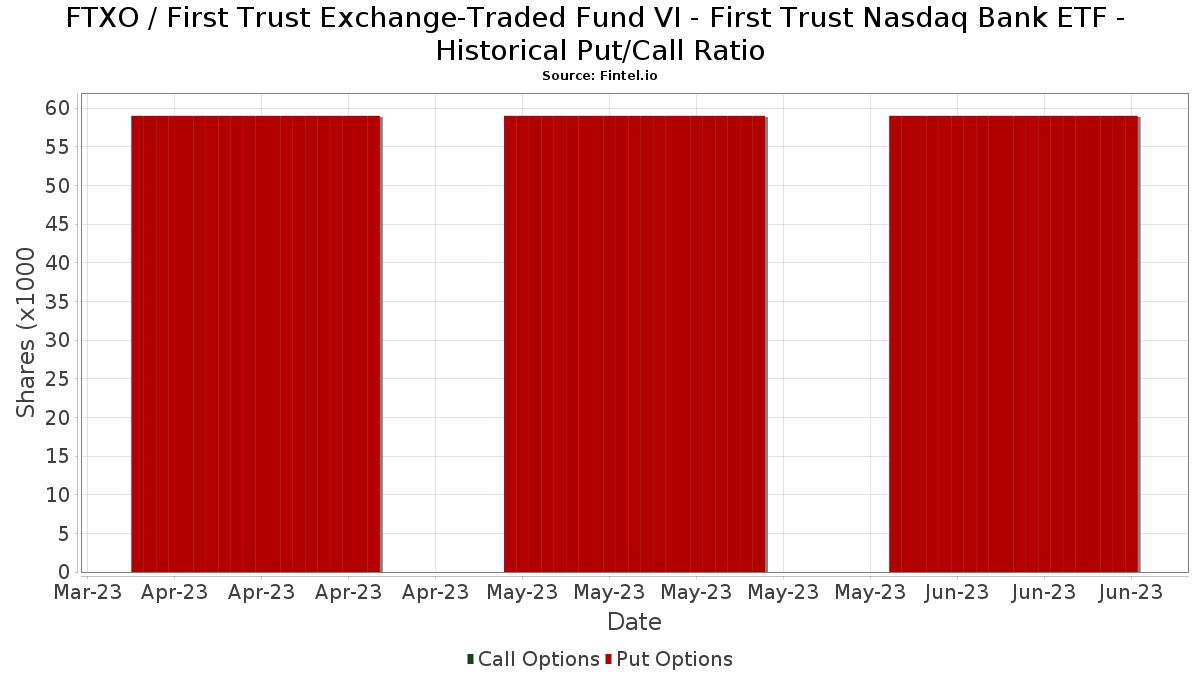
Institutionell sälj/köp-kvot
Förutom att rapportera vanliga eget kapital- och skuldemissioner måste institutioner med mer än 100MM tillgångar under förvaltning också avslöja sina innehav av sälj- och köpoptioner. Eftersom säljoptioner i allmänhet indikerar ett negativt sentiment och köpoptioner indikerar ett positivt sentiment, kan vi få en uppfattning om det övergripande institutionella sentimentet genom att plotta förhållandet mellan säljoptioner och köpoptioner. Diagrammet till höger visar det historiska förhållandet mellan sälj- och köpoptioner för detta instrument.
Genom att använda sälj/köp-kvoten som en indikator på aktieägarnas sentiment undviker man en av de största bristerna med att använda det totala institutionella ägandet, nämligen att en betydande del av de förvaltade tillgångarna investeras passivt för att följa index. Passivt förvaltade fonder köper vanligtvis inte optioner, så indikatorn för sälj/köp-kvoten ger en bättre bild av stämningen i aktivt förvaltade fonder.
13F- och NPORT-arkiveringar
Detaljer om 13F-arkiveringar är gratis. Detaljer om NP-arkiveringar kräver ett premiummedlemskap. Gröna rader indikerar nya positioner. Röda rader indikerar stängda positioner. Klicka på länk symbolen för att se hela transaktionshistoriken.
Uppgradera
för att låsa upp premiumdata och exportera till Excel ![]() .
.
| Fil Datum | Källa | Investerare | Typ | Genomsnittligt pris (beräknat) |
Aktier | Δ Aktier (%) |
Rapporterat värde (1000 USD) |
Δ Värde (%) |
Portföljallokering (%) |
|
|---|---|---|---|---|---|---|---|---|---|---|
| 2025-08-15 | 13F | Morgan Stanley | 611 211 | −33,12 | 20 188 | −27,33 | ||||
| 2025-08-11 | 13F | Principal Securities, Inc. | 5 016 | 12,92 | 166 | 17,02 | ||||
| 2025-08-13 | 13F | Transce3nd, LLC | 89 | 0,00 | 3 | 0,00 | ||||
| 2025-08-08 | 13F | Hartland & Co., LLC | 3 077 | 102 | ||||||
| 2025-07-17 | 13F | Wagner Wealth Management, Llc | 166 630 | 4,98 | 5 504 | 14,05 | ||||
| 2025-07-31 | 13F | Cambridge Investment Research Advisors, Inc. | 112 216 | 29,49 | 4 | 50,00 | ||||
| 2025-08-12 | 13F | LPL Financial LLC | 617 552 | 17,27 | 20 398 | 27,42 | ||||
| 2025-08-27 | 13F/A | Brinker Capital Investments, LLC | 26 115 | −1,17 | 863 | 7,35 | ||||
| 2025-07-31 | 13F | Topsail Wealth Management, LLC | 400 | −33,33 | 13 | −27,78 | ||||
| 2025-08-11 | 13F | Citigroup Inc | 700 | 23 | ||||||
| 2025-08-04 | 13F | Creative Financial Designs Inc /adv | 3 613 | 6,14 | 119 | 15,53 | ||||
| 2025-05-15 | 13F/A | Orion Portfolio Solutions, LLC | 26 424 | 0,48 | 803 | −3,95 | ||||
| 2025-08-06 | 13F | Commonwealth Equity Services, Llc | 19 719 | 16,72 | 1 | |||||
| 2025-08-13 | 13F | Virtue Capital Management, LLC | 0 | −100,00 | 0 | |||||
| 2025-05-14 | 13F | Bnp Paribas Arbitrage, Sa | 0 | −100,00 | 0 | |||||
| 2025-08-14 | 13F | Citadel Advisors Llc | 13 443 | 444 | ||||||
| 2025-07-08 | 13F | Nbc Securities, Inc. | 1 334 | −4,58 | 0 | |||||
| 2025-08-13 | 13F | Icapital Wealth Llc | 7 361 | 0,00 | 243 | 8,97 | ||||
| 2025-08-14 | 13F | Sherman Asset Management, Inc. | 870 | 0,00 | 29 | 7,69 | ||||
| 2025-07-28 | 13F | RFG Advisory, LLC | 7 359 | 2,12 | 243 | 10,96 | ||||
| 2025-08-12 | 13F | CIBC Private Wealth Group, LLC | 53 | 2 | ||||||
| 2025-08-12 | 13F | Proequities, Inc. | 0 | 0 | ||||||
| 2025-07-08 | 13F | Arlington Trust Co LLC | 0 | −100,00 | 0 | |||||
| 2025-08-12 | 13F | OneAscent Financial Services LLC | 23 477 | 7,47 | 1 | |||||
| 2025-08-14 | 13F | Guardian Wealth Advisors, Llc / Nc | 40 | 0,00 | 1 | 0,00 | ||||
| 2025-08-07 | 13F | Private Advisory Group LLC | 0 | −100,00 | 0 | |||||
| 2025-07-25 | 13F | Atria Wealth Solutions, Inc. | 12 332 | −22,98 | 407 | −16,26 | ||||
| 2025-07-31 | 13F | Nilsine Partners, LLC | 38 540 | 1,24 | 1 273 | 9,94 | ||||
| 2025-08-14 | 13F | Royal Bank Of Canada | 162 608 | −25,59 | 5 371 | −19,15 | ||||
| 2025-08-01 | 13F | Envestnet Asset Management Inc | 360 429 | 0,90 | 11 905 | 9,62 | ||||
| 2025-08-14 | 13F | UBS Group AG | 239 481 | −15,61 | 7 910 | −8,31 | ||||
| 2025-08-13 | 13F/A | StoneX Group Inc. | 7 283 | −50,81 | 212 | −46,17 | ||||
| 2025-08-06 | 13F | Prospera Financial Services Inc | 51 896 | 0,07 | 1 714 | 8,76 | ||||
| 2025-08-04 | 13F | Pensionmark Financial Group, Llc | 37 450 | 19,62 | 1 237 | 29,97 | ||||
| 2025-04-28 | 13F | DAVENPORT & Co LLC | 0 | −100,00 | 0 | |||||
| 2025-08-04 | 13F | Spire Wealth Management | 50 | 0,00 | 2 | 0,00 | ||||
| 2025-08-14 | 13F | Wells Fargo & Company/mn | 277 505 | −19,66 | 9 166 | −12,70 | ||||
| 2025-07-17 | 13F | Janney Montgomery Scott LLC | 107 053 | −7,71 | 4 | 0,00 | ||||
| 2025-08-14 | 13F | Comerica Bank | 962 | 4,34 | 32 | 10,71 | ||||
| 2025-08-14 | 13F | Raymond James Financial Inc | 162 326 | −34,33 | 5 362 | −28,64 | ||||
| 2025-08-13 | 13F | Continuum Advisory, LLC | 0 | −100,00 | 0 | |||||
| 2025-08-14 | 13F | Susquehanna International Group, Llp | 9 579 | −82,80 | 316 | −81,33 | ||||
| 2025-08-12 | 13F | SRS Capital Advisors, Inc. | 100 | 0,00 | 3 | 0,00 | ||||
| 2025-05-09 | 13F | CoreCap Advisors, LLC | 0 | −100,00 | 0 | |||||
| 2025-08-06 | 13F | RFG - Bristol Wealth Advisors, LLC | 0 | −100,00 | 0 | |||||
| 2025-08-15 | 13F | Tower Research Capital LLC (TRC) | 13 397 | 602,52 | 443 | 675,44 | ||||
| 2025-09-04 | 13F/A | Advisor Group Holdings, Inc. | 38 805 | 8,96 | 1 267 | 17,10 | ||||
| 2025-07-24 | 13F | IFP Advisors, Inc | 39 926 | −2,30 | 1 319 | 6,12 | ||||
| 2025-07-28 | 13F | BRYN MAWR TRUST Co | 207 | 0,00 | 7 | 0,00 | ||||
| 2025-08-11 | 13F | NewEdge Wealth, LLC | 18 772 | −2,33 | 614 | 4,97 | ||||
| 2025-08-11 | 13F | Aptus Capital Advisors, LLC | 40 | 0,00 | 1 | 0,00 | ||||
| 2025-07-02 | 13F | HBW Advisory Services LLC | 7 888 | 5,72 | 261 | 15,04 | ||||
| 2025-08-08 | 13F | Avantax Advisory Services, Inc. | 15 563 | 514 | ||||||
| 2025-08-18 | 13F | Geneos Wealth Management Inc. | 1 212 | 0,00 | 40 | 11,11 | ||||
| 2025-07-18 | 13F | Truist Financial Corp | 106 834 | 0,05 | 3 529 | 8,72 | ||||
| 2025-07-30 | 13F | BlueChip Wealth Advisors LLC | 6 764 | 0,00 | 223 | 8,78 | ||||
| 2025-08-05 | 13F | Bank of New York Mellon Corp | 36 500 | −1,68 | 1 206 | 6,83 | ||||
| 2025-08-14 | 13F | Goldman Sachs Group Inc | 22 821 | 13,54 | 754 | 23,24 | ||||
| 2025-08-07 | 13F | Resources Investment Advisors, LLC. | 0 | −100,00 | 0 | |||||
| 2025-08-14 | 13F | Fmr Llc | 55 | 0,00 | 2 | 0,00 | ||||
| 2025-05-02 | 13F | Capital A Wealth Management, LLC | 0 | −100,00 | 0 | |||||
| 2025-08-12 | 13F | Steward Partners Investment Advisory, Llc | 1 378 | 135,96 | 46 | 164,71 | ||||
| 2025-08-12 | 13F | MAI Capital Management | 460 | 0,00 | 15 | 15,38 | ||||
| 2025-08-13 | 13F | Gateway Wealth Partners, LLC | 28 750 | −2,66 | 950 | 5,80 | ||||
| 2025-08-20 | 13F/A | Coppell Advisory Solutions LLC | 19 000 | −44,01 | 624 | −36,97 | ||||
| 2025-08-15 | 13F | Equitable Holdings, Inc. | 13 121 | −12,05 | 433 | −4,42 | ||||
| 2025-07-21 | 13F | Ameritas Advisory Services, LLC | 184 | 6 | ||||||
| 2025-08-06 | 13F | AE Wealth Management LLC | 35 922 | −19,61 | 1 187 | −12,67 | ||||
| 2025-08-13 | 13F | Flow Traders U.s. Llc | 60 055 | 2 | ||||||
| 2025-08-14 | 13F | Stifel Financial Corp | 25 761 | −13,68 | 851 | −6,28 | ||||
| 2025-07-16 | 13F | American National Bank | 94 | 0,00 | 3 | 50,00 | ||||
| 2025-07-28 | 13F | Harbour Investments, Inc. | 10 762 | 4,78 | 355 | 13,78 | ||||
| 2025-07-23 | 13F | Element Wealth, LLC | 21 905 | 724 | ||||||
| 2025-08-14 | 13F | Transamerica Financial Advisors, Inc. | 152 | 0,00 | 5 | |||||
| 2025-05-16 | 13F/A | Kestra Investment Management, LLC | 0 | −100,00 | 0 | |||||
| 2025-08-14 | 13F | Pinnacle Family Advisors, LLC | 6 605 | 218 | ||||||
| 2025-08-14 | 13F | Mpwm Advisory Solutions, Llc | 0 | 0 | ||||||
| 2025-07-24 | 13F | Us Bancorp \de\ | 6 396 | 211 | ||||||
| 2025-07-15 | 13F | FLP Wealth Management, LLC | 0 | −100,00 | 0 | |||||
| 2025-08-15 | 13F | Puff Wealth Management, Llc | 28 465 | −11,46 | 940 | −3,79 | ||||
| 2025-07-14 | 13F | AdvisorNet Financial, Inc | 158 | 37,39 | 5 | 66,67 | ||||
| 2025-08-04 | 13F | Assetmark, Inc | 141 526 | 21,95 | 4 675 | 32,52 | ||||
| 2025-07-15 | 13F | Traction Financial Partners, LLC | 6 663 | 220 | ||||||
| 2025-04-30 | 13F | TradeWell Securities, LLC. | 218 597 | −3,22 | 6 645 | −7,50 | ||||
| 2025-08-06 | 13F | First Horizon Advisors, Inc. | 676 | 0,00 | 22 | 10,00 | ||||
| 2025-08-11 | 13F | Synergy Investment Management, LLC | 0 | −100,00 | 0 | |||||
| 2025-08-14 | 13F | Benjamin Edwards Inc | 45 491 | 21,57 | 1 503 | 32,10 | ||||
| 2025-07-07 | 13F | Thurston, Springer, Miller, Herd & Titak, Inc. | 1 065 | −21,98 | 35 | −14,63 | ||||
| 2025-08-14 | 13F | GWM Advisors LLC | 23 915 | 13,48 | 790 | 23,28 | ||||
| 2025-08-05 | 13F | Sigma Planning Corp | 0 | −100,00 | 0 | |||||
| 2025-07-29 | 13F | International Assets Investment Management, Llc | 9 688 | −0,41 | 320 | 8,14 | ||||
| 2025-08-05 | 13F | EPG Wealth Management LLC | 0 | −100,00 | 0 | −100,00 | ||||
| 2025-08-14 | 13F | Bank Of America Corp /de/ | 158 051 | −27,80 | 5 220 | −21,55 | ||||
| 2025-08-14 | 13F | Snowden Capital Advisors LLC | 32 942 | −6,42 | 1 088 | 1,68 | ||||
| 2025-07-10 | 13F | Wealth Enhancement Advisory Services, Llc | 11 781 | −12,60 | 409 | 0,00 | ||||
| 2025-08-07 | 13F | PFG Advisors | 65 703 | 22,56 | 2 170 | 33,21 | ||||
| 2025-07-25 | 13F | Cwm, Llc | 439 | 36,34 | 0 | |||||
| 2025-08-08 | 13F | Cetera Investment Advisers | 148 399 | 11,94 | 4 902 | 21,61 | ||||
| 2025-07-25 | 13F | Envestnet Portfolio Solutions, Inc. | 17 003 | −32,69 | 562 | −26,86 | ||||
| 2025-05-14 | 13F | Huntington National Bank | 2 | 0,00 | ||||||
| 2025-08-05 | 13F | Key FInancial Inc | 82 | 0,00 | 3 | 0,00 | ||||
| 2025-08-14 | 13F | Mml Investors Services, Llc | 12 002 | −19,76 | 0 | |||||
| 2025-07-30 | 13F | D.a. Davidson & Co. | 17 678 | 0,86 | 584 | 9,59 | ||||
| 2025-08-13 | 13F | Baird Financial Group, Inc. | 0 | −100,00 | 0 | |||||
| 2025-08-15 | 13F | Kestra Advisory Services, LLC | 60 839 | 6,26 | 2 009 | 15,46 | ||||
| 2025-07-17 | 13F | Sound Income Strategies, LLC | 0 | 0 | ||||||
| 2025-04-10 | 13F | Secure Asset Management, LLC | 0 | −100,00 | 0 | −100,00 | ||||
| 2025-08-12 | 13F | Global Retirement Partners, LLC | 6 413 | 758,50 | 212 | 817,39 | ||||
| 2025-08-04 | 13F | Atria Investments Llc | 31 134 | 9,67 | 1 028 | 19,12 | ||||
| 2025-07-14 | 13F | Park Avenue Securities Llc | 0 | −100,00 | 0 | |||||
| 2025-07-14 | 13F | Iams Wealth Management, Llc | 35 836 | −3,78 | 1 184 | 4,51 | ||||
| 2025-08-05 | 13F | GPS Wealth Strategies Group, LLC | 530 | 0,00 | 18 | 6,25 | ||||
| 2025-08-08 | 13F | Larson Financial Group LLC | 1 638 | 0,18 | 54 | 10,20 | ||||
| 2025-05-12 | 13F | Independent Advisor Alliance | 0 | −100,00 | 0 | |||||
| 2025-08-08 | 13F | Emerald Investment Partners, Llc | 440 | 0,00 | 15 | 7,69 | ||||
| 2025-08-01 | 13F | Rossby Financial, LCC | 348 | 3,26 | 11 | 22,22 | ||||
| 2025-05-14 | 13F | Jane Street Group, Llc | 0 | −100,00 | 0 | |||||
| 2025-08-14 | 13F | Two Sigma Investments, Lp | 45 100 | 1 490 | ||||||
| 2025-08-14 | 13F | Great Valley Advisor Group, Inc. | 9 479 | 4,18 | 313 | 13,41 | ||||
| 2025-08-06 | 13F | Decker Retirement Planning Inc. | 4 | 0,00 | 0 | |||||
| 2025-08-14 | 13F | Qube Research & Technologies Ltd | 46 | 0,00 | 2 | 0,00 | ||||
| 2025-08-13 | 13F | Alerus Financial Na | 450 | 15 |