Grundläggande statistik
| Institutionella ägare | 111 total, 111 long only, 0 short only, 0 long/short - change of 0,91% MRQ |
| Genomsnittlig portföljallokering | 0.1146 % - change of −56,72% MRQ |
| Institutionella aktier (lång) | 3 461 046 (ex 13D/G) - change of −1,65MM shares −32,30% MRQ |
| Institutionellt värde (lång) | $ 166 478 USD ($1000) |
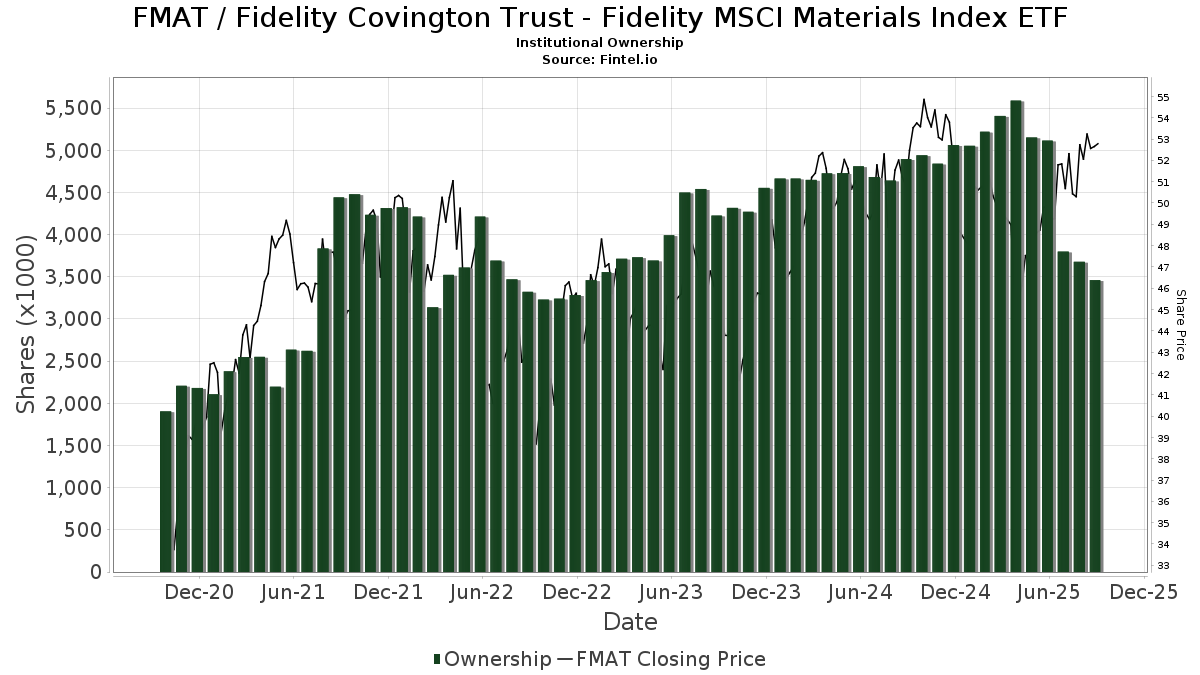
Institutionellt ägande och aktieägare
Fidelity Covington Trust - Fidelity MSCI Materials Index ETF (US:FMAT) har 111 Institutionella ägare och aktieägare som har lämnat in 13D/G- eller 13F-formulär till Securities Exchange Commission (SEC). Dessa institut innehar totalt 3,461,046 aktier. Största aktieägare inkluderar AE Wealth Management LLC, Lido Advisors, LLC, Northern Lights Fund Trust - PFG Fidelity Institutional AM® Equity Sector Strategy Fund Class R Shares, Centerline Wealth Advisors, LLC, Agf Management Ltd, LPL Financial LLC, Commonwealth Equity Services, Llc, Certified Advisory Corp, Advisor Group Holdings, Inc., and Steward Partners Investment Advisory, Llc .
Fidelity Covington Trust - Fidelity MSCI Materials Index ETF (ARCA:FMAT) Institutionell ägarstruktur visar institutioners och fonders nuvarande positioner i företaget, samt de senaste förändringarna i positionernas storlek. Större aktieägare kan vara enskilda investerare, fonder, hedgefonder eller institutioner. Bilaga 13D visar att investeraren äger (eller ägde) mer än 5% av företaget och avser (eller avsåg) att aktivt eftersträva en förändring av affärsstrategin. Schedule 13G indikerar en passiv investering på över 5%.
The share price as of September 8, 2025 is 53,36 / share. Previously, on September 9, 2024, the share price was 50,62 / share. This represents an increase of 5,41% over that period.
Fondsentimentets poäng
Fondsentimentet poängen(fka Ägarackumulation-poäng) visar vilka aktier som är mest köpta av fonder. Det är resultatet av en sofistikerad kvantitativ flerfaktormodell som identifierar företag med de högsta nivåerna av institutionell ackumulering. Poängsättningsmodellen använder en kombination av den totala ökningen av redovisade ägare, förändringarna i portföljallokeringarna för dessa ägare och andra mått. Siffran sträcker sig från 0 till 100, där högre siffror indikerar en högre nivå av ackumulering i förhållande till sina konkurrenter, och 50 är genomsnittet.
Uppdateringsfrekvens: Dagligen
Se Ownership Explorer, som innehåller en lista över de högst rankade företagen.
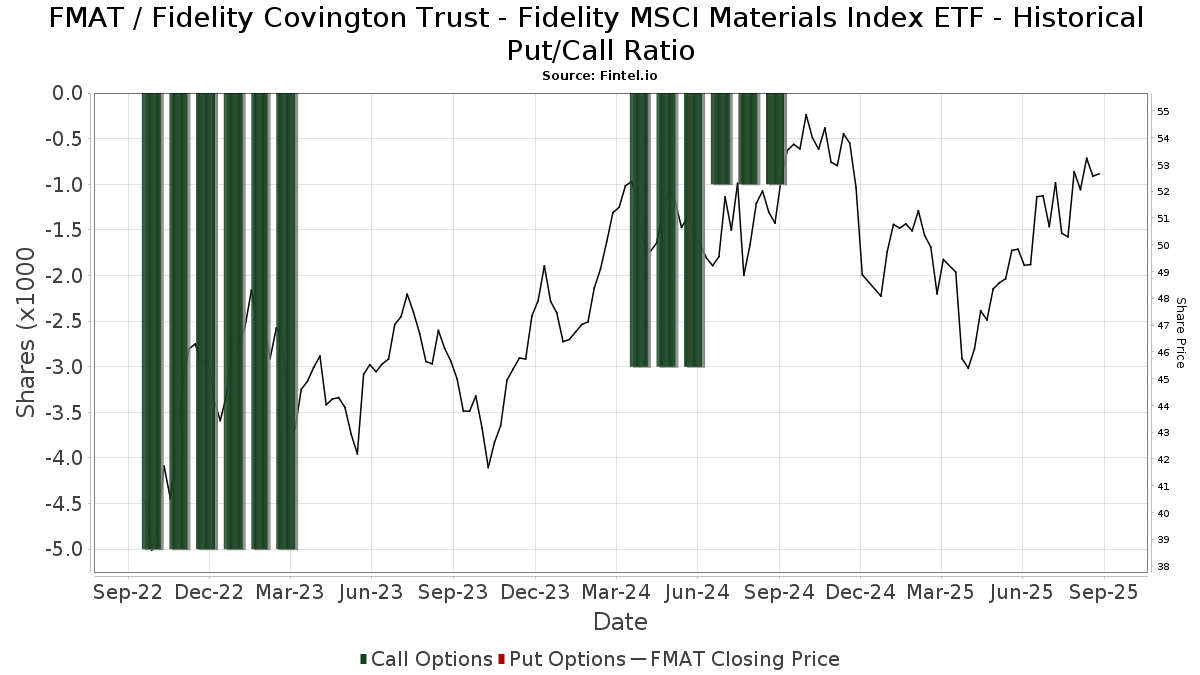
Institutionell sälj/köp-kvot
Förutom att rapportera vanliga eget kapital- och skuldemissioner måste institutioner med mer än 100MM tillgångar under förvaltning också avslöja sina innehav av sälj- och köpoptioner. Eftersom säljoptioner i allmänhet indikerar ett negativt sentiment och köpoptioner indikerar ett positivt sentiment, kan vi få en uppfattning om det övergripande institutionella sentimentet genom att plotta förhållandet mellan säljoptioner och köpoptioner. Diagrammet till höger visar det historiska förhållandet mellan sälj- och köpoptioner för detta instrument.
Genom att använda sälj/köp-kvoten som en indikator på aktieägarnas sentiment undviker man en av de största bristerna med att använda det totala institutionella ägandet, nämligen att en betydande del av de förvaltade tillgångarna investeras passivt för att följa index. Passivt förvaltade fonder köper vanligtvis inte optioner, så indikatorn för sälj/köp-kvoten ger en bättre bild av stämningen i aktivt förvaltade fonder.
13F- och NPORT-arkiveringar
Detaljer om 13F-arkiveringar är gratis. Detaljer om NP-arkiveringar kräver ett premiummedlemskap. Gröna rader indikerar nya positioner. Röda rader indikerar stängda positioner. Klicka på länk symbolen för att se hela transaktionshistoriken.
Uppgradera
för att låsa upp premiumdata och exportera till Excel ![]() .
.
| Fil Datum | Källa | Investerare | Typ | Genomsnittligt pris (beräknat) |
Aktier | Δ Aktier (%) |
Rapporterat värde (1000 USD) |
Δ Värde (%) |
Portföljallokering (%) |
|
|---|---|---|---|---|---|---|---|---|---|---|
| 2025-07-15 | 13F | Centerline Wealth Advisors, LLC | 174 962 | 4,12 | 8 725 | 7,46 | ||||
| 2025-08-14 | 13F | GWM Advisors LLC | 6 681 | 0,16 | 333 | 3,42 | ||||
| 2025-07-14 | 13F | Sweeney & Michel, Llc | 4 916 | 0,39 | 255 | 23,90 | ||||
| 2025-08-14 | 13F | Certified Advisory Corp | 73 989 | −22,00 | 3 690 | −19,51 | ||||
| 2025-09-04 | 13F/A | Advisor Group Holdings, Inc. | 57 025 | 6,09 | 2 854 | 9,52 | ||||
| 2025-07-28 | 13F | Rosenberg Matthew Hamilton | 3 572 | 0,00 | 178 | 3,49 | ||||
| 2025-05-01 | 13F | Quest 10 Wealth Builders, Inc. | 23 | 1 | ||||||
| 2025-06-30 | NP | Northern Lights Fund Trust - PFG Fidelity Institutional AM® Equity Sector Strategy Fund Class R Shares | 266 055 | −83,18 | 12 646 | −84,19 | ||||
| 2025-07-07 | 13F | Salem Investment Counselors Inc | 0 | −100,00 | 0 | |||||
| 2025-07-09 | 13F | Tounjian Advisory Partners, Llc | 20 512 | −1,51 | 991 | −1,49 | ||||
| 2025-07-17 | 13F | Avondale Wealth Management | 2 496 | 0,00 | 124 | 3,33 | ||||
| 2025-07-25 | 13F | Atria Wealth Solutions, Inc. | 8 638 | 6,22 | 447 | 13,78 | ||||
| 2025-08-14 | 13F | Snowden Capital Advisors LLC | 9 564 | −9,81 | 477 | −7,03 | ||||
| 2025-07-21 | 13F | Ameritas Advisory Services, LLC | 723 | 36 | ||||||
| 2025-08-08 | 13F | Capital Investment Advisory Services, LLC | 100 | 0,00 | 5 | 0,00 | ||||
| 2025-05-14 | 13F | Congress Wealth Management LLC / DE / | 0 | −100,00 | 0 | |||||
| 2025-08-04 | 13F | Creative Financial Designs Inc /adv | 626 | 0,00 | 31 | 3,33 | ||||
| 2025-08-05 | 13F | Bank of New York Mellon Corp | 0 | −100,00 | 0 | |||||
| 2025-08-06 | 13F | AE Wealth Management LLC | 915 330 | 0,64 | 45 648 | 3,86 | ||||
| 2025-08-13 | 13F | Level Four Advisory Services, Llc | 11 248 | 0,00 | 561 | 3,13 | ||||
| 2025-08-14 | 13F | Mml Investors Services, Llc | 6 232 | 17,32 | 0 | |||||
| 2025-08-11 | 13F | Mach-1 Financial Group, Inc. | 0 | −100,00 | 0 | |||||
| 2025-07-18 | 13F | Vicus Capital | 5 014 | 250 | ||||||
| 2025-07-15 | 13F | Lynch & Associates/in | 10 278 | 4,46 | 513 | 7,79 | ||||
| 2025-07-23 | 13F | Peak Financial Management, Inc. | 40 759 | −8,77 | 2 033 | −5,84 | ||||
| 2025-07-11 | 13F | Farther Finance Advisors, LLC | 8 | 0,00 | 0 | |||||
| 2025-07-28 | 13F | Harbour Investments, Inc. | 195 | 0,00 | 10 | 0,00 | ||||
| 2025-08-01 | 13F | Envestnet Asset Management Inc | 31 862 | −76,61 | 1 589 | −75,88 | ||||
| 2025-08-11 | 13F | PFG Private Wealth Management, LLC | 0 | −100,00 | 0 | |||||
| 2025-07-23 | 13F | Heck Capital Advisors, LLC | 15 445 | 1,92 | 770 | 5,19 | ||||
| 2025-07-31 | 13F | Sage Mountain Advisors LLC | 374 | 0,00 | 19 | 0,00 | ||||
| 2025-08-12 | 13F | Absolute Capital Management, LLC | 9 314 | −5,65 | 464 | −2,73 | ||||
| 2025-07-31 | 13F | CVA Family Office, LLC | 149 | 0,00 | 7 | 0,00 | ||||
| 2025-08-12 | 13F | Atlas Capital Advisors Llc | 19 | 1 | ||||||
| 2025-08-11 | 13F | Strategic Wealth Partners, Ltd. | 1 | 0 | ||||||
| 2025-08-11 | 13F | Wealthgarden F.s. Llc | 4 855 | −15,21 | 242 | −12,32 | ||||
| 2025-08-14 | 13F | Stifel Financial Corp | 30 665 | −7,47 | 1 529 | −4,50 | ||||
| 2025-08-11 | 13F | HighTower Advisors, LLC | 12 417 | −14,31 | 619 | −11,57 | ||||
| 2025-07-14 | 13F | AdvisorNet Financial, Inc | 300 | 0,00 | 15 | 0,00 | ||||
| 2025-04-23 | 13F | PMV Capital Advisers, LLC | 0 | −100,00 | 0 | |||||
| 2025-08-12 | 13F | MAI Capital Management | 2 558 | 0,31 | 128 | 3,25 | ||||
| 2025-08-05 | 13F | Trail Ridge Investment Advisors, LLC | 18 901 | −1,82 | 943 | 1,40 | ||||
| 2025-07-11 | 13F | Seacrest Wealth Management, Llc | 15 862 | 2,48 | 791 | 5,89 | ||||
| 2025-08-13 | 13F | SCS Capital Management LLC | 9 235 | 0,00 | 461 | 3,14 | ||||
| 2025-08-12 | 13F | J.w. Cole Advisors, Inc. | 26 206 | 18,54 | 1 307 | 22,28 | ||||
| 2025-08-12 | 13F | Global Retirement Partners, LLC | 820 | 0,86 | 41 | 2,56 | ||||
| 2025-08-14 | 13F | Modern Wealth Management, LLC | 32 778 | −10,11 | 1 635 | −7,21 | ||||
| 2025-05-06 | 13F | Atria Investments Llc | 0 | −100,00 | 0 | |||||
| 2025-07-02 | 13F | Central Pacific Bank - Trust Division | 76 | 0,00 | 4 | 0,00 | ||||
| 2025-08-12 | 13F | Franklin Resources Inc | 0 | −100,00 | 0 | |||||
| 2025-08-12 | 13F | Coldstream Capital Management Inc | 0 | −100,00 | 0 | |||||
| 2025-08-14 | 13F | Citadel Advisors Llc | Put | 0 | −100,00 | 0 | ||||
| 2025-07-16 | 13F | Essex Financial Services, Inc. | 6 136 | −11,34 | 306 | −8,38 | ||||
| 2025-08-14 | 13F | Bank Of America Corp /de/ | 19 874 | 13,21 | 991 | 16,86 | ||||
| 2025-05-15 | 13F/A | Orion Portfolio Solutions, LLC | 6 250 | −3,61 | 302 | −3,53 | ||||
| 2025-08-14 | 13F | Glen Eagle Advisors, LLC | 566 | 0,00 | 28 | 3,70 | ||||
| 2025-04-29 | 13F | Element Wealth, LLC | 0 | −100,00 | 0 | |||||
| 2025-07-23 | 13F | Beaumont Asset Management, L.L.C. | 4 979 | 3,69 | 248 | 6,90 | ||||
| 2025-07-22 | 13F | Yoder Wealth Management, Inc. | 22 275 | 4,91 | 1 111 | 8,29 | ||||
| 2025-08-08 | 13F | Avantax Advisory Services, Inc. | 0 | −100,00 | 0 | |||||
| 2025-07-24 | 13F | Robertson Stephens Wealth Management, LLC | 5 274 | 0,00 | 263 | 3,54 | ||||
| 2025-08-12 | 13F | Jpmorgan Chase & Co | 12 613 | −67,16 | 629 | −66,09 | ||||
| 2025-07-23 | 13F | Sachetta, LLC | 1 850 | −92,69 | 92 | −92,47 | ||||
| 2025-08-08 | 13F | Pnc Financial Services Group, Inc. | 148 | 7 | ||||||
| 2025-08-14 | 13F | Sunbelt Securities, Inc. | 30 991 | −3,97 | 1 493 | −4,23 | ||||
| 2025-05-09 | 13F | Pathway Financial Advisers, LLC | 0 | −100,00 | 0 | |||||
| 2025-08-06 | 13F | Decker Retirement Planning Inc. | 689 | 0,00 | 34 | 3,03 | ||||
| 2025-08-12 | 13F | Steward Partners Investment Advisory, Llc | 55 263 | 23 823,38 | 2 756 | 24 945,45 | ||||
| 2025-08-11 | 13F | Elite Financial, Inc. | 0 | −100,00 | 0 | |||||
| 2025-08-05 | 13F | Lifeworks Advisors, LLC | 32 288 | 10,69 | 1 610 | 14,27 | ||||
| 2025-04-09 | 13F | Roxbury Financial LLC | 0 | −100,00 | 0 | |||||
| 2025-04-29 | 13F | Lee Danner & Bass Inc | 0 | −100,00 | 0 | |||||
| 2025-08-15 | 13F | CI Private Wealth, LLC | 26 229 | −1,08 | 1 308 | 2,11 | ||||
| 2025-08-12 | 13F | Howe & Rusling Inc | 700 | 35 | ||||||
| 2025-05-16 | 13F/A | Kestra Investment Management, LLC | 0 | −100,00 | 0 | |||||
| 2025-08-06 | 13F | Legacy Bridge, LLC | 50 | 0,00 | 2 | 0,00 | ||||
| 2025-07-30 | 13F | Financial Perspectives, Inc | 443 | −8,85 | 22 | −4,35 | ||||
| 2025-07-31 | 13F | Cambridge Investment Research Advisors, Inc. | 18 079 | 6,91 | 1 | |||||
| 2025-07-16 | 13F | Signature Resources Capital Management, LLC | 193 | 10 | ||||||
| 2025-08-13 | 13F | KDK Private Wealth Management, LLC | 7 265 | −2,74 | 362 | 0,56 | ||||
| 2025-08-01 | 13F | Gwn Securities Inc. | 4 748 | 237 | ||||||
| 2025-08-08 | 13F | Emerald Investment Partners, Llc | 320 | 0,00 | 16 | 0,00 | ||||
| 2025-08-12 | 13F | SRS Capital Advisors, Inc. | 195 | 10 | ||||||
| 2025-08-14 | 13F | Brinker Capital Investments, LLC | 0 | −100,00 | 0 | |||||
| 2025-04-24 | 13F | HighMark Wealth Management LLC | 0 | −100,00 | 0 | |||||
| 2025-05-14 | 13F | Kestra Advisory Services, LLC | 0 | −100,00 | 0 | |||||
| 2025-08-14 | 13F | Raymond James Financial Inc | 10 469 | −11,01 | 522 | −8,10 | ||||
| 2025-08-01 | 13F | Penobscot Wealth Management | 19 712 | 13,50 | 983 | 17,16 | ||||
| 2025-08-08 | 13F | Cetera Investment Advisers | 14 739 | −80,94 | 735 | −80,32 | ||||
| 2025-07-25 | 13F | Cwm, Llc | 3 194 | −29,96 | 0 | |||||
| 2025-05-05 | 13F | Kestra Private Wealth Services, Llc | 0 | −100,00 | 0 | |||||
| 2025-05-16 | 13F | Coppell Advisory Solutions LLC | 0 | −100,00 | 0 | |||||
| 2025-08-13 | 13F | Northwestern Mutual Wealth Management Co | 1 404 | 33,46 | 70 | 40,00 | ||||
| 2025-07-30 | 13F | Cullen/frost Bankers, Inc. | 3 | −99,11 | 0 | −100,00 | ||||
| 2025-07-08 | 13F | Arlington Trust Co LLC | 100 | −61,54 | 5 | −66,67 | ||||
| 2025-08-12 | 13F | O'shaughnessy Asset Management, Llc | 2 220 | 13,15 | 111 | 17,02 | ||||
| 2025-08-06 | 13F | Agf Management Ltd | 159 257 | 91,46 | 7 942 | 97,61 | ||||
| 2025-07-15 | 13F | Mather Group, Llc. | 32 076 | 0,00 | 1 600 | 3,23 | ||||
| 2025-08-14 | 13F | Royal Bank Of Canada | 5 394 | 15,38 | 269 | 19,03 | ||||
| 2025-08-14 | 13F | Mariner, LLC | 6 337 | −7,25 | 316 | −4,24 | ||||
| 2025-05-12 | 13F | Providence First Trust Co | 0 | −100,00 | 0 | |||||
| 2025-08-14 | 13F | Comerica Bank | 1 976 | −9,98 | 99 | −7,55 | ||||
| 2025-05-02 | 13F | Capital A Wealth Management, LLC | 78 | 310,53 | 4 | |||||
| 2025-08-13 | 13F | Lido Advisors, LLC | 573 567 | 4,97 | 28 604 | 8,34 | ||||
| 2025-08-14 | 13F | Goldman Sachs Group Inc | 50 000 | −1,16 | 2 494 | 2,00 | ||||
| 2025-03-21 | 13F | Prostatis Group LLC | 0 | −100,00 | 0 | |||||
| 2025-08-11 | 13F | Heritage Wealth Advisors | 75 | 0,00 | 4 | 0,00 | ||||
| 2025-08-12 | 13F | Proequities, Inc. | 0 | 0 | ||||||
| 2025-08-13 | 13F | Russell Investments Group, Ltd. | 0 | −100,00 | 0 | |||||
| 2025-08-13 | 13F | Jones Financial Companies Lllp | 1 964 | 205,92 | 98 | 223,33 | ||||
| 2025-08-15 | 13F | Tower Research Capital LLC (TRC) | 3 909 | −67,85 | 195 | −66,95 | ||||
| 2025-08-15 | 13F | Morgan Stanley | 48 569 | −4,34 | 2 422 | −1,26 | ||||
| 2025-08-14 | 13F | Qube Research & Technologies Ltd | 1 824 | 91 | ||||||
| 2025-05-13 | 13F | Tocqueville Asset Management L.p. | 0 | −100,00 | 0 | |||||
| 2025-08-14 | 13F | Citadel Advisors Llc | Call | 0 | −100,00 | 0 | ||||
| 2025-08-14 | 13F | Susquehanna International Group, Llp | 20 949 | −83,22 | 1 045 | −82,70 | ||||
| 2025-05-14 | 13F | CIBC Private Wealth Group, LLC | 0 | −100,00 | 0 | |||||
| 2025-07-21 | 13F | Exchange Capital Management, Inc. | 16 543 | −3,29 | 825 | −0,24 | ||||
| 2025-07-17 | 13F | Sound Income Strategies, LLC | 201 | −89,07 | 10 | −88,64 | ||||
| 2025-08-14 | 13F | Fmr Llc | 14 660 | 25,22 | 731 | 29,38 | ||||
| 2025-08-14 | 13F | UBS Group AG | 5 200 | 44,93 | 259 | 49,71 | ||||
| 2025-07-15 | 13F | Elevated Capital Advisors, LLC | 22 497 | 0,00 | 1 087 | 0,00 | ||||
| 2025-08-08 | 13F | Tortoise Investment Management, LLC | 2 580 | 0,00 | 129 | 3,23 | ||||
| 2025-08-14 | 13F | Wells Fargo & Company/mn | 34 585 | −49,85 | 1 725 | −48,26 | ||||
| 2025-07-17 | 13F | Smith, Salley & Associates | 13 563 | 0,50 | 676 | 3,68 | ||||
| 2025-07-07 | 13F | Versant Capital Management, Inc | 370 | 0,00 | 18 | 5,88 | ||||
| 2025-04-30 | 13F | Allworth Financial LP | 0 | −100,00 | 0 | |||||
| 2025-07-14 | 13F | Park Avenue Securities Llc | 0 | −100,00 | 0 | |||||
| 2025-07-16 | 13F/A | CX Institutional | 1 929 | −16,42 | 0 | |||||
| 2025-08-11 | 13F | Principal Securities, Inc. | 11 390 | 568 | ||||||
| 2025-08-12 | 13F | LPL Financial LLC | 92 662 | −29,27 | 4 621 | −26,99 | ||||
| 2025-07-24 | 13F | IFP Advisors, Inc | 2 544 | 0,28 | 127 | 3,28 | ||||
| 2025-08-11 | 13F | Citigroup Inc | 4 665 | −35,26 | 233 | −33,33 | ||||
| 2025-05-15 | 13F | Newbridge Financial Services Group, Inc. | 0 | −100,00 | 0 | |||||
| 2025-08-19 | 13F | Advisory Services Network, LLC | 4 344 | −91,06 | 217 | −90,80 | ||||
| 2025-07-14 | 13F | UMA Financial Services, Inc. | 50 | 0,00 | 2 | 0,00 | ||||
| 2025-07-22 | 13F | Wealthcare Advisory Partners LLC | 17 886 | −18,71 | 892 | −16,18 | ||||
| 2025-07-25 | 13F | Concord Wealth Partners | 1 006 | −1,76 | 50 | 2,04 | ||||
| 2025-08-14 | 13F | Citadel Advisors Llc | 30 409 | −53,97 | 1 516 | −52,51 | ||||
| 2025-08-06 | 13F | Commonwealth Equity Services, Llc | 78 126 | −12,12 | 4 | −25,00 | ||||
| 2025-07-17 | 13F | Centennial Wealth Advisory LLC | 4 706 | −7,53 | 236 | −4,08 | ||||
| 2025-08-14 | 13F | Kovitz Investment Group Partners, LLC | 55 051 | 159,98 | 2 745 | 168,33 | ||||
| 2025-04-28 | 13F | Private Trust Co Na | 0 | −100,00 | 0 | |||||
| 2025-08-01 | 13F | Rossby Financial, LCC | 62 | 0,00 | 3 | 50,00 |