Grundläggande statistik
| Institutionella ägare | 193 total, 193 long only, 0 short only, 0 long/short - change of 6,56% MRQ |
| Genomsnittlig portföljallokering | 0.2430 % - change of 24,06% MRQ |
| Institutionella aktier (lång) | 8 385 950 (ex 13D/G) - change of 0,51MM shares 6,46% MRQ |
| Institutionellt värde (lång) | $ 606 543 USD ($1000) |
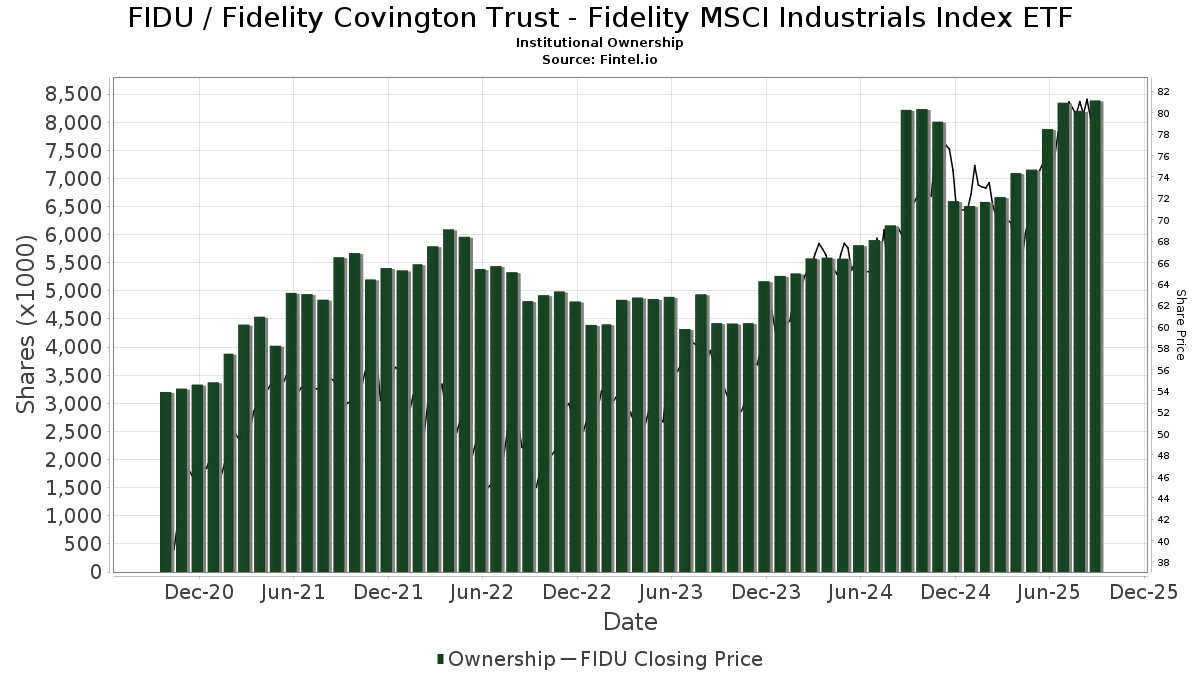
Institutionellt ägande och aktieägare
Fidelity Covington Trust - Fidelity MSCI Industrials Index ETF (US:FIDU) har 193 Institutionella ägare och aktieägare som har lämnat in 13D/G- eller 13F-formulär till Securities Exchange Commission (SEC). Dessa institut innehar totalt 8,385,950 aktier. Största aktieägare inkluderar Lido Advisors, LLC, AE Wealth Management LLC, Northwestern Mutual Wealth Management Co, Northern Lights Fund Trust - PFG Fidelity Institutional AM® Equity Sector Strategy Fund Class R Shares, Commonwealth Equity Services, Llc, Agf Management Ltd, Morgan Stanley, LPL Financial LLC, Full Sail Capital, LLC, and HighTower Advisors, LLC .
Fidelity Covington Trust - Fidelity MSCI Industrials Index ETF (ARCA:FIDU) Institutionell ägarstruktur visar institutioners och fonders nuvarande positioner i företaget, samt de senaste förändringarna i positionernas storlek. Större aktieägare kan vara enskilda investerare, fonder, hedgefonder eller institutioner. Bilaga 13D visar att investeraren äger (eller ägde) mer än 5% av företaget och avser (eller avsåg) att aktivt eftersträva en förändring av affärsstrategin. Schedule 13G indikerar en passiv investering på över 5%.
The share price as of September 12, 2025 is 80,47 / share. Previously, on September 13, 2024, the share price was 69,58 / share. This represents an increase of 15,65% over that period.
Fondsentimentets poäng
Fondsentimentet poängen(fka Ägarackumulation-poäng) visar vilka aktier som är mest köpta av fonder. Det är resultatet av en sofistikerad kvantitativ flerfaktormodell som identifierar företag med de högsta nivåerna av institutionell ackumulering. Poängsättningsmodellen använder en kombination av den totala ökningen av redovisade ägare, förändringarna i portföljallokeringarna för dessa ägare och andra mått. Siffran sträcker sig från 0 till 100, där högre siffror indikerar en högre nivå av ackumulering i förhållande till sina konkurrenter, och 50 är genomsnittet.
Uppdateringsfrekvens: Dagligen
Se Ownership Explorer, som innehåller en lista över de högst rankade företagen.
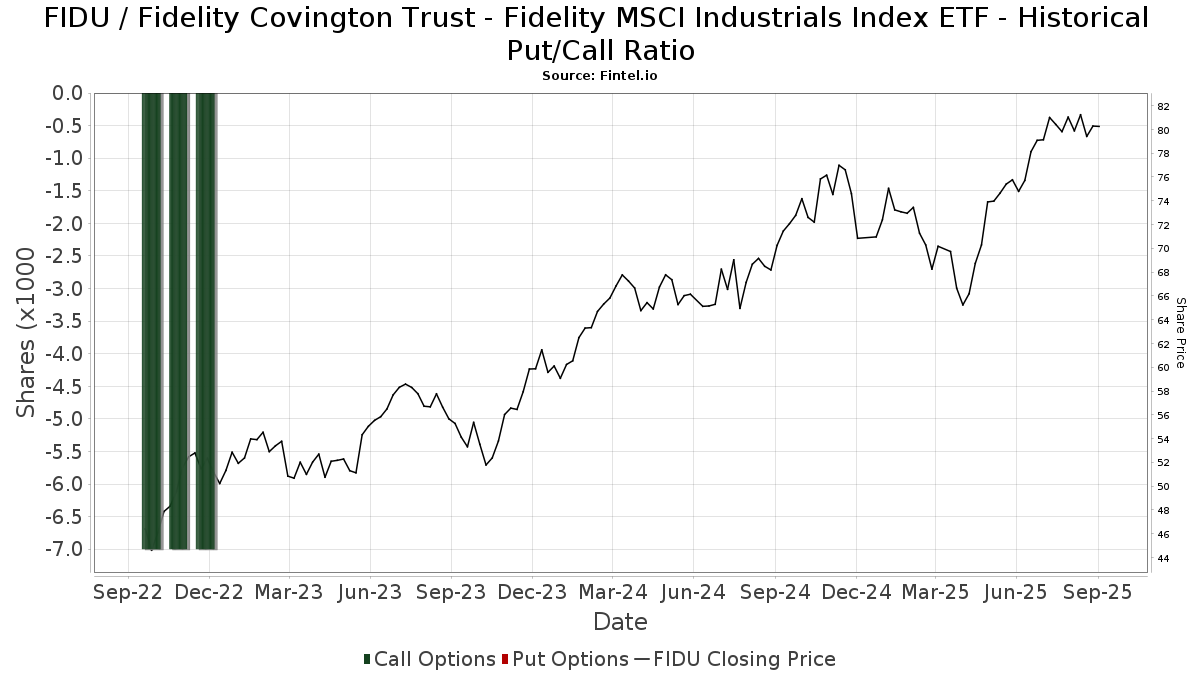
Institutionell sälj/köp-kvot
Förutom att rapportera vanliga eget kapital- och skuldemissioner måste institutioner med mer än 100MM tillgångar under förvaltning också avslöja sina innehav av sälj- och köpoptioner. Eftersom säljoptioner i allmänhet indikerar ett negativt sentiment och köpoptioner indikerar ett positivt sentiment, kan vi få en uppfattning om det övergripande institutionella sentimentet genom att plotta förhållandet mellan säljoptioner och köpoptioner. Diagrammet till höger visar det historiska förhållandet mellan sälj- och köpoptioner för detta instrument.
Genom att använda sälj/köp-kvoten som en indikator på aktieägarnas sentiment undviker man en av de största bristerna med att använda det totala institutionella ägandet, nämligen att en betydande del av de förvaltade tillgångarna investeras passivt för att följa index. Passivt förvaltade fonder köper vanligtvis inte optioner, så indikatorn för sälj/köp-kvoten ger en bättre bild av stämningen i aktivt förvaltade fonder.
13F- och NPORT-arkiveringar
Detaljer om 13F-arkiveringar är gratis. Detaljer om NP-arkiveringar kräver ett premiummedlemskap. Gröna rader indikerar nya positioner. Röda rader indikerar stängda positioner. Klicka på länk symbolen för att se hela transaktionshistoriken.
Uppgradera
för att låsa upp premiumdata och exportera till Excel ![]() .
.
| Fil Datum | Källa | Investerare | Typ | Genomsnittligt pris (beräknat) |
Aktier | Δ Aktier (%) |
Rapporterat värde (1000 USD) |
Δ Värde (%) |
Portföljallokering (%) |
|
|---|---|---|---|---|---|---|---|---|---|---|
| 2025-07-17 | 13F | Janney Montgomery Scott LLC | 4 170 | 0,24 | 0 | |||||
| 2025-08-29 | 13F | Centaurus Financial, Inc. | 6 577 | −5,30 | 1 | |||||
| 2025-08-14 | 13F | Full Sail Capital, LLC | 146 950 | 6,16 | 11 393 | 20,19 | ||||
| 2025-08-14 | 13F | Susquehanna International Group, Llp | 0 | −100,00 | 0 | |||||
| 2025-08-15 | 13F | Kestra Advisory Services, LLC | 75 899 | 1,28 | 5 884 | 14,68 | ||||
| 2025-08-14 | 13F | Snowden Capital Advisors LLC | 15 045 | −4,18 | 1 166 | 8,47 | ||||
| 2025-08-04 | 13F | Creative Financial Designs Inc /adv | 633 | 0,00 | 49 | 13,95 | ||||
| 2025-08-08 | 13F | Capital Investment Advisory Services, LLC | 262 | 0,00 | 20 | 17,65 | ||||
| 2025-08-12 | 13F | Integrated Advisors Network LLC | 6 955 | −38,78 | 539 | −30,63 | ||||
| 2025-08-13 | 13F | Rsm Us Wealth Management Llc | 2 757 | 214 | ||||||
| 2025-08-07 | 13F | Kestra Private Wealth Services, Llc | 30 012 | 3,55 | 2 327 | 17,24 | ||||
| 2025-08-08 | 13F | IMA Wealth, Inc. | 33 | 0,00 | 3 | 0,00 | ||||
| 2025-08-14 | 13F | Stifel Financial Corp | 70 451 | 0,17 | 5 462 | 13,44 | ||||
| 2025-07-22 | 13F | Valley National Advisers Inc | 0 | −100,00 | 0 | |||||
| 2025-08-01 | 13F | Envestnet Asset Management Inc | 66 869 | 48,69 | 5 184 | 68,37 | ||||
| 2025-07-21 | 13F | Ameritas Advisory Services, LLC | 7 099 | −14,14 | 550 | −3,00 | ||||
| 2025-08-05 | 13F | Simplex Trading, Llc | 484 | 63,51 | 0 | |||||
| 2025-07-02 | 13F | Crumly & Associates Inc. | 4 175 | 0,00 | 324 | 13,33 | ||||
| 2025-08-05 | 13F | Smith Shellnut Wilson Llc /adv | 14 677 | −1,10 | 1 138 | 11,91 | ||||
| 2025-08-12 | 13F | Atlas Capital Advisors Llc | 37 608 | −1,24 | 2 916 | 11,81 | ||||
| 2025-08-14 | 13F | Jane Street Group, Llc | 0 | −100,00 | 0 | |||||
| 2025-08-14 | 13F | Goldman Sachs Group Inc | 0 | −100,00 | 0 | |||||
| 2025-07-17 | 13F | Wolff Wiese Magana Llc | 25 | 0,00 | 2 | 0,00 | ||||
| 2025-08-12 | 13F | Proequities, Inc. | 0 | 0 | ||||||
| 2025-08-13 | 13F | SCS Capital Management LLC | 7 955 | 0,00 | 617 | 13,24 | ||||
| 2025-07-14 | 13F | Ridgewood Investments LLC | 132 | 0,00 | 10 | 11,11 | ||||
| 2025-07-16 | 13F | Fischer Financial Services, Inc. | 59 351 | 0,40 | 4 601 | 13,69 | ||||
| 2025-08-14 | 13F | Mercer Global Advisors Inc /adv | 2 734 | 212 | ||||||
| 2025-05-01 | 13F | Grant/GrossMendelsohn, LLC | 0 | −100,00 | 0 | |||||
| 2025-08-07 | 13F | Fidelis Capital Partners, LLC | 2 669 | 213 | ||||||
| 2025-07-28 | 13F | Mutual Advisors, LLC | 17 759 | 0,51 | 1 454 | 21,39 | ||||
| 2025-05-15 | 13F/A | Orion Portfolio Solutions, LLC | 6 130 | 22,75 | 420 | 19,37 | ||||
| 2025-08-04 | 13F | Pensionmark Financial Group, Llc | 3 502 | 0,00 | 272 | 13,39 | ||||
| 2025-08-11 | 13F | TD Waterhouse Canada Inc. | 0 | −100,00 | 0 | |||||
| 2025-07-25 | 13F | We Are One Seven, LLC | 10 762 | −2,18 | 834 | 10,76 | ||||
| 2025-08-08 | 13F | Pnc Financial Services Group, Inc. | 378 | 51,20 | 29 | 70,59 | ||||
| 2025-08-11 | 13F | Mach-1 Financial Group, Inc. | 0 | −100,00 | 0 | |||||
| 2025-08-14 | 13F | Sunbelt Securities, Inc. | 22 244 | 47,97 | 1 564 | 51,90 | ||||
| 2025-08-12 | 13F | Jpmorgan Chase & Co | 944 | 1 866,67 | 73 | 2 333,33 | ||||
| 2025-04-21 | 13F | Nelson, Van Denburg & Campbell Wealth Management Group, LLC | 0 | −100,00 | 0 | |||||
| 2025-07-30 | 13F | Brookstone Capital Management | 3 467 | −7,32 | 269 | 4,69 | ||||
| 2025-07-22 | 13F | Yoder Wealth Management, Inc. | 69 564 | 6,91 | 5 393 | 21,05 | ||||
| 2025-08-12 | 13F | Steward Partners Investment Advisory, Llc | 2 124 | 165 | ||||||
| 2025-07-17 | 13F | CWA Asset Management Group, LLC | 5 046 | 0,02 | 391 | 13,33 | ||||
| 2025-07-29 | 13F | Harbor Asset Planning, Inc. | 2 678 | 208 | ||||||
| 2025-05-13 | 13F | Coston, McIsaac & Partners | 0 | −100,00 | 0 | |||||
| 2025-07-29 | 13F | AssuredPartners Investment Advisors, LLC | 3 424 | −25,77 | 265 | −15,87 | ||||
| 2025-08-14 | 13F | GWM Advisors LLC | 90 793 | −2,21 | 7 039 | 10,73 | ||||
| 2025-04-24 | 13F | HighMark Wealth Management LLC | 0 | −100,00 | 0 | |||||
| 2025-04-21 | 13F | Ronald Blue Trust, Inc. | 0 | −100,00 | 0 | −100,00 | ||||
| 2025-07-16 | 13F | Signature Resources Capital Management, LLC | 554 | 43 | ||||||
| 2025-07-30 | 13F | Gables Capital Management Inc. | 245 | 0,00 | 19 | 12,50 | ||||
| 2025-08-13 | 13F | KDK Private Wealth Management, LLC | 26 637 | −1,05 | 2 065 | 12,05 | ||||
| 2025-07-31 | 13F | Cambridge Investment Research Advisors, Inc. | 17 980 | −5,53 | 1 | 0,00 | ||||
| 2025-08-01 | 13F | Penobscot Wealth Management | 29 376 | 9,18 | 2 278 | 23,62 | ||||
| 2025-08-06 | 13F | AE Wealth Management LLC | 934 788 | 1,13 | 72 474 | 14,51 | ||||
| 2025-08-06 | 13F | Agf Management Ltd | 287 911 | 1,50 | 22 322 | 14,93 | ||||
| 2025-08-12 | 13F | SRS Capital Advisors, Inc. | 417 | 317,00 | 32 | 433,33 | ||||
| 2025-08-08 | 13F | Cetera Investment Advisers | 33 859 | 2,19 | 2 625 | 15,74 | ||||
| 2025-07-30 | 13F | Evermay Wealth Management Llc | 12 | 0,00 | 1 | |||||
| 2025-08-12 | 13F | Armor Investment Advisors, LLC | 43 102 | −1,29 | 3 342 | 11,78 | ||||
| 2025-08-12 | 13F | O'shaughnessy Asset Management, Llc | 19 888 | 22,64 | 1 542 | 38,83 | ||||
| 2025-08-08 | 13F | Meridian Wealth Management, LLC | 10 436 | −4,18 | 809 | 8,59 | ||||
| 2025-08-13 | 13F | River Wealth Advisors LLC | 2 715 | 210 | ||||||
| 2025-07-22 | 13F | Fortitude Advisory Group L.L.C. | 3 122 | 242 | ||||||
| 2025-08-13 | 13F | Jones Financial Companies Lllp | 8 633 | 22,98 | 667 | 39,54 | ||||
| 2025-05-02 | 13F | Capital A Wealth Management, LLC | 83 | 260,87 | 6 | 400,00 | ||||
| 2025-08-07 | 13F | Allworth Financial LP | 31 | 0,00 | 2 | 0,00 | ||||
| 2025-08-05 | 13F | Sigma Planning Corp | 4 000 | −0,67 | 310 | 12,73 | ||||
| 2025-07-25 | 13F | Cwm, Llc | 578 | 0,00 | 0 | |||||
| 2025-07-02 | 13F | HBW Advisory Services LLC | 2 791 | 216 | ||||||
| 2025-07-30 | 13F | Retirement Planning Group | 4 797 | 372 | ||||||
| 2025-04-23 | 13F | Aspetuck Financial Management LLC | 0 | −100,00 | 0 | −100,00 | ||||
| 2025-07-31 | 13F | BIP Wealth, LLC | 3 225 | 0,28 | 250 | 13,64 | ||||
| 2025-08-14 | 13F | UBS Group AG | 13 136 | 220,23 | 1 018 | 263,57 | ||||
| 2025-08-14 | 13F | Fmr Llc | 66 058 | 10,71 | 5 122 | 25,36 | ||||
| 2025-08-14 | 13F | Wells Fargo & Company/mn | 111 840 | 100,91 | 8 671 | 127,50 | ||||
| 2025-08-14 | 13F | CoreCap Advisors, LLC | 2 057 | 60,08 | 159 | 82,76 | ||||
| 2025-07-28 | 13F | Harbour Investments, Inc. | 228 | 0,00 | 18 | 13,33 | ||||
| 2025-05-01 | 13F | Stephens Inc /ar/ | 0 | −100,00 | 0 | |||||
| 2025-08-07 | 13F | Montag A & Associates Inc | 11 434 | 2,63 | 886 | 16,27 | ||||
| 2025-08-05 | 13F | Dunhill Financial, LLC | 1 686 | 131 | ||||||
| 2025-04-29 | 13F | Element Wealth, LLC | 0 | −100,00 | 0 | |||||
| 2025-08-12 | 13F | CIBC Private Wealth Group, LLC | 1 | −97,50 | 0 | −100,00 | ||||
| 2025-07-15 | 13F | Missouri Trust & Investment Co | 300 | 0,00 | 23 | 15,00 | ||||
| 2025-08-14 | 13F | Kovitz Investment Group Partners, LLC | 98 860 | 231,92 | 7 665 | 275,87 | ||||
| 2025-08-19 | 13F | Advisory Services Network, LLC | 9 194 | −22,62 | 739 | −9,10 | ||||
| 2025-08-01 | 13F | Chilton Capital Management Llc | 100 | 0,00 | 8 | 16,67 | ||||
| 2025-07-09 | 13F | Tounjian Advisory Partners, Llc | 21 010 | −1,61 | 1 439 | −1,64 | ||||
| 2025-08-12 | 13F | Minot DeBlois Advisors LLC | 65 | 0,00 | 5 | 25,00 | ||||
| 2025-07-08 | 13F | Nbc Securities, Inc. | 140 | 0,00 | 0 | |||||
| 2025-08-13 | 13F | Summit Financial, LLC | 5 835 | −12,26 | 452 | −0,66 | ||||
| 2025-08-14 | 13F | Raymond James Financial Inc | 9 514 | 10,36 | 738 | 24,92 | ||||
| 2025-07-24 | 13F | IFP Advisors, Inc | 427 | −58,42 | 33 | −52,86 | ||||
| 2025-08-08 | NP | QALTX - Quantified Alternative Investment Fund Investor Class Shares | 3 536 | −49,03 | 274 | −43,74 | ||||
| 2025-07-21 | 13F | Hilltop National Bank | 390 | 0,00 | 30 | 11,11 | ||||
| 2025-08-26 | 13F/A | Thrivent Financial For Lutherans | 76 846 | −16,47 | 6 | −16,67 | ||||
| 2025-08-05 | 13F | Lifeworks Advisors, LLC | 46 413 | −10,44 | 3 598 | 1,41 | ||||
| 2025-07-18 | 13F | Truist Financial Corp | 20 209 | −5,86 | 1 567 | 6,60 | ||||
| 2025-07-25 | 13F | Atria Wealth Solutions, Inc. | 17 471 | −11,55 | 1 376 | 1,70 | ||||
| 2025-08-14 | 13F | Federation des caisses Desjardins du Quebec | 1 905 | 148 | ||||||
| 2025-07-17 | 13F | Fifth Third Securities, Inc. | 27 519 | 2,52 | 2 134 | 16,11 | ||||
| 2025-08-14 | 13F | Boston Private Wealth Llc | 2 962 | 230 | ||||||
| 2025-07-28 | 13F | Rosenberg Matthew Hamilton | 2 886 | 0,00 | 224 | 13,20 | ||||
| 2025-09-04 | 13F/A | Advisor Group Holdings, Inc. | 48 645 | −29,47 | 3 785 | −20,06 | ||||
| 2025-05-16 | 13F | Arete Wealth Advisors, LLC | 0 | −100,00 | 0 | |||||
| 2025-08-15 | 13F | Tower Research Capital LLC (TRC) | 19 | −99,89 | 1 | −99,91 | ||||
| 2025-08-05 | 13F | Advisors Preferred, LLC | 3 536 | 276 | ||||||
| 2025-07-23 | 13F | Monte Financial Group, LLC | 3 442 | −1,71 | 267 | 15,65 | ||||
| 2025-07-22 | 13F | Grimes & Company, Inc. | 4 078 | 316 | ||||||
| 2025-05-09 | 13F | Briaud Financial Planning, Inc | 0 | −100,00 | 0 | |||||
| 2025-04-10 | 13F | Secure Asset Management, LLC | 0 | −100,00 | 0 | −100,00 | ||||
| 2025-08-14 | 13F | Mml Investors Services, Llc | 16 810 | −76,17 | 1 | −75,00 | ||||
| 2025-07-14 | 13F | Buska Wealth Management, LLC | 97 427 | −26,74 | 7 554 | −17,05 | ||||
| 2025-06-30 | NP | Northern Lights Fund Trust - PFG Fidelity Institutional AM® Equity Sector Strategy Fund Class R Shares | 864 020 | 118,36 | 59 384 | 103,77 | ||||
| 2025-07-09 | 13F | Bank of New Hampshire | 108 | 0,00 | 8 | 14,29 | ||||
| 2025-08-08 | 13F | Larson Financial Group LLC | 4 131 | 0,29 | 320 | 13,48 | ||||
| 2025-08-13 | 13F | Level Four Advisory Services, Llc | 14 214 | −0,04 | 1 102 | 13,26 | ||||
| 2025-07-15 | 13F | Define Financial, Llc | 3 029 | 235 | ||||||
| 2025-07-22 | 13F | PUREfi Wealth, LLC | 5 395 | 0,00 | 418 | 13,28 | ||||
| 2025-08-11 | 13F | Aptus Capital Advisors, LLC | 59 | 0,00 | 5 | 0,00 | ||||
| 2025-07-07 | 13F | Nova Wealth Management, Inc. | 9 641 | −16,14 | 747 | −5,08 | ||||
| 2025-07-11 | 13F | Farther Finance Advisors, LLC | 9 | −68,97 | 1 | −100,00 | ||||
| 2025-07-25 | 13F | Valley Brook Capital Group, Inc. | 5 562 | 1,37 | 431 | 14,93 | ||||
| 2025-07-30 | 13F | Bogart Wealth, LLC | 2 295 | 0,00 | 178 | 12,74 | ||||
| 2025-08-11 | 13F | Kingdom Financial Group LLC. | 2 762 | 214 | ||||||
| 2025-07-15 | 13F | Lynch & Associates/in | 25 388 | 5,20 | 1 968 | 19,13 | ||||
| 2025-05-01 | 13F | Quest 10 Wealth Builders, Inc. | 20 | 1 | ||||||
| 2025-07-22 | 13F | One Wealth Management Investment & Advisory Services, LLC | 4 996 | −0,89 | 387 | 12,17 | ||||
| 2025-08-27 | 13F/A | Brinker Capital Investments, LLC | 7 120 | 16,15 | 552 | 31,74 | ||||
| 2025-04-23 | 13F | PMV Capital Advisers, LLC | 0 | −100,00 | 0 | |||||
| 2025-07-23 | 13F | Heck Capital Advisors, LLC | 12 109 | 1,91 | 939 | 15,38 | ||||
| 2025-07-31 | 13F | Sage Mountain Advisors LLC | 1 104 | 0,00 | 86 | 13,33 | ||||
| 2025-08-14 | 13F | Qube Research & Technologies Ltd | 120 | 9 | ||||||
| 2025-08-05 | 13F | Trail Ridge Investment Advisors, LLC | 15 185 | −4,15 | 1 221 | 12,64 | ||||
| 2025-07-24 | 13F | Us Bancorp \de\ | 851 | 66 | ||||||
| 2025-08-11 | 13F | HighTower Advisors, LLC | 138 329 | 75,40 | 10 725 | 98,63 | ||||
| 2025-08-13 | 13F | Whalerock Point Partners, Llc | 5 890 | 0,00 | 457 | 13,15 | ||||
| 2025-08-05 | 13F | EPG Wealth Management LLC | 30 506 | −0,74 | 2 365 | 12,40 | ||||
| 2025-08-12 | 13F | MAI Capital Management | 179 | 0,00 | 14 | 8,33 | ||||
| 2025-07-16 | 13F/A | CX Institutional | 545 | −16,54 | 0 | |||||
| 2025-07-18 | 13F | Vicus Capital | 0 | −100,00 | 0 | |||||
| 2025-08-01 | 13F | SYM FINANCIAL Corp | 365 | 28 | ||||||
| 2025-08-13 | 13F | Continuum Advisory, LLC | 8 231 | −3,44 | 638 | 9,43 | ||||
| 2025-08-14 | 13F | Bank Of America Corp /de/ | 107 444 | −11,33 | 8 330 | 0,41 | ||||
| 2025-08-12 | 13F | J.w. Cole Advisors, Inc. | 4 928 | 382 | ||||||
| 2025-08-14 | 13F | Modern Wealth Management, LLC | 52 981 | 6,39 | 4 108 | 20,48 | ||||
| 2025-08-14 | 13F | DecisionPoint Financial, LLC | 108 | 0,00 | 8 | 14,29 | ||||
| 2025-07-16 | 13F | Essex Financial Services, Inc. | 13 076 | 10,53 | 1 014 | 25,22 | ||||
| 2025-08-04 | 13F | Canton Hathaway, LLC | 2 300 | 0,00 | 0 | |||||
| 2025-08-21 | 13F | Pathway Financial Advisers, LLC | 3 821 | 6,20 | 296 | 20,33 | ||||
| 2025-07-07 | 13F | Trust Co Of Oklahoma | 15 690 | 2,37 | 1 216 | 15,92 | ||||
| 2025-08-14 | 13F | Hurley Capital, LLC | 2 017 | 0,05 | 156 | 13,04 | ||||
| 2025-08-01 | 13F | Bessemer Group Inc | 0 | −100,00 | 0 | |||||
| 2025-08-14 | 13F | Evergreen Wealth Solutions, LLC | 2 690 | 209 | ||||||
| 2025-07-30 | 13F | Princeton Global Asset Management LLC | 518 | 0,00 | 40 | 14,29 | ||||
| 2025-08-12 | 13F | Franklin Resources Inc | 0 | −100,00 | 0 | |||||
| 2025-08-25 | 13F/A | Promus Capital, LLC | 99 | 0,00 | 8 | 16,67 | ||||
| 2025-08-06 | 13F | Decker Retirement Planning Inc. | 434 | 0,00 | 34 | 13,79 | ||||
| 2025-08-08 | 13F | Creative Planning | 2 925 | 227 | ||||||
| 2025-09-03 | 13F | Q3 Asset Management | 5 161 | 0 | ||||||
| 2025-08-13 | 13F | Transce3nd, LLC | 312 | 24 | ||||||
| 2025-08-07 | 13F | Traynor Capital Management, Inc. | 60 427 | 0,62 | 4 708 | 14,52 | ||||
| 2025-08-14 | 13F | Glen Eagle Advisors, LLC | 116 | 0,00 | 9 | 14,29 | ||||
| 2025-08-08 | 13F | Independence Financial Advisors, LLC | 83 950 | −4,85 | 6 509 | 7,73 | ||||
| 2025-08-14 | 13F | IHT Wealth Management, LLC | 43 295 | 6,80 | 3 357 | 20,94 | ||||
| 2025-07-21 | 13F | DHJJ Financial Advisors, Ltd. | 67 | 48,89 | 5 | 66,67 | ||||
| 2025-08-12 | 13F | Global Retirement Partners, LLC | 1 554 | −0,45 | 120 | 10,09 | ||||
| 2025-07-28 | 13F | Kiker Wealth Management, LLC | 0 | −100,00 | 0 | |||||
| 2025-08-04 | 13F | Arkadios Wealth Advisors | 32 935 | −0,28 | 2 553 | 12,91 | ||||
| 2025-08-12 | 13F | PKS Advisory Services, LLC | 4 921 | −12,45 | 382 | −0,78 | ||||
| 2025-08-11 | 13F | Elite Financial, Inc. | 0 | −100,00 | 0 | |||||
| 2025-07-14 | 13F | U.S. Capital Wealth Advisors, LLC | 32 419 | 6,21 | 2 513 | 20,30 | ||||
| 2025-04-28 | 13F | Mainstream Capital Management LLC | 0 | −100,00 | 0 | |||||
| 2025-08-13 | 13F | Colonial Trust Co / SC | 559 | −18,87 | 43 | −8,51 | ||||
| 2025-07-07 | 13F | Roxbury Financial LLC | 14 660 | −1,33 | 1 137 | 6,57 | ||||
| 2025-08-11 | 13F | Beaumont Capital Management, LLC | 0 | −100,00 | 0 | |||||
| 2025-07-16 | 13F | American National Bank | 11 086 | 3,54 | 859 | 17,19 | ||||
| 2025-08-01 | 13F | Purkiss Capital Advisors LLC | 3 440 | 267 | ||||||
| 2025-08-13 | 13F | Townsquare Capital Llc | 0 | −100,00 | 0 | |||||
| 2025-07-08 | 13F | Parallel Advisors, LLC | 250 | 0,00 | 19 | 11,76 | ||||
| 2025-05-12 | 13F | Ameritas Investment Partners, Inc. | 0 | −100,00 | 0 | |||||
| 2025-08-06 | 13F | Stonebridge Financial Planning Group, LLC | 16 547 | 1,81 | 1 283 | 15,29 | ||||
| 2025-08-13 | 13F | Northwestern Mutual Wealth Management Co | 882 815 | 16,98 | 68 445 | 32,45 | ||||
| 2025-08-11 | 13F | Vista Cima Wealth Management LLC | 0 | −100,00 | 0 | −100,00 | ||||
| 2025-08-14 | 13F | Ausdal Financial Partners, Inc. | 3 935 | 0,28 | 305 | 13,81 | ||||
| 2025-08-05 | 13F | Bank Of Montreal /can/ | 500 | −54,83 | 39 | −49,33 | ||||
| 2025-07-10 | 13F | Selective Wealth Management, Inc. | 2 746 | 217 | ||||||
| 2025-07-29 | 13F | Primoris Wealth Advisors, Llc | 7 479 | −16,94 | 580 | −6,01 | ||||
| 2025-07-30 | 13F | IMG Wealth Management, Inc. | 29 | 2 | ||||||
| 2025-08-05 | 13F | Huntington National Bank | 4 | −50,00 | ||||||
| 2025-08-12 | 13F | Pathstone Holdings, LLC | 4 646 | −44,27 | 360 | −36,95 | ||||
| 2025-08-01 | 13F | Schmidt P J Investment Management Inc | 6 051 | −4,50 | 469 | 8,31 | ||||
| 2025-08-14 | 13F | Comerica Bank | 3 139 | 15,49 | 243 | 30,65 | ||||
| 2025-08-14 | 13F | Mariner, LLC | 15 473 | 11,58 | 1 200 | 26,34 | ||||
| 2025-08-14 | 13F | Citadel Advisors Llc | 0 | −100,00 | 0 | |||||
| 2025-08-13 | 13F | Lido Advisors, LLC | 1 704 467 | 7,93 | 132 147 | 22,21 | ||||
| 2025-08-14 | 13F | Integrated Wealth Concepts LLC | 4 552 | 21,87 | 353 | 38,04 | ||||
| 2025-08-08 | 13F | MTM Investment Management, LLC | 479 | 37 | ||||||
| 2025-08-14 | 13F | Redwood Financial Network Corp | 0 | −100,00 | 0 | |||||
| 2025-07-10 | 13F | Wealth Enhancement Advisory Services, Llc | 0 | −100,00 | 0 | |||||
| 2025-08-04 | 13F | Prairie Wealth Advisors, Inc. | 6 702 | 0,00 | 520 | 13,32 | ||||
| 2025-08-06 | 13F | Mcrae Capital Management Inc | 5 123 | 397 | ||||||
| 2025-07-15 | 13F | Elevated Capital Advisors, LLC | 18 282 | 0,00 | 1 252 | 0,00 | ||||
| 2025-08-13 | 13F | Congress Wealth Management LLC / DE / | 10 133 | −0,84 | 786 | 12,30 | ||||
| 2025-07-14 | 13F | UMA Financial Services, Inc. | 50 | 0,00 | 4 | 0,00 | ||||
| 2025-08-08 | 13F | Atlantic Trust, LLC | 63 | 0,00 | 5 | 0,00 | ||||
| 2025-08-14 | 13F | Diversify Advisory Services, LLC | 3 205 | −1,75 | 258 | 16,22 | ||||
| 2025-08-12 | 13F | Founders Financial Alliance, LLC | 0 | −100,00 | 0 | |||||
| 2025-08-07 | 13F | Ibex Wealth Advisors | 3 700 | 287 | ||||||
| 2025-07-17 | 13F | Smith, Salley & Associates | 30 934 | 0,50 | 2 398 | 13,81 | ||||
| 2025-07-21 | 13F | Exchange Capital Management, Inc. | 30 156 | −2,49 | 2 338 | 10,39 | ||||
| 2025-07-30 | 13F | VCI Wealth Management LLC | 21 379 | 6,64 | 1 657 | 20,77 | ||||
| 2025-07-07 | 13F | Versant Capital Management, Inc | 433 | 0,00 | 34 | 13,79 | ||||
| 2025-07-17 | 13F | Sound Income Strategies, LLC | 23 | 0,00 | 2 | 0,00 | ||||
| 2025-08-14 | 13F | Ameriprise Financial Inc | 102 212 | −18,62 | 7 931 | −7,78 | ||||
| 2025-08-06 | 13F | Maltin Wealth Management, Inc. | 7 287 | 1,50 | 565 | 14,87 | ||||
| 2025-07-16 | 13F | Beaumont Financial Advisors, LLC | 22 508 | −7,08 | 1 745 | 5,25 | ||||
| 2025-08-12 | 13F | LPL Financial LLC | 181 712 | 1,89 | 14 088 | 15,37 | ||||
| 2025-07-17 | 13F | Centennial Wealth Advisory LLC | 5 134 | −7,09 | 399 | 5,56 | ||||
| 2025-08-11 | 13F | Citigroup Inc | 13 146 | 21,97 | 1 019 | 38,26 | ||||
| 2025-08-14 | 13F | Royal Bank Of Canada | 111 285 | −8,79 | 8 628 | 3,28 | ||||
| 2025-08-11 | 13F | Principal Securities, Inc. | 2 177 | 31,94 | 169 | 44,83 | ||||
| 2025-08-15 | 13F | Morgan Stanley | 198 915 | −21,87 | 15 422 | −11,54 | ||||
| 2025-08-01 | 13F | Rossby Financial, LCC | 59 | 0,00 | 5 | 33,33 | ||||
| 2025-07-23 | 13F | Godsey & Gibb Associates | 761 | 48,92 | 59 | 73,53 | ||||
| 2025-08-06 | 13F | Commonwealth Equity Services, Llc | 327 871 | 19,42 | 25 | 38,89 |