Grundläggande statistik
| Institutionella ägare | 153 total, 152 long only, 0 short only, 1 long/short - change of 17,69% MRQ |
| Genomsnittlig portföljallokering | 0.6276 % - change of 71,20% MRQ |
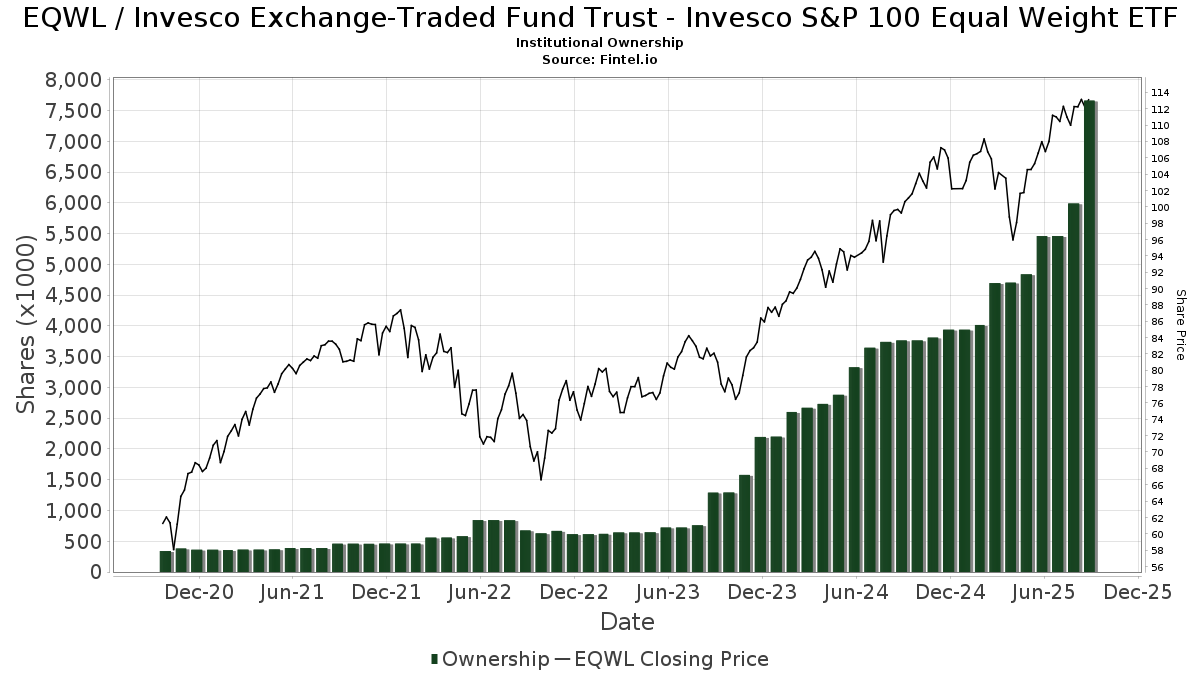
| Institutionella aktier (lång) | 7 662 802 (ex 13D/G) - change of 2,06MM shares 36,85% MRQ |
| Institutionellt värde (lång) | $ 784 840 USD ($1000) |
Institutionellt ägande och aktieägare
Invesco Exchange-Traded Fund Trust - Invesco S&P 100 Equal Weight ETF (US:EQWL) har 153 Institutionella ägare och aktieägare som har lämnat in 13D/G- eller 13F-formulär till Securities Exchange Commission (SEC). Dessa institut innehar totalt 7,662,802 aktier. Största aktieägare inkluderar LPL Financial LLC, Morgan Stanley, Cetera Investment Advisers, RFP Financial Group LLC, Ameriprise Financial Inc, Altus Wealth Management, LLC, Bond & Devick Financial Network, Inc., Bank Of America Corp /de/, Advisor Group Holdings, Inc., and Raymond James Financial Inc .
Invesco Exchange-Traded Fund Trust - Invesco S&P 100 Equal Weight ETF (ARCA:EQWL) Institutionell ägarstruktur visar institutioners och fonders nuvarande positioner i företaget, samt de senaste förändringarna i positionernas storlek. Större aktieägare kan vara enskilda investerare, fonder, hedgefonder eller institutioner. Bilaga 13D visar att investeraren äger (eller ägde) mer än 5% av företaget och avser (eller avsåg) att aktivt eftersträva en förändring av affärsstrategin. Schedule 13G indikerar en passiv investering på över 5%.
The share price as of September 8, 2025 is 112,40 / share. Previously, on September 9, 2024, the share price was 98,98 / share. This represents an increase of 13,56% over that period.
Fondsentimentets poäng
Fondsentimentet poängen(fka Ägarackumulation-poäng) visar vilka aktier som är mest köpta av fonder. Det är resultatet av en sofistikerad kvantitativ flerfaktormodell som identifierar företag med de högsta nivåerna av institutionell ackumulering. Poängsättningsmodellen använder en kombination av den totala ökningen av redovisade ägare, förändringarna i portföljallokeringarna för dessa ägare och andra mått. Siffran sträcker sig från 0 till 100, där högre siffror indikerar en högre nivå av ackumulering i förhållande till sina konkurrenter, och 50 är genomsnittet.
Uppdateringsfrekvens: Dagligen
Se Ownership Explorer, som innehåller en lista över de högst rankade företagen.
Institutionell sälj/köp-kvot
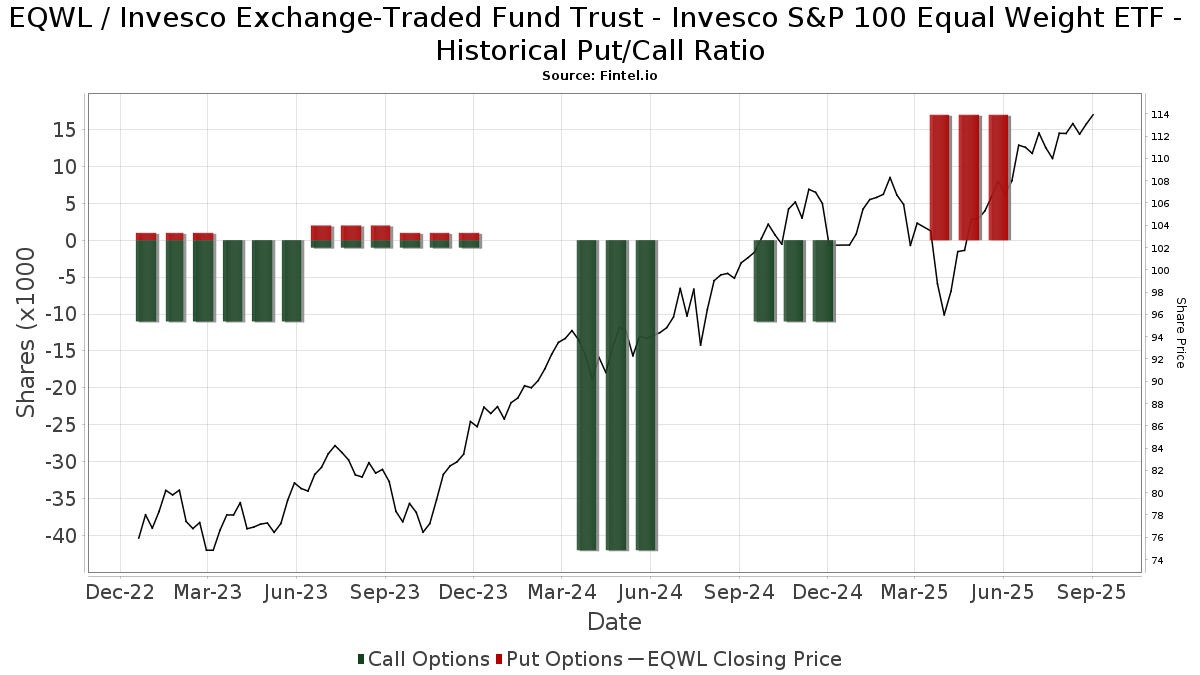
Förutom att rapportera vanliga eget kapital- och skuldemissioner måste institutioner med mer än 100MM tillgångar under förvaltning också avslöja sina innehav av sälj- och köpoptioner. Eftersom säljoptioner i allmänhet indikerar ett negativt sentiment och köpoptioner indikerar ett positivt sentiment, kan vi få en uppfattning om det övergripande institutionella sentimentet genom att plotta förhållandet mellan säljoptioner och köpoptioner. Diagrammet till höger visar det historiska förhållandet mellan sälj- och köpoptioner för detta instrument.
Genom att använda sälj/köp-kvoten som en indikator på aktieägarnas sentiment undviker man en av de största bristerna med att använda det totala institutionella ägandet, nämligen att en betydande del av de förvaltade tillgångarna investeras passivt för att följa index. Passivt förvaltade fonder köper vanligtvis inte optioner, så indikatorn för sälj/köp-kvoten ger en bättre bild av stämningen i aktivt förvaltade fonder.
13F- och NPORT-arkiveringar
Detaljer om 13F-arkiveringar är gratis. Detaljer om NP-arkiveringar kräver ett premiummedlemskap. Gröna rader indikerar nya positioner. Röda rader indikerar stängda positioner. Klicka på länk symbolen för att se hela transaktionshistoriken.
Uppgradera
för att låsa upp premiumdata och exportera till Excel ![]() .
.
| Fil Datum | Källa | Investerare | Typ | Genomsnittligt pris (beräknat) |
Aktier | Δ Aktier (%) |
Rapporterat värde (1000 USD) |
Δ Värde (%) |
Portföljallokering (%) |
|
|---|---|---|---|---|---|---|---|---|---|---|
| 2025-07-11 | 13F | Diversified Trust Co | 2 200 | 1,62 | 242 | 8,07 | ||||
| 2025-08-26 | NP | EVAGX - The E-Valuator Aggressive Growth (85%-99%) RMS Fund Service Class Shares | 34 018 | 3 741 | ||||||
| 2025-08-11 | 13F | Aptus Capital Advisors, LLC | 861 | 11,67 | 95 | 18,99 | ||||
| 2025-08-08 | 13F | Cetera Investment Advisers | 550 308 | 5,87 | 60 517 | 12,94 | ||||
| 2025-08-11 | 13F | Western Wealth Management, LLC | 1 871 | 206 | ||||||
| 2025-07-17 | 13F | Altus Wealth Management, LLC | 295 389 | 32 484 | ||||||
| 2025-08-26 | NP | EVMLX - The E-Valuator Moderate (50%-70%) RMS Fund Service Class Shares | 20 914 | 2 300 | ||||||
| 2025-08-12 | 13F | BlackRock, Inc. | 2 165 | 0,00 | 238 | 6,73 | ||||
| 2025-08-01 | 13F | Bessemer Group Inc | 0 | −100,00 | 0 | |||||
| 2025-08-13 | 13F | Allegheny Financial Group LTD | 7 276 | −11,11 | 800 | −5,10 | ||||
| 2025-07-18 | 13F | Precision Wealth Strategies, LLC | 8 610 | 947 | ||||||
| 2025-08-12 | 13F | PSI Advisors, LLC | 0 | −100,00 | 0 | |||||
| 2025-07-17 | 13F | Fifth Third Securities, Inc. | 35 783 | −1,50 | 3 935 | 5,07 | ||||
| 2025-08-06 | 13F | Valued Wealth Advisors LLC | 0 | −100,00 | 0 | |||||
| 2025-08-14 | 13F | Comerica Bank | 11 353 | −0,03 | 1 248 | 6,67 | ||||
| 2025-05-15 | 13F | Creative Planning | 0 | −100,00 | 0 | |||||
| 2025-07-17 | 13F | Michels Family Financial, LLC | 4 896 | 5,15 | 538 | 12,08 | ||||
| 2025-08-01 | 13F | First National Trust Co | 43 371 | 0,00 | 4 770 | 6,67 | ||||
| 2025-07-07 | 13F | Thurston, Springer, Miller, Herd & Titak, Inc. | 37 | 0,00 | 4 | 33,33 | ||||
| 2025-07-10 | 13F | Wealth Enhancement Advisory Services, Llc | 109 810 | 2,45 | 12 278 | 11,11 | ||||
| 2025-08-15 | 13F | Equitable Holdings, Inc. | 35 025 | 112,74 | 3 852 | 126,93 | ||||
| 2025-08-12 | 13F | O'shaughnessy Asset Management, Llc | 246 | 27 | ||||||
| 2025-07-24 | 13F | Blair William & Co/il | 400 | 0,00 | 44 | 4,88 | ||||
| 2025-07-15 | 13F | Signal Tree Financial Partners Llc | 2 710 | 0,00 | 298 | 6,81 | ||||
| 2025-05-14 | 13F | Napa Wealth Management | 0 | −100,00 | 0 | |||||
| 2025-08-14 | 13F | Sunbelt Securities, Inc. | 194 | −92,68 | 20 | −93,04 | ||||
| 2025-08-04 | 13F | Integrity Alliance, Llc. | 0 | −100,00 | 0 | |||||
| 2025-08-11 | 13F | Private Advisor Group, LLC | 166 540 | 19,27 | 18 315 | 27,23 | ||||
| 2025-08-06 | 13F | Founders Financial Securities Llc | 19 925 | 2 191 | ||||||
| 2025-07-22 | 13F | Siligmueller & Norvid Wealth Advisors LLC | 67 519 | 15,05 | 7 457 | 23,26 | ||||
| 2025-08-11 | 13F | Bradley Foster & Sargent Inc/ct | 1 996 | 0,00 | 220 | 6,83 | ||||
| 2025-07-31 | 13F | Glass Jacobson Investment Advisors llc | 3 536 | 274,58 | 389 | 304,17 | ||||
| 2025-08-12 | 13F | LPL Financial LLC | 1 087 139 | 18,45 | 119 553 | 26,35 | ||||
| 2025-08-15 | 13F | Morgan Stanley | 569 993 | 29,48 | 62 682 | 38,13 | ||||
| 2025-08-14 | 13F | Goldman Sachs Group Inc | 30 006 | 254,56 | 3 300 | 278,33 | ||||
| 2025-08-14 | 13F | CoreFirst Bank & Trust | 19 574 | 2,03 | 2 153 | 8,85 | ||||
| 2025-08-08 | 13F | Foundations Investment Advisors, LLC | 12 909 | 63,38 | 1 420 | 74,32 | ||||
| 2025-07-11 | 13F | Bond & Devick Financial Network, Inc. | 281 722 | 2,16 | 30 981 | 8,98 | ||||
| 2025-07-22 | 13F | Belpointe Asset Management LLC | 2 898 | 319 | ||||||
| 2025-08-13 | 13F | Twin Peaks Wealth Advisors, LLC | 34 | 4 | ||||||
| 2025-08-15 | 13F | Kestra Advisory Services, LLC | 122 472 | 1 013,18 | 13 468 | 1 087,65 | ||||
| 2025-07-22 | 13F | Merit Financial Group, LLC | 50 616 | 1,41 | 5 566 | 8,18 | ||||
| 2025-08-13 | 13F | Providence Capital Advisors, LLC | 111 | 12 | ||||||
| 2025-08-14 | 13F | Betterment LLC | 3 805 | 0 | ||||||
| 2025-08-04 | 13F | Spire Wealth Management | 705 | 23,25 | 78 | 32,76 | ||||
| 2025-07-11 | 13F | SILVER OAK SECURITIES, Inc | 4 396 | 4,52 | 483 | 12,59 | ||||
| 2025-08-12 | 13F | Ameritas Investment Partners, Inc. | 281 | 0,00 | 31 | 7,14 | ||||
| 2025-07-07 | 13F | Nova Wealth Management, Inc. | 487 | 83,08 | 54 | 96,30 | ||||
| 2025-07-21 | 13F | Ameritas Advisory Services, LLC | 1 052 | 116 | ||||||
| 2025-08-12 | 13F | Proequities, Inc. | 0 | 0 | ||||||
| 2025-08-14 | 13F | Beck Capital Management, Llc | 47 753 | −11,82 | 5 251 | −5,93 | ||||
| 2025-07-15 | 13F | CHB Investment Group, LLC | 22 966 | −0,03 | 3 | 0,00 | ||||
| 2025-08-04 | 13F | Arkadios Wealth Advisors | 10 930 | 217,18 | 1 202 | 238,31 | ||||
| 2025-08-14 | 13F | Foronjy Financial Llc | 21 138 | 2 325 | ||||||
| 2025-05-15 | 13F | National Wealth Management Group, LLC | 25 759 | 176,35 | 2 656 | 178,59 | ||||
| 2025-08-12 | 13F | J.w. Cole Advisors, Inc. | 7 464 | −0,48 | 821 | 6,08 | ||||
| 2025-07-24 | 13F | IFP Advisors, Inc | 1 040 | 0,00 | 114 | 6,54 | ||||
| 2025-07-25 | 13F | Cwm, Llc | 4 507 | 0,00 | 0 | |||||
| 2025-08-06 | 13F | Commonwealth Equity Services, Llc | 93 407 | 12,38 | 10 | 25,00 | ||||
| 2025-08-14 | 13F | CoreCap Advisors, LLC | 23 | 0,00 | 3 | 0,00 | ||||
| 2025-07-23 | 13F | Kingswood Wealth Advisors, Llc | 11 404 | −12,85 | 1 254 | −6,97 | ||||
| 2025-08-06 | 13F | Cm Wealth Advisors Llc | 105 982 | −6,66 | 11 655 | −0,44 | ||||
| 2025-05-15 | 13F | Citadel Advisors Llc | 0 | −100,00 | 0 | |||||
| 2025-08-14 | 13F | Fmr Llc | 2 732 | 5,52 | 300 | 12,78 | ||||
| 2025-08-14 | 13F | TCG Advisory Services, LLC | 5 602 | 25,58 | 616 | 34,20 | ||||
| 2025-08-13 | 13F | Northwestern Mutual Wealth Management Co | 84 316 | 143,70 | 9 272 | 160,01 | ||||
| 2025-07-24 | 13F | Jfs Wealth Advisors, Llc | 9 200 | 0,00 | 1 012 | 6,65 | ||||
| 2025-08-13 | 13F | First Trust Advisors Lp | 2 588 | 285 | ||||||
| 2025-08-13 | 13F | RFP Financial Group LLC | 471 667 | 51 869 | ||||||
| 2025-08-14 | 13F | Goodwin Investment Advisory | 11 858 | 1 304 | ||||||
| 2025-08-14 | 13F | GWM Advisors LLC | 3 585 | −12,18 | 394 | −6,19 | ||||
| 2025-08-14 | 13F | Bank Of America Corp /de/ | Put | 17 100 | 1 880 | |||||
| 2025-08-14 | 13F | Bank Of America Corp /de/ | 225 802 | 8,51 | 24 831 | 15,75 | ||||
| 2025-04-21 | 13F | Nelson, Van Denburg & Campbell Wealth Management Group, LLC | 0 | −100,00 | 0 | |||||
| 2025-08-11 | 13F | Principal Securities, Inc. | 96 369 | 120,91 | 10 598 | 137,55 | ||||
| 2025-08-08 | 13F | Tanglewood Legacy Advisors, LLC | 570 | 0,00 | 63 | 6,90 | ||||
| 2025-08-13 | 13F | Smith, Moore & Co. | 9 075 | 3,42 | 998 | 10,29 | ||||
| 2025-08-14 | 13F | Jane Street Group, Llc | 8 120 | 6,93 | 893 | 14,07 | ||||
| 2025-08-06 | 13F | AE Wealth Management LLC | 0 | −100,00 | 0 | |||||
| 2025-08-14 | 13F | Wells Fargo & Company/mn | 1 751 | 87 450,00 | 193 | |||||
| 2025-09-04 | 13F/A | Advisor Group Holdings, Inc. | 221 794 | −5,99 | 24 395 | 0,28 | ||||
| 2025-08-14 | 13F | Avant Capital LLC | 3 675 | 14,56 | 404 | 22,42 | ||||
| 2025-08-14 | 13F | Susquehanna International Group, Llp | 13 833 | 8,38 | 1 521 | 15,67 | ||||
| 2025-07-11 | 13F | Farther Finance Advisors, LLC | 570 | 0,00 | 63 | 6,90 | ||||
| 2025-07-31 | 13F | Cambridge Investment Research Advisors, Inc. | 148 689 | 28,58 | 16 | 45,45 | ||||
| 2025-08-14 | 13F | Federation des caisses Desjardins du Quebec | 50 | 0,00 | 5 | 0,00 | ||||
| 2025-07-25 | 13F | Atria Wealth Solutions, Inc. | 26 547 | 4,45 | 2 949 | 12,56 | ||||
| 2025-08-14 | 13F | Great Valley Advisor Group, Inc. | 9 117 | 1 003 | ||||||
| 2025-08-12 | 13F | Wood Tarver Financial Group, LLC | 448 | 0,00 | 0 | −100,00 | ||||
| 2025-08-14 | 13F | Mml Investors Services, Llc | 8 660 | −3,19 | 1 | |||||
| 2025-07-22 | 13F | Steele Capital Management, Inc. | 27 418 | 22,95 | 3 015 | 31,14 | ||||
| 2025-03-18 | 13F/A | Bank Of America Corp /de/ | Call | 0 | −100,00 | 0 | −100,00 | |||
| 2025-08-07 | 13F | Vista Investment Partners Ii, Llc | 16 840 | 235,99 | 1 852 | 258,72 | ||||
| 2025-08-14 | 13F | Royal Bank Of Canada | 50 655 | 8,95 | 5 571 | 16,23 | ||||
| 2025-07-31 | 13F | Orion Capital Management LLC | 2 770 | 0,00 | 305 | 6,67 | ||||
| 2025-08-14 | 13F | Raymond James Financial Inc | 174 000 | 24,31 | 19 135 | 32,60 | ||||
| 2025-08-26 | NP | EVTTX - The E-Valuator Conservative/Moderate (30%-50%) RMS Fund Service Class Shares | 2 375 | 261 | ||||||
| 2025-07-29 | 13F | Chicago Partners Investment Group LLC | 3 371 | 378 | ||||||
| 2025-07-14 | 13F | Park Avenue Securities Llc | 15 695 | 1,26 | 2 | 0,00 | ||||
| 2025-07-30 | 13F | D.a. Davidson & Co. | 3 533 | −37,31 | 389 | −33,22 | ||||
| 2025-07-30 | 13F | Brookstone Capital Management | 0 | −100,00 | 0 | |||||
| 2025-07-08 | 13F | Parallel Advisors, LLC | 1 672 | 184 | ||||||
| 2025-08-13 | 13F | Balanced Wealth Group Llc | 5 939 | 0,41 | 652 | 7,06 | ||||
| 2025-07-11 | 13F | Seacrest Wealth Management, Llc | 5 435 | 0,09 | 598 | 6,80 | ||||
| 2025-08-05 | 13F | Sigma Planning Corp | 0 | −100,00 | 0 | |||||
| 2025-08-14 | 13F | Mariner, LLC | 4 307 | 25,13 | 474 | 33,62 | ||||
| 2025-07-24 | 13F | Us Bancorp \de\ | 4 634 | 274,01 | 510 | 300,79 | ||||
| 2025-07-29 | 13F | Harbor Asset Planning, Inc. | 1 629 | 179 | ||||||
| 2025-08-19 | 13F | Advisory Services Network, LLC | 31 289 | −64,80 | 3 435 | −62,52 | ||||
| 2025-08-26 | NP | EVVLX - The E-Valuator Very Conservative (0%-15%) RMS Fund Service Class Shares | 816 | 90 | ||||||
| 2025-08-11 | 13F | Nations Financial Group Inc, /ia/ /adv | 8 075 | 1,74 | 888 | 8,56 | ||||
| 2025-08-06 | 13F | Columbia River Financial Group, LLC | 39 763 | −3,23 | 4 | 0,00 | ||||
| 2025-08-07 | 13F | Winthrop Capital Management, LLC | 8 498 | −20,39 | 1 | −100,00 | ||||
| 2025-08-04 | 13F | Creative Financial Designs Inc /adv | 15 763 | 20,70 | 1 733 | 28,75 | ||||
| 2025-08-14 | 13F | UBS Group AG | 56 110 | 38,41 | 6 170 | 47,64 | ||||
| 2025-05-09 | 13F | Belvedere Trading LLC | Call | 0 | −100,00 | 0 | ||||
| 2025-07-11 | 13F | Ullmann Financial Group, Inc. | 4 069 | 0,22 | 448 | 6,94 | ||||
| 2025-05-28 | NP | TFAFX - Tactical Growth Allocation Fund Class I | 210 | 22 | ||||||
| 2025-08-08 | 13F | Pnc Financial Services Group, Inc. | 379 | 0,00 | 42 | 5,13 | ||||
| 2025-08-12 | 13F | Jpmorgan Chase & Co | 31 640 | 557,66 | 3 479 | 602,83 | ||||
| 2025-08-01 | 13F | Envestnet Asset Management Inc | 78 206 | 14,08 | 8 600 | 21,71 | ||||
| 2025-08-04 | 13F | Kovack Advisors, Inc. | 15 893 | 4,78 | 1 748 | 11,77 | ||||
| 2025-05-13 | 13F | Neuberger Berman Group LLC | 0 | −100,00 | 0 | |||||
| 2025-07-14 | 13F | AdvisorNet Financial, Inc | 535 | 0,00 | 59 | 5,45 | ||||
| 2025-08-13 | 13F | Beacon Pointe Advisors, LLC | 13 572 | 21,42 | 1 493 | 29,51 | ||||
| 2025-08-14 | 13F | Private Capital Management, LLC | 10 103 | 11,10 | 1 111 | 18,57 | ||||
| 2025-08-12 | 13F | Global Retirement Partners, LLC | 2 369 | 17,28 | 261 | 26,21 | ||||
| 2025-08-12 | 13F | MAI Capital Management | 1 441 | 0,00 | 158 | 6,76 | ||||
| 2025-08-05 | 13F | Atlas Private Wealth Advisors | 2 410 | 1,56 | 265 | 8,20 | ||||
| 2025-07-31 | 13F | Carnegie Capital Asset Management, LLC | 7 753 | −7,11 | 853 | 9,94 | ||||
| 2025-07-10 | 13F | Focus Financial Network, Inc. | 2 663 | −8,52 | 293 | −2,67 | ||||
| 2025-08-11 | 13F | Independent Advisor Alliance | 2 516 | 277 | ||||||
| 2025-07-31 | 13F | Prentice Wealth Management LLC | 135 020 | 8,42 | 14 848 | 15,66 | ||||
| 2025-08-14 | 13F | EP Wealth Advisors, Inc. | 4 125 | 175,92 | 454 | 194,16 | ||||
| 2025-07-16 | 13F | RWM Asset Management, LLC | 2 811 | 0,00 | 309 | 6,92 | ||||
| 2025-08-11 | 13F | Advisor Resource Council | 2 516 | 277 | ||||||
| 2025-08-13 | 13F | Jones Financial Companies Lllp | 143 913 | 35,19 | 15 758 | 44,89 | ||||
| 2025-07-28 | 13F | Frazier Financial Advisors, LLC | 433 | 0,00 | 48 | 6,82 | ||||
| 2025-08-08 | 13F | Kingsview Wealth Management, LLC | 2 770 | −3,05 | 305 | 3,40 | ||||
| 2025-08-14 | 13F | Qube Research & Technologies Ltd | 0 | −100,00 | 0 | |||||
| 2025-08-07 | 13F | PCG Wealth Advisors, LLC | 0 | −100,00 | 0 | |||||
| 2025-08-08 | 13F | Avantax Advisory Services, Inc. | 169 949 | 17,27 | 18 689 | 25,10 | ||||
| 2025-08-14 | 13F | CIBC World Markets Inc. | 1 971 | 217 | ||||||
| 2025-08-13 | 13F | StoneX Group Inc. | 5 512 | 32,82 | 606 | 41,92 | ||||
| 2025-07-18 | 13F | Forza Wealth Management, LLC | 4 352 | 479 | ||||||
| 2025-07-29 | 13F | Signature Estate & Investment Advisors Llc | 29 462 | 13,18 | 3 240 | 20,72 | ||||
| 2025-07-29 | 13F | Stratos Wealth Partners, LTD. | 10 310 | 319,62 | 1 134 | 347,83 | ||||
| 2025-08-15 | 13F | Blue Chip Partners, Inc. | 3 605 | −8,71 | 396 | −2,70 | ||||
| 2025-07-30 | 13F | Fiduciary Planning LLC | 140 513 | −10,96 | 15 452 | −5,02 | ||||
| 2025-08-14 | 13F | Stifel Financial Corp | 3 491 | 10,76 | 384 | 18,21 | ||||
| 2025-08-05 | 13F | Simplex Trading, Llc | 66 | 6 500,00 | 0 | |||||
| 2025-08-14 | 13F/A | Rockefeller Capital Management L.P. | 12 489 | 1 374 | ||||||
| 2025-07-29 | 13F | FLC Capital Advisors | 2 800 | 0,00 | 308 | 6,60 | ||||
| 2025-07-18 | 13F | Truist Financial Corp | 64 082 | 23,49 | 7 047 | 31,74 | ||||
| 2025-07-29 | 13F | Systelligence, LLC | 109 910 | 12 087 | ||||||
| 2025-07-31 | 13F | Brighton Jones Llc | 2 629 | 289 | ||||||
| 2025-08-26 | NP | EVGLX - The E-Valuator Growth (70%-85%) RMS Fund Service Class Shares | 48 912 | 5 379 | ||||||
| 2025-08-14 | 13F | Ameriprise Financial Inc | 444 410 | 60,14 | 48 864 | 69,17 | ||||
| 2025-08-05 | 13F | GPS Wealth Strategies Group, LLC | 119 | −17,36 | 13 | −7,14 | ||||
| 2025-08-06 | 13F | Able Wealth Management LLC | 72 384 | 9,61 | 7 960 | 16,94 | ||||
| 2025-07-11 | 13F | Pinnacle Bancorp, Inc. | 766 | 0,00 | 84 | 7,69 | ||||
| 2025-07-18 | 13F | QTR Family Wealth, LLC | 5 580 | −1,85 | 614 | 4,61 | ||||
| 2025-07-17 | 13F | Janney Montgomery Scott LLC | 28 788 | 3 | ||||||
| 2025-07-28 | 13F | Harbour Investments, Inc. | 70 | −99,07 | 8 | −99,09 | ||||
| 2025-08-26 | NP | EVCLX - The E-Valuator Conservative (15%-30%) RMS Fund Service Class Shares | 2 875 | 316 | ||||||
| 2025-07-30 | 13F | Sanders Morris Harris Llc | 0 | −100,00 | 0 | |||||
| 2025-08-08 | 13F | Thoroughbred Financial Services, Llc | 5 199 | 42,32 | 1 | |||||
| 2025-08-14 | 13F | Graney & King, LLC | 1 389 | −1,07 | 153 | 5,56 | ||||
| 2025-08-07 | 13F | Cahill Financial Advisors Inc | 3 186 | 0,06 | 350 | 6,71 | ||||
| 2025-08-11 | 13F | Highview Capital Management LLC/DE/ | 61 533 | 68,08 | 6 767 | 79,28 | ||||
| 2025-08-26 | 13F/A | Thrivent Financial For Lutherans | 145 395 | 16 | ||||||
| 2025-08-18 | 13F/A | National Bank Of Canada /fi/ | 977 | 1 121,25 | 108 | 1 237,50 |