Grundläggande statistik
| Institutionella ägare | 155 total, 155 long only, 0 short only, 0 long/short - change of 3,33% MRQ |
| Genomsnittlig portföljallokering | 0.3735 % - change of 7,97% MRQ |
| Institutionella aktier (lång) | 12 531 110 (ex 13D/G) - change of −0,27MM shares −2,07% MRQ |
| Institutionellt värde (lång) | $ 794 587 USD ($1000) |
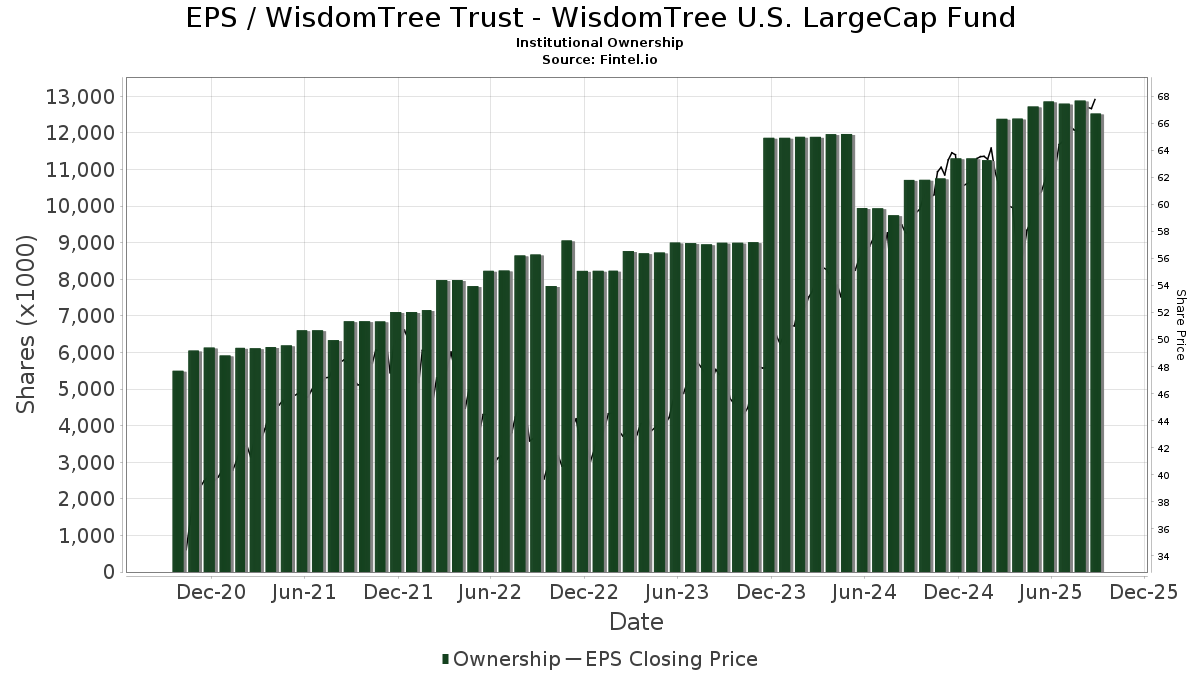
Institutionellt ägande och aktieägare
WisdomTree Trust - WisdomTree U.S. LargeCap Fund (US:EPS) har 155 Institutionella ägare och aktieägare som har lämnat in 13D/G- eller 13F-formulär till Securities Exchange Commission (SEC). Dessa institut innehar totalt 12,531,110 aktier. Största aktieägare inkluderar Fiduciary Trust Co, LPL Financial LLC, Private Advisor Group, LLC, Morgan Stanley, Lido Advisors, LLC, Garrett Wealth Advisory Group, LLC, Team Financial Group, LLC, Cetera Investment Advisers, Financial Gravity Companies, Inc., and Ieq Capital, Llc .
WisdomTree Trust - WisdomTree U.S. LargeCap Fund (ARCA:EPS) Institutionell ägarstruktur visar institutioners och fonders nuvarande positioner i företaget, samt de senaste förändringarna i positionernas storlek. Större aktieägare kan vara enskilda investerare, fonder, hedgefonder eller institutioner. Bilaga 13D visar att investeraren äger (eller ägde) mer än 5% av företaget och avser (eller avsåg) att aktivt eftersträva en förändring av affärsstrategin. Schedule 13G indikerar en passiv investering på över 5%.
The share price as of September 10, 2025 is 67,76 / share. Previously, on September 11, 2024, the share price was 57,76 / share. This represents an increase of 17,31% over that period.
Fondsentimentets poäng
Fondsentimentet poängen(fka Ägarackumulation-poäng) visar vilka aktier som är mest köpta av fonder. Det är resultatet av en sofistikerad kvantitativ flerfaktormodell som identifierar företag med de högsta nivåerna av institutionell ackumulering. Poängsättningsmodellen använder en kombination av den totala ökningen av redovisade ägare, förändringarna i portföljallokeringarna för dessa ägare och andra mått. Siffran sträcker sig från 0 till 100, där högre siffror indikerar en högre nivå av ackumulering i förhållande till sina konkurrenter, och 50 är genomsnittet.
Uppdateringsfrekvens: Dagligen
Se Ownership Explorer, som innehåller en lista över de högst rankade företagen.
Institutionell sälj/köp-kvot
Förutom att rapportera vanliga eget kapital- och skuldemissioner måste institutioner med mer än 100MM tillgångar under förvaltning också avslöja sina innehav av sälj- och köpoptioner. Eftersom säljoptioner i allmänhet indikerar ett negativt sentiment och köpoptioner indikerar ett positivt sentiment, kan vi få en uppfattning om det övergripande institutionella sentimentet genom att plotta förhållandet mellan säljoptioner och köpoptioner. Diagrammet till höger visar det historiska förhållandet mellan sälj- och köpoptioner för detta instrument.
Genom att använda sälj/köp-kvoten som en indikator på aktieägarnas sentiment undviker man en av de största bristerna med att använda det totala institutionella ägandet, nämligen att en betydande del av de förvaltade tillgångarna investeras passivt för att följa index. Passivt förvaltade fonder köper vanligtvis inte optioner, så indikatorn för sälj/köp-kvoten ger en bättre bild av stämningen i aktivt förvaltade fonder.
13F- och NPORT-arkiveringar
Detaljer om 13F-arkiveringar är gratis. Detaljer om NP-arkiveringar kräver ett premiummedlemskap. Gröna rader indikerar nya positioner. Röda rader indikerar stängda positioner. Klicka på länk symbolen för att se hela transaktionshistoriken.
Uppgradera
för att låsa upp premiumdata och exportera till Excel ![]() .
.
| Fil Datum | Källa | Investerare | Typ | Genomsnittligt pris (beräknat) |
Aktier | Δ Aktier (%) |
Rapporterat värde (1000 USD) |
Δ Värde (%) |
Portföljallokering (%) |
|
|---|---|---|---|---|---|---|---|---|---|---|
| 2025-07-23 | 13F | REAP Financial Group, LLC | 2 773 | −7,97 | 177 | −0,56 | ||||
| 2025-07-23 | 13F | Secured Retirement Advisors, Llc | 3 759 | −24,65 | 241 | −18,64 | ||||
| 2025-08-11 | 13F | Lowe Brockenbrough & Co Inc | 46 252 | 0,00 | 2 961 | 7,99 | ||||
| 2025-07-23 | 13F | Charter Trust Co | 5 721 | 0,00 | 366 | 7,96 | ||||
| 2025-07-29 | 13F | Chicago Partners Investment Group LLC | 26 237 | 0,21 | 1 725 | 12,38 | ||||
| 2025-08-14 | 13F | Quartz Partners, LLC | 10 425 | −0,32 | 667 | 7,75 | ||||
| 2025-07-22 | 13F | Old National Bancorp /in/ | 0 | −100,00 | 0 | |||||
| 2025-08-11 | 13F | Perennial Investment Advisors, LLC | 0 | −100,00 | 0 | |||||
| 2025-08-14 | 13F | Fort Point Capital Partners LLC | 4 810 | 3,89 | 308 | 12,04 | ||||
| 2025-08-05 | 13F | NewSquare Capital LLC | 69 955 | 7,12 | 4 478 | 15,65 | ||||
| 2025-07-10 | 13F | Wealth Enhancement Advisory Services, Llc | 24 615 | 2,44 | 1 599 | 12,22 | ||||
| 2025-07-25 | 13F | Envestnet Portfolio Solutions, Inc. | 0 | −100,00 | 0 | |||||
| 2025-07-22 | 13F | Berger Financial Group, Inc | 8 129 | −0,39 | 520 | 7,66 | ||||
| 2025-08-15 | 13F | Morgan Stanley | 934 478 | −5,27 | 59 816 | 2,29 | ||||
| 2025-08-12 | 13F | Steward Partners Investment Advisory, Llc | 12 514 | −2,20 | 801 | 5,67 | ||||
| 2025-05-14 | 13F | Portfolio Design Labs, LLC | 0 | −100,00 | 0 | |||||
| 2025-04-30 | 13F | Sofos Investments, Inc. | 260 707 | −0,94 | 15 455 | 3,67 | ||||
| 2025-07-25 | 13F | We Are One Seven, LLC | 4 728 | −20,30 | 303 | −13,96 | ||||
| 2025-08-14 | 13F | Smartleaf Asset Management LLC | 132 | 2,33 | 8 | 14,29 | ||||
| 2025-08-14 | 13F | UBS Group AG | 100 724 | −11,63 | 6 447 | −4,57 | ||||
| 2025-08-14 | 13F | Vista Investment Management | 82 899 | 0,90 | 5 306 | 8,95 | ||||
| 2025-08-12 | 13F | SRS Capital Advisors, Inc. | 61 | 4 | ||||||
| 2025-05-12 | 13F | Independent Advisor Alliance | 0 | −100,00 | 0 | |||||
| 2025-07-24 | 13F | Stonebridge Financial Group, LLC | 0 | −100,00 | 0 | |||||
| 2025-07-14 | 13F/A | Seek First Inc. | 10 956 | 0,37 | 701 | 8,35 | ||||
| 2025-08-11 | 13F | Covestor Ltd | 105 | 0,96 | 0 | |||||
| 2025-08-04 | 13F | Spire Wealth Management | 100 | 0,00 | 6 | 20,00 | ||||
| 2025-08-14 | 13F | Ieq Capital, Llc | 265 154 | 0,00 | 16 973 | 7,98 | ||||
| 2025-07-08 | 13F | Nbc Securities, Inc. | 6 797 | −8,30 | 0 | |||||
| 2025-08-13 | 13F | Lido Advisors, LLC | 869 660 | −3,78 | 55 667 | 3,89 | ||||
| 2025-08-13 | 13F | GM Advisory Group, Inc. | 17 414 | −16,59 | 1 115 | −9,94 | ||||
| 2025-08-05 | 13F | GPS Wealth Strategies Group, LLC | 1 375 | 0,00 | 88 | 8,64 | ||||
| 2025-08-06 | 13F | Walkner Condon Financial Advisors LLC | 4 249 | 0,00 | 272 | 7,97 | ||||
| 2025-08-12 | 13F | Garrett Wealth Advisory Group, LLC | 792 460 | 1,78 | 50 725 | 9,90 | ||||
| 2025-08-26 | NP | EVAGX - The E-Valuator Aggressive Growth (85%-99%) RMS Fund Service Class Shares | 26 464 | 1 694 | ||||||
| 2025-07-21 | 13F | Patriot Financial Group Insurance Agency, LLC | 17 066 | −9,69 | 1 092 | −2,50 | ||||
| 2025-08-08 | 13F | Cetera Investment Advisers | 445 451 | 5,27 | 28 513 | 13,67 | ||||
| 2025-08-12 | 13F | CIBC Private Wealth Group, LLC | 160 | 0,00 | 10 | 25,00 | ||||
| 2025-08-08 | 13F | Financial Gravity Companies, Inc. | 277 453 | 15,11 | 17 760 | 20,43 | ||||
| 2025-08-13 | 13F | Maia Wealth LLC | 41 934 | 94,91 | 2 684 | 120,36 | ||||
| 2025-08-07 | 13F | Rathbone Brothers plc | 10 790 | 0,00 | 691 | 7,98 | ||||
| 2025-08-12 | 13F | MAI Capital Management | 1 023 | 0,00 | 65 | 8,33 | ||||
| 2025-08-13 | 13F | Transce3nd, LLC | 268 | 0,00 | 17 | 13,33 | ||||
| 2025-07-07 | 13F | Thurston, Springer, Miller, Herd & Titak, Inc. | 480 | 0,42 | 31 | 7,14 | ||||
| 2025-07-29 | 13F | Swmg, Llc | 4 476 | 295 | ||||||
| 2025-08-04 | 13F | Atria Investments Llc | 9 209 | 29,03 | 589 | 39,24 | ||||
| 2025-07-15 | 13F | Mather Group, Llc. | 0 | −100,00 | 0 | |||||
| 2025-08-14 | 13F | Qube Research & Technologies Ltd | 124 | 0,00 | 8 | 0,00 | ||||
| 2025-08-15 | 13F | Equitable Holdings, Inc. | 14 333 | −19,59 | 917 | −13,16 | ||||
| 2025-08-04 | 13F | Integrity Alliance, Llc. | 146 613 | −73,95 | 9 385 | −71,87 | ||||
| 2025-07-08 | 13F | Melone Private Wealth, LLC | 9 001 | 0,01 | 574 | 7,50 | ||||
| 2025-08-12 | 13F | BlackRock, Inc. | 957 | 0,00 | 61 | 8,93 | ||||
| 2025-08-11 | 13F | Citigroup Inc | 22 806 | 76,39 | 1 460 | 90,47 | ||||
| 2025-07-11 | 13F/A | Umb Bank N A/mo | 3 517 | 0,00 | 225 | 8,17 | ||||
| 2025-07-28 | 13F | WealthPlan Investment Management, LLC | 28 537 | 1 827 | ||||||
| 2025-07-29 | 13F | Huntleigh Advisors, Inc. | 6 498 | −16,66 | 416 | −10,17 | ||||
| 2025-08-18 | 13F/A | Westwood Holdings Group Inc | 5 113 | 0,00 | 327 | 7,92 | ||||
| 2025-05-15 | 13F | Tower Research Capital LLC (TRC) | 0 | −100,00 | 0 | |||||
| 2025-07-15 | 13F | Optima Capital Llc | 5 182 | 0,33 | 332 | 8,17 | ||||
| 2025-08-01 | 13F | Advisory Alpha, LLC | 24 264 | −0,54 | 1 553 | 7,40 | ||||
| 2025-07-25 | 13F | NorthRock Partners, LLC | 2 531 | −2,05 | 162 | 5,88 | ||||
| 2025-08-14 | 13F | Win Advisors, Inc | 140 061 | 8 965 | ||||||
| 2025-08-13 | 13F | Kilter Group LLC | 7 227 | 3,48 | 463 | 11,59 | ||||
| 2025-08-14 | 13F | Citadel Advisors Llc | 29 955 | −49,46 | 1 917 | −45,43 | ||||
| 2025-07-31 | 13F | Cambridge Investment Research Advisors, Inc. | 3 777 | 6,07 | 0 | |||||
| 2025-08-12 | 13F | Global Retirement Partners, LLC | 21 110 | 19,47 | 1 351 | 24,98 | ||||
| 2025-07-10 | 13F | Kmg Fiduciary Partners, Llc | 27 144 | 5,23 | 1 737 | 13,60 | ||||
| 2025-08-13 | 13F | Capital Group Private Client Services, Inc. | 6 385 | −0,03 | 409 | 7,94 | ||||
| 2025-07-07 | 13F | Nova Wealth Management, Inc. | 3 605 | −26,77 | 231 | −20,96 | ||||
| 2025-07-29 | 13F | Private Trust Co Na | 0 | −100,00 | 0 | |||||
| 2025-08-14 | 13F | GWM Advisors LLC | 6 690 | 428 | ||||||
| 2025-08-11 | 13F | Advisor Resource Council | 7 317 | 468 | ||||||
| 2025-08-14 | 13F | Susquehanna International Group, Llp | 42 212 | 27,21 | 2 702 | 37,32 | ||||
| 2025-08-11 | 13F | Private Advisor Group, LLC | 1 058 176 | −1,56 | 67 734 | 6,29 | ||||
| 2025-04-16 | 13F | Defined Financial Planning LLC | 0 | −100,00 | 0 | |||||
| 2025-08-08 | 13F | Creative Planning | 93 914 | 0,00 | 6 011 | 7,98 | ||||
| 2025-04-14 | 13F | Baldwin Brothers Inc/ma | 0 | −100,00 | 0 | |||||
| 2025-08-07 | 13F | Flagship Wealth Advisors, Llc | 87 260 | 9,59 | 5 586 | 18,33 | ||||
| 2025-08-29 | 13F | Centaurus Financial, Inc. | 11 563 | 1 | ||||||
| 2025-07-18 | 13F | Parsons Capital Management Inc/ri | 9 437 | −4,98 | 604 | 2,72 | ||||
| 2025-07-22 | 13F | Marietta Wealth Management, LLC | 98 447 | 2,21 | 6 302 | 10,37 | ||||
| 2025-08-12 | 13F | Coldstream Capital Management Inc | 0 | −100,00 | 0 | |||||
| 2025-08-26 | NP | EVMLX - The E-Valuator Moderate (50%-70%) RMS Fund Service Class Shares | 23 947 | 1 533 | ||||||
| 2025-08-14 | 13F | Mml Investors Services, Llc | 4 057 | −92,23 | 0 | −100,00 | ||||
| 2025-07-30 | 13F | Paul Damon & Associates, Inc. | 10 000 | 0,00 | 640 | 8,11 | ||||
| 2025-08-07 | 13F | Parkside Financial Bank & Trust | 8 816 | 0,00 | 564 | 8,05 | ||||
| 2025-08-15 | 13F | Kestra Advisory Services, LLC | 240 188 | 8,62 | 15 374 | 17,29 | ||||
| 2025-08-07 | 13F | Efficient Advisors, LLC | 0 | −100,00 | 0 | |||||
| 2025-08-13 | 13F | M&t Bank Corp | 5 925 | 0,00 | 379 | 7,98 | ||||
| 2025-08-15 | 13F | CI Private Wealth, LLC | 7 394 | 100,00 | 473 | 115,98 | ||||
| 2025-08-11 | 13F | Principal Securities, Inc. | 286 | 0,00 | 18 | 5,88 | ||||
| 2025-08-18 | 13F | Geneos Wealth Management Inc. | 640 | 60,00 | 41 | 73,91 | ||||
| 2025-07-15 | 13F | Main Street Group, LTD | 50 | 0,00 | 3 | 50,00 | ||||
| 2025-04-28 | 13F | Actinver Wealth Management, Inc. | 0 | −100,00 | 0 | |||||
| 2025-05-08 | 13F | Armis Advisers, LLC | 0 | −100,00 | 0 | |||||
| 2025-08-07 | 13F | Allworth Financial LP | 1 882 | 0,05 | 120 | 11,11 | ||||
| 2025-08-14 | 13F | Royal Bank Of Canada | 26 160 | −0,67 | 1 675 | 7,30 | ||||
| 2025-08-04 | 13F | IFG Advisory, LLC | 5 811 | 0,00 | 372 | 7,85 | ||||
| 2025-08-05 | 13F | Advisors Preferred, LLC | 0 | −100,00 | 0 | |||||
| 2025-08-08 | 13F | Avantax Advisory Services, Inc. | 103 286 | −0,33 | 6 611 | 7,64 | ||||
| 2025-08-14 | 13F | Bank Of America Corp /de/ | 213 770 | −22,22 | 13 683 | −16,01 | ||||
| 2025-08-14 | 13F | Ancora Advisors, LLC | 835 | 0,00 | 53 | 8,16 | ||||
| 2025-08-26 | NP | EVTTX - The E-Valuator Conservative/Moderate (30%-50%) RMS Fund Service Class Shares | 3 824 | 245 | ||||||
| 2025-07-31 | 13F | Moloney Securities Asset Management, LLC | 74 018 | 7,42 | 4 738 | 15,99 | ||||
| 2025-08-12 | 13F | Proequities, Inc. | 0 | 0 | ||||||
| 2025-07-10 | 13F | Moller Financial Services | 3 730 | 0,00 | 239 | 7,69 | ||||
| 2025-08-04 | 13F | Creative Financial Designs Inc /adv | 994 | −15,40 | 64 | −8,70 | ||||
| 2025-07-14 | 13F | Park Avenue Securities Llc | 3 722 | 0 | ||||||
| 2025-07-25 | 13F | Concurrent Investment Advisors, LLC | 37 643 | −15,93 | 2 410 | −9,23 | ||||
| 2025-08-14 | 13F | Fmr Llc | 15 744 | −8,67 | 1 008 | −1,37 | ||||
| 2025-08-14 | 13F | Ameriprise Financial Inc | 10 508 | −0,57 | 673 | 7,35 | ||||
| 2025-08-14 | 13F | Kovitz Investment Group Partners, LLC | 139 475 | 0,02 | 8 925 | 7,96 | ||||
| 2025-08-04 | 13F | Arkadios Wealth Advisors | 13 678 | 2,01 | 876 | 10,20 | ||||
| 2025-07-09 | 13F | Beacon Financial Group | 45 957 | −0,08 | 2 942 | 7,89 | ||||
| 2025-08-08 | 13F | Bouchey Financial Group Ltd | 7 815 | 0,00 | 500 | 7,99 | ||||
| 2025-04-23 | 13F | Western Wealth Management, LLC | 0 | −100,00 | 0 | −100,00 | ||||
| 2025-08-01 | 13F | Envestnet Asset Management Inc | 12 446 | −79,99 | 797 | −78,41 | ||||
| 2025-08-12 | 13F | Jpmorgan Chase & Co | 138 096 | 4,61 | 8 840 | 12,96 | ||||
| 2025-08-26 | NP | EVVLX - The E-Valuator Very Conservative (0%-15%) RMS Fund Service Class Shares | 526 | 34 | ||||||
| 2025-07-30 | 13F | Insight Advisors, LLC/ PA | 0 | −100,00 | 0 | |||||
| 2025-08-12 | 13F | Founders Financial Alliance, LLC | 3 543 | 19,74 | 227 | 29,14 | ||||
| 2025-08-14 | 13F | Mariner, LLC | 0 | −100,00 | 0 | |||||
| 2025-08-14 | 13F | Herold Advisors, Inc. | 17 360 | 0,00 | 1 111 | 7,97 | ||||
| 2025-07-14 | 13F | E&G Advisors, LP | 7 225 | 0,84 | 462 | 8,96 | ||||
| 2025-07-22 | 13F | Beacon Financial Advisory LLC | 20 361 | −14,26 | 1 303 | −7,39 | ||||
| 2025-08-13 | 13F | Jones Financial Companies Lllp | 20 146 | 42,70 | 1 285 | 54,51 | ||||
| 2025-07-18 | 13F | Institute for Wealth Management, LLC. | 9 910 | 0,00 | 634 | 8,01 | ||||
| 2025-08-14 | 13F | Redwood Financial Network Corp | 7 191 | 0,00 | 460 | 7,98 | ||||
| 2025-08-14 | 13F | Stifel Financial Corp | 12 086 | −0,87 | 774 | 7,06 | ||||
| 2025-08-14 | 13F | Betterment LLC | 52 775 | 3,19 | 3 | 0,00 | ||||
| 2025-07-16 | 13F | ORG Partners LLC | 10 703 | −3,25 | 686 | 4,57 | ||||
| 2025-07-28 | 13F | Capital Management Corp /va | 3 225 | −5,84 | 206 | 1,48 | ||||
| 2025-08-14 | 13F | CoreCap Advisors, LLC | 4 648 | −2,02 | 298 | 5,69 | ||||
| 2025-08-06 | 13F | Modera Wealth Management, LLC | 35 094 | −0,28 | 2 246 | 7,67 | ||||
| 2025-08-06 | 13F | Commonwealth Equity Services, Llc | 6 754 | 0,16 | 0 | |||||
| 2025-07-15 | 13F | SJS Investment Consulting Inc. | 1 726 | 0,00 | 110 | 7,84 | ||||
| 2025-08-13 | 13F | First Trust Advisors Lp | 3 718 | 238 | ||||||
| 2025-07-08 | 13F | RMR Wealth Builders | 3 194 | 204 | ||||||
| 2025-08-12 | 13F | Cornerstone Wealth Management, LLC | 8 506 | 0,14 | 544 | 8,15 | ||||
| 2025-08-12 | 13F | LPL Financial LLC | 1 278 743 | 13,04 | 81 852 | 22,06 | ||||
| 2025-07-28 | 13F | Mutual Advisors, LLC | 4 050 | 267 | ||||||
| 2025-08-05 | 13F | C2P Capital Advisory Group, LLC d.b.a. Prosperity Capital Advisors | 28 020 | −2,16 | 1 794 | 5,47 | ||||
| 2025-05-13 | 13F | EPG Wealth Management LLC | 0 | −100,00 | 0 | −100,00 | ||||
| 2025-09-04 | 13F/A | Advisor Group Holdings, Inc. | 25 019 | 256,60 | 1 601 | 285,78 | ||||
| 2025-08-14 | 13F | Integrated Wealth Concepts LLC | 3 420 | −83,57 | 219 | −82,33 | ||||
| 2025-08-14 | 13F | Raymond James Financial Inc | 34 195 | 16,11 | 2 189 | 25,39 | ||||
| 2025-08-12 | 13F | PSI Advisors, LLC | 0 | −100,00 | 0 | |||||
| 2025-08-13 | 13F | Cerity Partners LLC | 4 645 | 0,00 | 297 | 8,00 | ||||
| 2025-08-14 | 13F | Wells Fargo & Company/mn | 81 040 | −0,75 | 5 187 | 7,17 | ||||
| 2025-07-29 | 13F | Systelligence, LLC | 111 186 | 7 117 | ||||||
| 2025-08-14 | 13F | Two Sigma Investments, Lp | 54 400 | 3 482 | ||||||
| 2025-07-29 | 13F | AssuredPartners Investment Advisors, LLC | 43 358 | −2,01 | 2 775 | 5,84 | ||||
| 2025-08-14 | 13F | Fiduciary Trust Co | 2 252 225 | −6,74 | 144 165 | 0,70 | ||||
| 2025-07-10 | 13F | Rockland Trust Co | 37 404 | −2,55 | 2 394 | 5,23 | ||||
| 2025-08-13 | 13F | Northwestern Mutual Wealth Management Co | 109 748 | 16,42 | 7 025 | 25,70 | ||||
| 2025-07-22 | 13F | IFS Advisors, LLC | 4 873 | −3,75 | 312 | 3,67 | ||||
| 2025-08-14 | 13F | Jane Street Group, Llc | 0 | −100,00 | 0 | |||||
| 2025-08-14 | 13F | Comerica Bank | 1 011 | 0,00 | 65 | 8,47 | ||||
| 2025-07-22 | 13F | Team Financial Group, LLC | 451 840 | 5,96 | 28 922 | 14,41 | ||||
| 2025-07-17 | 13F | Coastline Trust Co | 1 380 | 0,00 | 88 | 8,64 | ||||
| 2025-07-23 | 13F | Prime Capital Investment Advisors, LLC | 56 000 | −4,71 | 3 585 | 2,90 | ||||
| 2025-08-06 | 13F | AE Wealth Management LLC | 428 | 2 957,14 | 27 | |||||
| 2025-07-10 | 13F | Focus Financial Network, Inc. | 4 788 | 306 | ||||||
| 2025-08-14 | 13F | Harwood Advisory Group, LLC | 35 | 0,00 | 2 | 0,00 | ||||
| 2025-08-14 | 13F | Essential Planning, LLC. | 10 914 | 0,01 | 699 | 8,05 | ||||
| 2025-07-28 | 13F | Harbour Investments, Inc. | 47 945 | 13,58 | 3 069 | 22,62 | ||||
| 2025-08-08 | 13F | Pnc Financial Services Group, Inc. | 3 872 | 0,00 | 248 | 7,86 | ||||
| 2025-08-26 | NP | EVGLX - The E-Valuator Growth (70%-85%) RMS Fund Service Class Shares | 52 505 | 3 361 | ||||||
| 2025-08-13 | 13F | Jackson Creek Investment Advisors LLC | 8 954 | 0,27 | 1 | |||||
| 2025-07-18 | 13F | Bartlett & Co. Wealth Management Llc | 939 | 0,00 | 60 | 9,09 | ||||
| 2025-08-07 | 13F | Verus Capital Partners, Llc | 8 167 | 5,18 | 523 | 13,48 | ||||
| 2025-08-14 | 13F | Goldman Sachs Group Inc | 78 849 | 191,95 | 5 047 | 215,24 | ||||
| 2025-07-15 | 13F | Garrett Investment Advisors LLC | 4 342 | 0,00 | 278 | 7,78 | ||||
| 2025-05-08 | NP | QALTX - Quantified Alternative Investment Fund Investor Class Shares | 211 | −96,30 | 13 | −96,55 | ||||
| 2025-07-24 | 13F | Ronald Blue Trust, Inc. | 81 | 0,00 | 5 | 25,00 | ||||
| 2025-08-26 | NP | EVCLX - The E-Valuator Conservative (15%-30%) RMS Fund Service Class Shares | 3 920 | 251 | ||||||
| 2025-07-22 | 13F | Simplicity Wealth,LLC | 0 | −100,00 | 0 | |||||
| 2025-08-13 | 13F | Stenger Family Office, LLC | 0 | −100,00 | 0 | |||||
| 2025-08-19 | 13F | Advisory Services Network, LLC | 3 935 | 0,00 | 258 | 10,30 | ||||
| 2025-07-28 | 13F | Axxcess Wealth Management, Llc | 3 561 | 1,40 | 228 | 9,13 |