Grundläggande statistik
| Institutionella ägare | 163 total, 163 long only, 0 short only, 0 long/short - change of 5,16% MRQ |
| Genomsnittlig portföljallokering | 0.3757 % - change of 2,29% MRQ |
| Institutionella aktier (lång) | 13 780 876 (ex 13D/G) - change of 1,67MM shares 13,83% MRQ |
| Institutionellt värde (lång) | $ 496 402 USD ($1000) |
Institutionellt ägande och aktieägare
SPDR Index Shares Funds - SPDR S&P Emerging Markets Dividend ETF (US:EDIV) har 163 Institutionella ägare och aktieägare som har lämnat in 13D/G- eller 13F-formulär till Securities Exchange Commission (SEC). Dessa institut innehar totalt 13,780,876 aktier. Största aktieägare inkluderar Cetera Investment Advisers, Trust Co, LPL Financial LLC, Morgan Stanley, Wells Fargo & Company/mn, Bank Of America Corp /de/, Northwestern Mutual Wealth Management Co, Royal Bank Of Canada, AE Wealth Management LLC, and UBS Group AG .
SPDR Index Shares Funds - SPDR S&P Emerging Markets Dividend ETF (ARCA:EDIV) Institutionell ägarstruktur visar institutioners och fonders nuvarande positioner i företaget, samt de senaste förändringarna i positionernas storlek. Större aktieägare kan vara enskilda investerare, fonder, hedgefonder eller institutioner. Bilaga 13D visar att investeraren äger (eller ägde) mer än 5% av företaget och avser (eller avsåg) att aktivt eftersträva en förändring av affärsstrategin. Schedule 13G indikerar en passiv investering på över 5%.
The share price as of September 18, 2025 is 39,75 / share. Previously, on September 19, 2024, the share price was 37,57 / share. This represents an increase of 5,80% over that period.

Fondsentimentets poäng
Fondsentimentet poängen(fka Ägarackumulation-poäng) visar vilka aktier som är mest köpta av fonder. Det är resultatet av en sofistikerad kvantitativ flerfaktormodell som identifierar företag med de högsta nivåerna av institutionell ackumulering. Poängsättningsmodellen använder en kombination av den totala ökningen av redovisade ägare, förändringarna i portföljallokeringarna för dessa ägare och andra mått. Siffran sträcker sig från 0 till 100, där högre siffror indikerar en högre nivå av ackumulering i förhållande till sina konkurrenter, och 50 är genomsnittet.
Uppdateringsfrekvens: Dagligen
Se Ownership Explorer, som innehåller en lista över de högst rankade företagen.
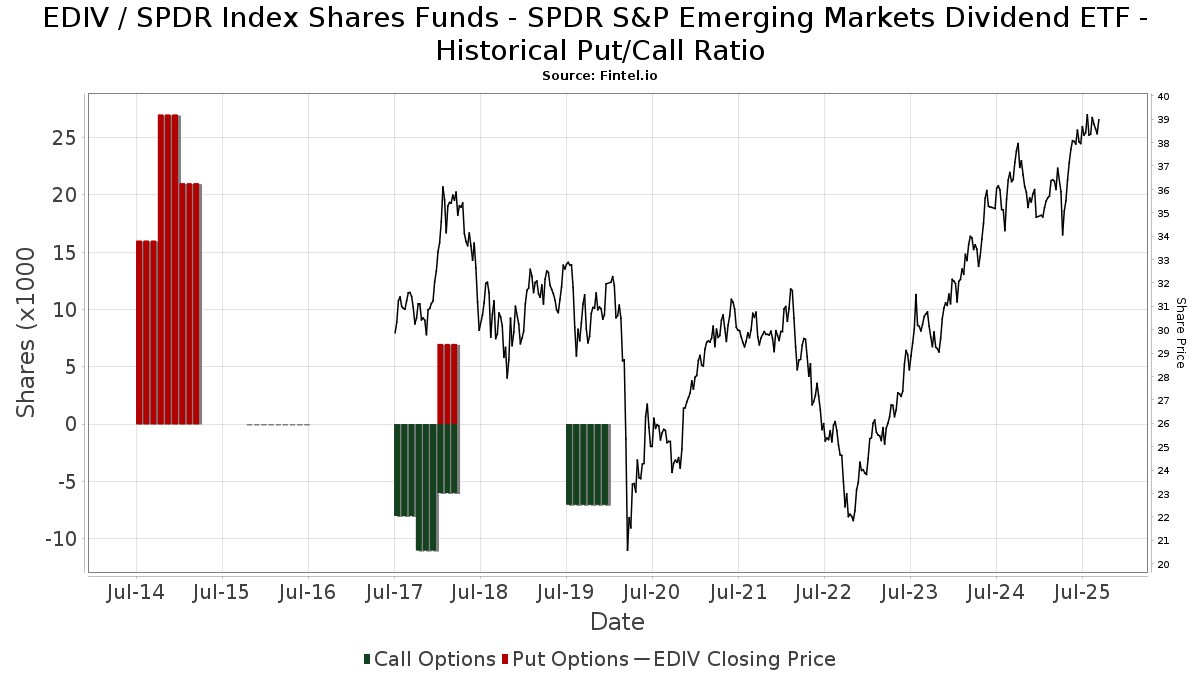
Institutionell sälj/köp-kvot
Förutom att rapportera vanliga eget kapital- och skuldemissioner måste institutioner med mer än 100MM tillgångar under förvaltning också avslöja sina innehav av sälj- och köpoptioner. Eftersom säljoptioner i allmänhet indikerar ett negativt sentiment och köpoptioner indikerar ett positivt sentiment, kan vi få en uppfattning om det övergripande institutionella sentimentet genom att plotta förhållandet mellan säljoptioner och köpoptioner. Diagrammet till höger visar det historiska förhållandet mellan sälj- och köpoptioner för detta instrument.
Genom att använda sälj/köp-kvoten som en indikator på aktieägarnas sentiment undviker man en av de största bristerna med att använda det totala institutionella ägandet, nämligen att en betydande del av de förvaltade tillgångarna investeras passivt för att följa index. Passivt förvaltade fonder köper vanligtvis inte optioner, så indikatorn för sälj/köp-kvoten ger en bättre bild av stämningen i aktivt förvaltade fonder.
13F- och NPORT-arkiveringar
Detaljer om 13F-arkiveringar är gratis. Detaljer om NP-arkiveringar kräver ett premiummedlemskap. Gröna rader indikerar nya positioner. Röda rader indikerar stängda positioner. Klicka på länk symbolen för att se hela transaktionshistoriken.
Uppgradera
för att låsa upp premiumdata och exportera till Excel ![]() .
.
| Fil Datum | Källa | Investerare | Typ | Genomsnittligt pris (beräknat) |
Aktier | Δ Aktier (%) |
Rapporterat värde (1000 USD) |
Δ Värde (%) |
Portföljallokering (%) |
|
|---|---|---|---|---|---|---|---|---|---|---|
| 2025-08-08 | 13F | Foundations Investment Advisors, LLC | 11 487 | 51,30 | 438 | 61,25 | ||||
| 2025-07-24 | 13F | IFP Advisors, Inc | 75 896 | 11,82 | 2 893 | 19,40 | ||||
| 2025-07-30 | 13F | Roman Butler Fullerton & Co | 7 808 | 16,97 | 303 | 29,06 | ||||
| 2025-08-06 | 13F | Golden State Wealth Management, LLC | 1 320 | 0,00 | 50 | 6,38 | ||||
| 2025-08-13 | 13F | Colonial Trust Co / SC | 200 | 0,00 | 8 | 0,00 | ||||
| 2025-08-06 | 13F | Wedbush Securities Inc | 13 459 | 1 | ||||||
| 2025-08-18 | 13F/A | National Bank Of Canada /fi/ | 1 615 | 0,00 | 62 | 7,02 | ||||
| 2025-08-05 | 13F | Cherry Tree Wealth Management, LLC | 8 014 | −3,92 | 305 | 2,69 | ||||
| 2025-07-16 | 13F | Old Port Advisors | 86 963 | −18,89 | 3 315 | −13,38 | ||||
| 2025-07-14 | 13F | Farmers & Merchants Investments Inc | 503 | 0,00 | 19 | 11,76 | ||||
| 2025-08-19 | 13F | Asset Dedication, LLC | 22 294 | −0,86 | 850 | 5,86 | ||||
| 2025-08-05 | 13F | Intellectus Partners, LLC | 5 690 | −7,67 | 217 | −1,82 | ||||
| 2025-07-18 | 13F | Truist Financial Corp | 55 202 | 4,40 | 2 104 | 11,50 | ||||
| 2025-08-26 | NP | EVAGX - The E-Valuator Aggressive Growth (85%-99%) RMS Fund Service Class Shares | 82 338 | −0,48 | 3 139 | 6,26 | ||||
| 2025-04-22 | 13F | Synergy Financial Management, LLC | 0 | −100,00 | 0 | |||||
| 2025-08-19 | 13F | Advisory Services Network, LLC | 0 | −100,00 | 0 | |||||
| 2025-08-05 | 13F | Scarborough Advisors, LLC | 1 238 | 47 | ||||||
| 2025-08-01 | 13F | Rossby Financial, LCC | 507 | 1,81 | 19 | 11,76 | ||||
| 2025-08-12 | 13F | Steward Partners Investment Advisory, Llc | 229 093 | 247,49 | 8 733 | 271,14 | ||||
| 2025-07-28 | 13F | Rosenberg Matthew Hamilton | 1 270 | 48 | ||||||
| 2025-07-23 | 13F | InTrack Investment Management Inc | 7 566 | 288 | ||||||
| 2025-07-21 | 13F | Ameritas Advisory Services, LLC | 31 867 | 1 215 | ||||||
| 2025-08-14 | 13F | Fiduciary Trust Co | 40 933 | 527,13 | 1 560 | 569,53 | ||||
| 2025-08-13 | 13F | M&t Bank Corp | 273 046 | −12,28 | 10 409 | −6,33 | ||||
| 2025-05-05 | 13F | Coastwise Capital Group, LLC | 0 | −100,00 | 0 | |||||
| 2025-08-06 | 13F | New Millennium Group LLC | 33 | 0,00 | 1 | 0,00 | ||||
| 2025-08-13 | 13F | ESG Planning | 43 598 | −0,74 | 1 662 | 6,00 | ||||
| 2025-07-23 | 13F | RiverTree Advisors, LLC | 9 516 | −43,00 | 363 | −39,16 | ||||
| 2025-08-26 | NP | EVTTX - The E-Valuator Conservative/Moderate (30%-50%) RMS Fund Service Class Shares | 5 094 | −3,27 | 194 | 3,74 | ||||
| 2025-08-19 | 13F | Anchor Investment Management, LLC | 950 | 0,00 | 36 | 9,09 | ||||
| 2025-08-14 | 13F | Smartleaf Asset Management LLC | 15 801 | −15,88 | 603 | −10,55 | ||||
| 2025-08-26 | NP | EVMLX - The E-Valuator Moderate (50%-70%) RMS Fund Service Class Shares | 30 591 | −1,20 | 1 166 | 5,52 | ||||
| 2025-08-13 | 13F | Crescent Grove Advisors, LLC | 9 127 | 0,00 | 348 | 6,77 | ||||
| 2025-07-29 | 13F | Manchester Financial Inc | 31 372 | 90,27 | 1 196 | 103,23 | ||||
| 2025-08-08 | 13F | Horrell Capital Management, Inc. | 1 222 | 0,00 | 47 | 6,98 | ||||
| 2025-08-07 | 13F | Allworth Financial LP | 442 | 0,00 | 17 | 6,67 | ||||
| 2025-08-12 | 13F | Financial Advocates Investment Management | 12 746 | −8,19 | 486 | −2,02 | ||||
| 2025-07-25 | 13F | Atria Wealth Solutions, Inc. | 10 168 | 13,80 | 392 | 22,96 | ||||
| 2025-08-15 | 13F | Kestra Advisory Services, LLC | 0 | −100,00 | 0 | |||||
| 2025-07-28 | 13F | Tower Wealth Partners, Inc. | 158 944 | 1,88 | 6 059 | 8,78 | ||||
| 2025-08-08 | 13F | Avantax Advisory Services, Inc. | 23 581 | 899 | ||||||
| 2025-08-06 | 13F | AE Wealth Management LLC | 289 124 | −22,94 | 11 021 | −17,71 | ||||
| 2025-08-26 | NP | EVGLX - The E-Valuator Growth (70%-85%) RMS Fund Service Class Shares | 84 248 | −0,90 | 3 212 | 5,83 | ||||
| 2025-08-14 | 13F | Jane Street Group, Llc | 108 072 | 13,71 | 4 120 | 21,40 | ||||
| 2025-08-14 | 13F | Ameriprise Financial Inc | 85 521 | 81,10 | 3 254 | 93,06 | ||||
| 2025-08-13 | 13F | WCG Wealth Advisors LLC | 0 | −100,00 | 0 | |||||
| 2025-08-06 | 13F | Legacy Wealth Managment, LLC/ID | 0 | −100,00 | 0 | |||||
| 2025-08-13 | 13F | Johnson Financial Group, Inc. | 39 400 | 1 502 | ||||||
| 2025-08-11 | 13F | Private Advisor Group, LLC | 8 590 | 0,89 | 327 | 7,92 | ||||
| 2025-05-12 | 13F | Independent Advisor Alliance | 0 | −100,00 | 0 | |||||
| 2025-08-04 | 13F | Atria Investments Llc | 52 003 | 2,30 | 1 982 | 9,26 | ||||
| 2025-08-06 | 13F | Columbia River Financial Group, LLC | 74 293 | 2,28 | 3 | 0,00 | ||||
| 2025-08-05 | 13F | swisspartners Advisors Ltd | 233 650 | 3,90 | 8 896 | 25,30 | ||||
| 2025-08-07 | 13F | Samalin Investment Counsel, LLC | 5 474 | 209 | ||||||
| 2025-07-11 | 13F | Bond & Devick Financial Network, Inc. | 220 242 | 2,98 | 8 396 | 9,95 | ||||
| 2025-07-22 | 13F | Global Strategic Investment Solutions, LLC | 9 602 | 0,00 | 366 | 7,02 | ||||
| 2025-08-15 | 13F | Morgan Stanley | 823 343 | 4,95 | 31 386 | 12,06 | ||||
| 2025-08-15 | 13F | Equitable Holdings, Inc. | 80 075 | 109,01 | 3 052 | 123,26 | ||||
| 2025-07-07 | 13F | Trust Co | 1 313 205 | 17,22 | 50 059 | 25,17 | ||||
| 2025-05-09 | 13F | Thoroughbred Financial Services, Llc | 0 | −100,00 | 0 | |||||
| 2025-08-12 | 13F | Cowa, Llc | 6 097 | 232 | ||||||
| 2025-07-31 | 13F | Trademark Financial Management, LLC | 19 841 | −69,59 | 756 | −67,54 | ||||
| 2025-07-10 | 13F | Global Financial Private Client, LLC | 0 | −100,00 | 0 | |||||
| 2025-07-30 | 13F | LifeWealth Investments, LLC | 9 340 | −8,61 | 356 | −2,20 | ||||
| 2025-08-14 | 13F | UBS Group AG | 283 415 | 5,75 | 10 804 | 12,91 | ||||
| 2025-07-25 | 13F | Concurrent Investment Advisors, LLC | 242 807 | −2,68 | 9 256 | 3,92 | ||||
| 2025-08-13 | 13F | Mount Yale Investment Advisors, LLC | 814 | 31 | ||||||
| 2025-08-19 | 13F | Cape Investment Advisory, Inc. | 483 | 30,89 | 18 | 38,46 | ||||
| 2025-07-22 | 13F | Miracle Mile Advisors, LLC | 8 022 | 0,00 | 306 | 6,64 | ||||
| 2025-08-11 | 13F | Bradley Foster & Sargent Inc/ct | 5 273 | 201 | ||||||
| 2025-07-15 | 13F | FLP Wealth Management, LLC | 0 | −100,00 | 0 | |||||
| 2025-07-18 | 13F | B.O.S.S. Retirement Advisors, LLC | 31 241 | −28,87 | 1 191 | −24,06 | ||||
| 2025-08-12 | 13F | Gladstone Institutional Advisory LLC | 40 358 | 4,66 | 1 538 | 11,77 | ||||
| 2025-08-12 | 13F | Proequities, Inc. | 0 | 0 | ||||||
| 2025-07-22 | 13F | Simplicity Wealth,LLC | 0 | −100,00 | 0 | |||||
| 2025-07-14 | 13F | Maryland Capital Advisors Inc. | 15 320 | −0,20 | 584 | 6,39 | ||||
| 2025-08-18 | 13F | Front Row Advisors LLC | 100 | 0,00 | 4 | 0,00 | ||||
| 2025-07-31 | 13F | Glass Jacobson Investment Advisors llc | 228 | −47,10 | 9 | −46,67 | ||||
| 2025-08-06 | 13F | Commonwealth Equity Services, Llc | 152 509 | 65,38 | 6 | 66,67 | ||||
| 2025-08-14 | 13F | Federation des caisses Desjardins du Quebec | 75 | 0,00 | 3 | 0,00 | ||||
| 2025-08-11 | 13F | Anderson Financial Strategies, LLC | 121 075 | 2,91 | 4 615 | 9,88 | ||||
| 2025-07-11 | 13F | Farther Finance Advisors, LLC | 9 208 | 289,67 | 351 | 317,86 | ||||
| 2025-08-14 | 13F | Mariner, LLC | 107 236 | 4,69 | 4 088 | 11,79 | ||||
| 2025-08-15 | 13F | First Heartland Consultants, Inc. | 158 333 | 3,30 | 6 036 | 10,31 | ||||
| 2025-07-29 | NP | GINX - SGI Enhanced Global Income ETF | 58 710 | −6,50 | 2 213 | −1,03 | ||||
| 2025-08-13 | 13F | Jones Financial Companies Lllp | 48 943 | 124,16 | 1 867 | 138,62 | ||||
| 2025-08-11 | 13F | Pineridge Advisors LLC | 1 064 | −6,58 | 41 | 0,00 | ||||
| 2025-08-08 | NP | QALTX - Quantified Alternative Investment Fund Investor Class Shares | 123 | −92,96 | 5 | −93,55 | ||||
| 2025-08-06 | 13F/A | Three Cord True Wealth Management, LLC | 164 494 | 6,53 | 6 270 | 13,75 | ||||
| 2025-07-15 | 13F | Retirement Income Solutions, Inc | 14 169 | 29,06 | 540 | 38,11 | ||||
| 2025-07-24 | 13F | Us Bancorp \de\ | 14 292 | 5,21 | 545 | 12,40 | ||||
| 2025-07-31 | 13F | AlTi Global, Inc. | 15 440 | 0,00 | 590 | 7,29 | ||||
| 2025-04-21 | 13F | Trivant Custom Portfolio Group, LLC | 0 | −100,00 | 0 | −100,00 | ||||
| 2025-08-01 | 13F | Envestnet Asset Management Inc | 164 625 | 23,84 | 6 275 | 32,24 | ||||
| 2025-08-12 | 13F | CIBC Private Wealth Group, LLC | 0 | −100,00 | 0 | |||||
| 2025-07-24 | 13F | Blair William & Co/il | 1 878 | 0,16 | 72 | 7,58 | ||||
| 2025-08-08 | 13F | Capital Investment Advisory Services, LLC | 9 356 | 6,62 | 357 | 13,74 | ||||
| 2025-07-29 | 13F | Systelligence, LLC | 205 737 | −0,85 | 7 843 | 5,87 | ||||
| 2025-07-10 | 13F | Redhawk Wealth Advisors, Inc. | 101 741 | 3,22 | 3 878 | 10,23 | ||||
| 2025-08-05 | 13F | Bank Of Montreal /can/ | 1 380 | 58,26 | 53 | 67,74 | ||||
| 2025-08-14 | 13F | Royal Bank Of Canada | 322 345 | 5,66 | 12 287 | 12,83 | ||||
| 2025-08-04 | 13F | Creative Financial Designs Inc /adv | 148 511 | 34,87 | 5 661 | 44,01 | ||||
| 2025-08-05 | 13F | Dunhill Financial, LLC | 3 115 | 119 | ||||||
| 2025-05-09 | 13F | Pnc Financial Services Group, Inc. | 0 | −100,00 | 0 | −100,00 | ||||
| 2025-08-11 | 13F | TD Waterhouse Canada Inc. | 38 | 0,00 | 1 | 0,00 | ||||
| 2025-08-13 | 13F | Northwestern Mutual Wealth Management Co | 392 923 | 27,36 | 14 978 | 36,00 | ||||
| 2025-08-12 | 13F | Park Square Financial Group, LLC | 3 413 | −28,54 | 130 | −23,53 | ||||
| 2025-07-14 | 13F | AdvisorNet Financial, Inc | 224 | 0,00 | 9 | 14,29 | ||||
| 2025-09-04 | 13F/A | Advisor Group Holdings, Inc. | 86 815 | 3,79 | 3 309 | 10,82 | ||||
| 2025-08-14 | 13F | Glen Eagle Advisors, LLC | 36 | 2,86 | 1 | 0,00 | ||||
| 2025-08-08 | 13F | Emerald Investment Partners, Llc | 54 740 | −2,46 | 2 087 | 4,14 | ||||
| 2025-08-05 | 13F | Advisors Preferred, LLC | 123 | −92,96 | 5 | −93,55 | ||||
| 2025-08-08 | 13F | Principal Financial Group Inc | 17 113 | 652 | ||||||
| 2025-08-12 | 13F | Titleist Asset Management, Llc | 95 432 | 1,75 | 3 638 | 8,63 | ||||
| 2025-05-01 | 13F | Quest 10 Wealth Builders, Inc. | 9 577 | −5,87 | 342 | −4,75 | ||||
| 2025-04-15 | 13F | Noble Wealth Management PBC | 3 200 | 60,00 | 114 | 62,86 | ||||
| 2025-08-14 | 13F | Raymond James Financial Inc | 268 740 | −4,07 | 10 244 | 2,43 | ||||
| 2025-08-14 | 13F | Mml Investors Services, Llc | 109 242 | 78,56 | 4 | 100,00 | ||||
| 2025-07-22 | 13F | Luken Investment Analytics, LLC | 0 | −100,00 | 0 | |||||
| 2025-08-11 | 13F | Nomura Asset Management Co Ltd | 12 246 | 0,00 | 467 | 6,64 | ||||
| 2025-05-02 | 13F | Whittier Trust Co Of Nevada Inc | 0 | −100,00 | 0 | |||||
| 2025-08-06 | 13F | Able Wealth Management LLC | 62 016 | 26,88 | 2 364 | 35,55 | ||||
| 2025-08-14 | 13F | Fmr Llc | 2 422 | 39,20 | 92 | 48,39 | ||||
| 2025-08-04 | 13F | Assetmark, Inc | 18 | 0,00 | 1 | |||||
| 2025-07-11 | 13F | SILVER OAK SECURITIES, Inc | 22 251 | −5,38 | 848 | 0,59 | ||||
| 2025-08-11 | 13F | Tidemark, LLC | 4 174 | 62,73 | 159 | 74,73 | ||||
| 2025-07-18 | 13F | Impact Capital Partners LLC | 0 | −100,00 | 0 | |||||
| 2025-08-12 | 13F | O'shaughnessy Asset Management, Llc | 1 241 | 2,73 | 47 | 9,30 | ||||
| 2025-08-13 | 13F/A | StoneX Group Inc. | 0 | −100,00 | 0 | |||||
| 2025-07-29 | 13F | Rodgers & Associates, LTD | 54 476 | 0,93 | 2 077 | 7,79 | ||||
| 2025-08-14 | 13F | Financial Advisory Service, Inc. | 177 | 0,00 | 7 | 0,00 | ||||
| 2025-07-08 | 13F | Nbc Securities, Inc. | 145 | −34,09 | 0 | |||||
| 2025-05-28 | 13F | Wealth Management Associates, Inc. | 0 | −100,00 | 0 | −100,00 | ||||
| 2025-04-11 | 13F | Insight Advisors, LLC/ PA | 0 | −100,00 | 0 | |||||
| 2025-08-04 | 13F | Kovack Advisors, Inc. | 5 451 | 208 | ||||||
| 2025-08-13 | 13F | Russell Investments Group, Ltd. | 115 | 4 | ||||||
| 2025-08-13 | 13F | Invesco Ltd. | 18 601 | −8,14 | 709 | −1,80 | ||||
| 2025-08-11 | 13F | Principal Securities, Inc. | 10 461 | 1 130,71 | 399 | 1 272,41 | ||||
| 2025-08-14 | 13F | Wiley Bros.-aintree Capital, Llc | 35 575 | 112,48 | 1 363 | 127,00 | ||||
| 2025-08-06 | 13F | RFG - Bristol Wealth Advisors, LLC | 113 689 | 4 334 | ||||||
| 2025-07-17 | 13F | Nelson, Van Denburg & Campbell Wealth Management Group, LLC | 10 018 | 1,68 | 382 | 8,55 | ||||
| 2025-08-14 | 13F | Wells Fargo & Company/mn | 715 084 | 6,84 | 27 259 | 14,07 | ||||
| 2025-08-12 | 13F | BlackRock, Inc. | 1 604 | 61 | ||||||
| 2025-08-14 | 13F | Old Mission Capital Llc | 17 925 | −73,09 | 683 | −71,28 | ||||
| 2025-08-08 | 13F/A | Sterling Capital Management LLC | 17 | −15,00 | 1 | |||||
| 2025-08-12 | 13F | Deutsche Bank Ag\ | 20 438 | 20,10 | 779 | 28,34 | ||||
| 2025-07-31 | 13F | Perissos Private Wealth Management, LLC | 0 | −100,00 | 0 | |||||
| 2025-07-14 | 13F | Financial Advisory Partners, Llc | 9 832 | 11,23 | 375 | 18,73 | ||||
| 2025-08-12 | 13F | SRS Capital Advisors, Inc. | 0 | −100,00 | 0 | |||||
| 2025-08-08 | 13F | Creative Planning | 8 287 | 9,23 | 316 | 16,67 | ||||
| 2025-07-21 | 13F | Compass Planning Associates Inc | 1 492 | 1,70 | 57 | 7,69 | ||||
| 2025-08-14 | 13F | Colony Group, LLC | 43 818 | −4,38 | 1 670 | 2,08 | ||||
| 2025-07-23 | 13F | Drake & Associates, LLC | 238 741 | 4,16 | 9 101 | 11,22 | ||||
| 2025-08-13 | 13F | Smith, Moore & Co. | 7 655 | 292 | ||||||
| 2025-08-14 | 13F | Bank Of America Corp /de/ | 589 465 | 97,92 | 22 470 | 111,34 | ||||
| 2025-07-10 | 13F | Wealth Enhancement Advisory Services, Llc | 66 824 | 2 597 | ||||||
| 2025-07-11 | 13F | Williams Financial, LLC | 0 | −100,00 | 0 | |||||
| 2025-08-13 | 13F | IAG Wealth Partners, LLC | 793 | 0,00 | 30 | 7,14 | ||||
| 2025-08-08 | 13F | Cetera Investment Advisers | 1 345 538 | 6,12 | 51 292 | 13,32 | ||||
| 2025-05-15 | 13F | EP Wealth Advisors, Inc. | 0 | −100,00 | 0 | −100,00 | ||||
| 2025-08-13 | 13F | Continuum Advisory, LLC | 5 391 | 25,99 | 206 | 34,87 | ||||
| 2025-07-14 | 13F | Park Avenue Securities Llc | 0 | −100,00 | 0 | |||||
| 2025-07-31 | 13F | City State Bank | 4 143 | 0,00 | 158 | 6,80 | ||||
| 2025-08-12 | 13F | LPL Financial LLC | 1 073 062 | 25,70 | 40 905 | 34,23 | ||||
| 2025-08-14 | 13F | Bnp Paribas | 34 249 | 6,83 | 1 306 | 14,07 | ||||
| 2025-08-05 | 13F | Mma Asset Management Llc | 10 508 | −5,19 | 401 | 1,27 | ||||
| 2025-08-11 | 13F | Brown Brothers Harriman & Co | 8 | 0,00 | 0 | |||||
| 2025-08-12 | 13F | Summit Global Investments | 57 204 | −1,04 | 2 | 0,00 | ||||
| 2025-08-01 | 13F | Ashton Thomas Private Wealth, LLC | 8 330 | 0,00 | 318 | 6,73 | ||||
| 2025-08-08 | 13F | Fortis Group Advisors, LLC | 98 | 0,00 | 4 | 0,00 | ||||
| 2025-08-11 | 13F | Comprehensive Wealth Management, LLC | 109 372 | 147,19 | 4 169 | 164,03 | ||||
| 2025-05-12 | 13F | Jpmorgan Chase & Co | 0 | −100,00 | 0 | |||||
| 2025-05-13 | 13F | Measured Risk Portfolios, Inc. | 0 | −100,00 | 0 | |||||
| 2025-07-25 | 13F | Envestnet Portfolio Solutions, Inc. | 6 378 | −26,81 | 243 | −21,86 | ||||
| 2025-08-07 | 13F | Kestra Private Wealth Services, Llc | 146 895 | 11,81 | 5 600 | 19,38 | ||||
| 2025-08-29 | NP | COIDX - IDX Commodity Opportunities Fund Institutional Class Shares | 12 500 | 476 | ||||||
| 2025-08-13 | 13F | Transce3nd, LLC | 1 354 | −28,25 | 52 | −23,88 | ||||
| 2025-08-13 | 13F | Plan Group Financial, LLC | 103 668 | 40,30 | 3 952 | 49,83 | ||||
| 2025-04-17 | 13F | Authentikos Wealth Advisory, LLC | 0 | −100,00 | 0 | |||||
| 2025-05-15 | 13F | Citadel Advisors Llc | 0 | −100,00 | 0 | |||||
| 2025-09-09 | 13F | Cambridge Financial Group, LLC | 12 563 | 0,00 | 479 | 6,70 | ||||
| 2025-07-29 | 13F | Private Trust Co Na | 2 492 | 1,67 | 95 | 8,05 | ||||
| 2025-08-04 | 13F | Premier Path Wealth Partners, LLC | 76 512 | 0,03 | 2 917 | 6,81 | ||||
| 2025-08-18 | 13F | Geneos Wealth Management Inc. | 2 190 | 7,09 | 83 | 13,70 | ||||
| 2025-08-29 | 13F | Centaurus Financial, Inc. | 186 678 | 0,27 | 7 | 16,67 | ||||
| 2025-08-14 | 13F | Comerica Bank | 2 827 | −0,11 | 108 | 5,94 | ||||
| 2025-07-25 | 13F | LRI Investments, LLC | 650 | 0,00 | 25 | 4,35 | ||||
| 2025-07-31 | 13F | Cambridge Investment Research Advisors, Inc. | 115 143 | 34,17 | 4 | 33,33 | ||||
| 2025-07-07 | 13F | RDA Financial Network | 38 628 | 4,75 | 1 473 | 11,85 | ||||
| 2025-07-22 | 13F | USAdvisors Wealth Management, LLC | 48 447 | 3,35 | 2 | 0,00 | ||||
| 2025-08-26 | NP | EVCLX - The E-Valuator Conservative (15%-30%) RMS Fund Service Class Shares | 3 466 | −1,73 | 132 | 5,60 | ||||
| 2025-07-29 | 13F | Stratos Wealth Partners, LTD. | 11 676 | 1,43 | 445 | 8,54 | ||||
| 2025-04-30 | 13F | Synergy Investment Management, LLC | 0 | −100,00 | 0 | |||||
| 2025-08-12 | 13F | Change Path, LLC | 18 205 | −0,60 | 694 | 6,13 |